. 2019 May 21;47(9):4442-4448.
doi: 10.1093/nar/gkz246.

AnnoTree: visualization and exploration of a functionally annotated microbial tree of life

Affiliations

AnnoTree: visualization and exploration of a functionally annotated microbial tree of life

Kerrin Mendler et al. Nucleic Acids Res. .

Abstract

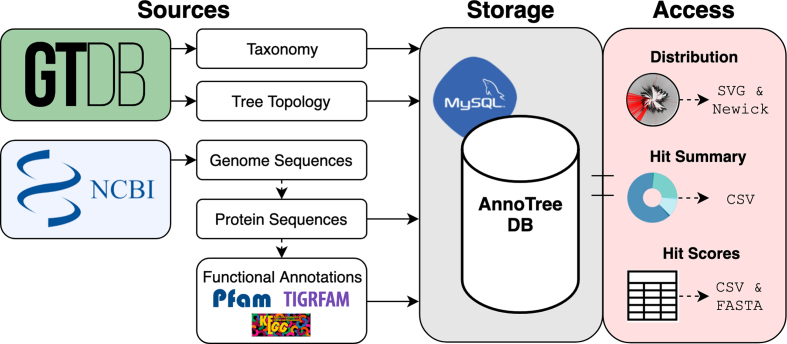
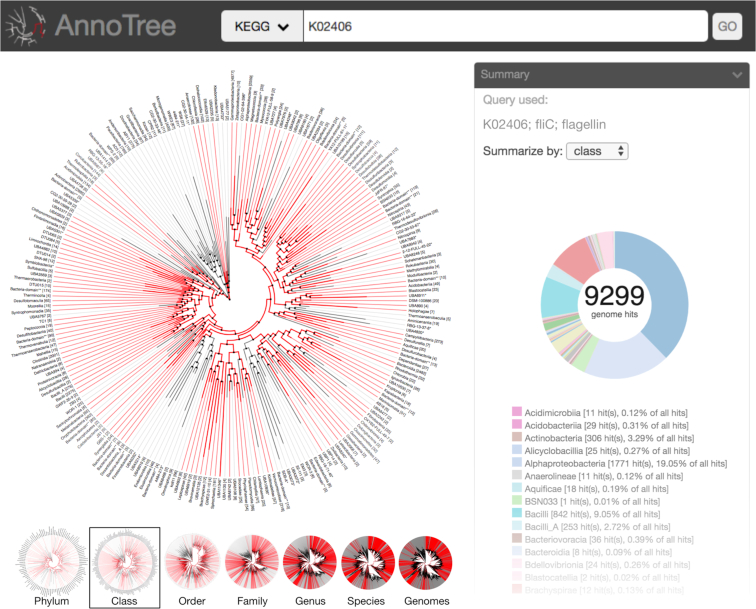
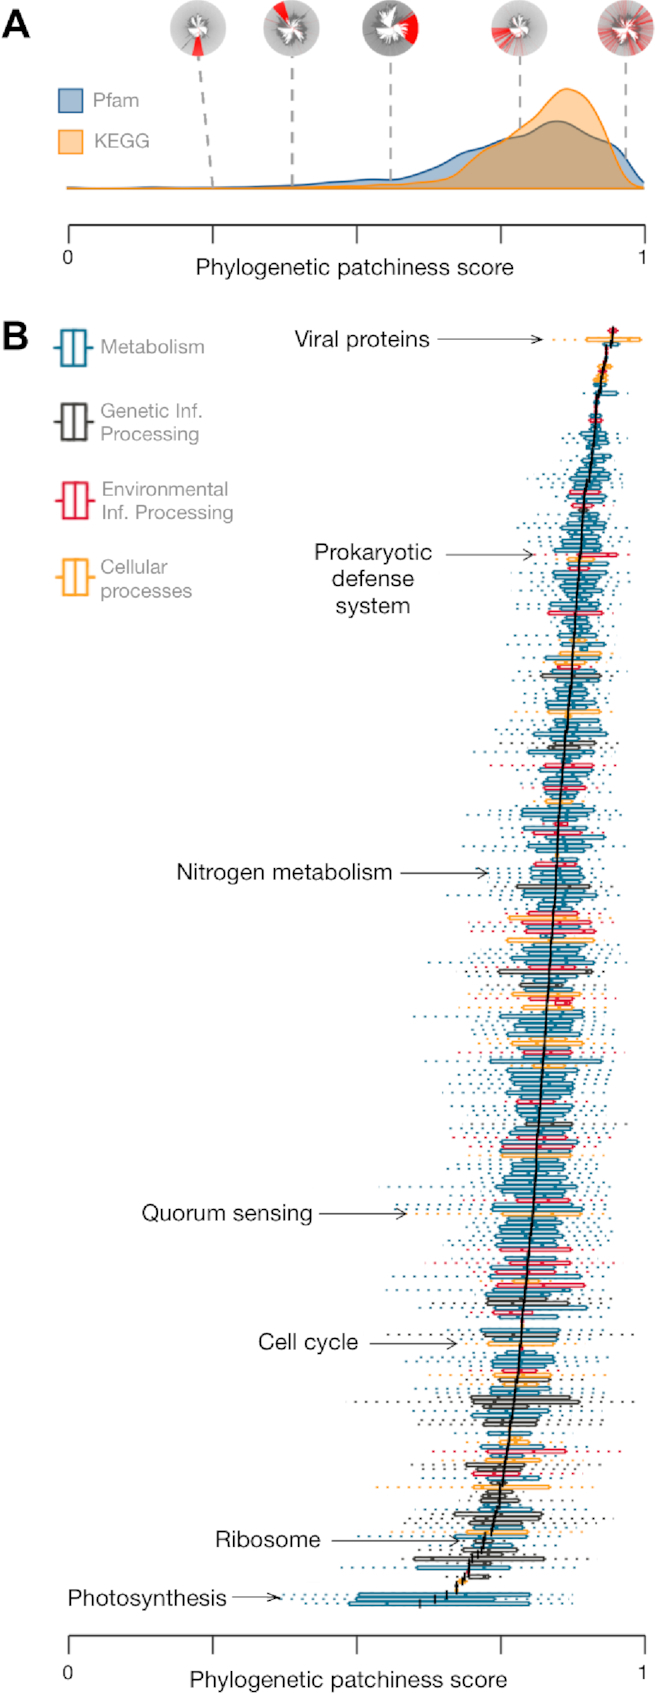
Bacterial genomics has revolutionized our understanding of the microbial tree of life; however, mapping and visualizing the distribution of functional traits across bacteria remains a challenge. Here, we introduce AnnoTree-an interactive, functionally annotated bacterial tree of life that integrates taxonomic, phylogenetic and functional annotation data from over 27 000 bacterial and 1500 archaeal genomes. AnnoTree enables visualization of millions of precomputed genome annotations across the bacterial and archaeal phylogenies, thereby allowing users to explore gene distributions as well as patterns of gene gain and loss in prokaryotes. Using AnnoTree, we examined the phylogenomic distributions of 28 311 gene/protein families, and measured their phylogenetic conservation, patchiness, and lineage-specificity within bacteria. Our analyses revealed widespread phylogenetic patchiness among bacterial gene families, reflecting the dynamic evolution of prokaryotic genomes. Genes involved in phage infection/defense, mobile elements, and antibiotic resistance dominated the list of most patchy traits, as well as numerous intriguing metabolic enzymes that appear to have undergone frequent horizontal transfer. We anticipate that AnnoTree will be a valuable resource for exploring prokaryotic gene histories, and will act as a catalyst for biological and evolutionary hypothesis generation. AnnoTree is freely available at http://annotree.uwaterloo.ca.


Figures

Figure 1.
Figure 1.
Data flow in the AnnoTree application. Raw values and computed features derived from data obtained from the GTDB is stored in a MySQL database that will be updated to match revisions made to the GTDB. Users can access data relevant to their queries in the form of figures and tables that are rendered in their browser. The figures themselves and the data used to generate them can be downloaded in various file formats from the AnnoTree interface.
Figure 2.
Figure 2.
AnnoTree interface overview. AnnoTree can be queried with any number of KO identifiers, Pfam families, Tigrfam families, or NCBI taxon identification numbers to display a mapping of those traits on the GTDB tree at any resolution. Lineages containing at least one genome with the query annotation(s) are highlighted in red. A circle chart displays a taxonomic summary of the genomes containing the flagellin gene (KO identifier: K02406) at a chosen taxonomic level. Smaller trees below show the interactive view when different taxonomic levels are selected by the user. When a highlighted node is clicked, a window appears (not shown in figure) displaying basic taxonomic information, zooming options, and annotation confidence scores.
Figure 3.
Figure 3.
Phylogenetic patchiness of annotations inferred using AnnoTree. Phylogenetic patchiness was computed for each KEGG KO identifier and Pfam protein family using the consistency index (CI), a common homoplasy metric representing the inverse of the minimum possible number of state changes (trait gain or loss) given the tree topology. The final phylogenetic patchiness score is equal to -log(CI)/log(family size) where family size is the total number of genomes containing the trait. (A) Density plot showing the distribution of phylogenetic patchiness scores of Pfam protein families and KO identifiers with different visual examples of varying patchiness (red = present; gray = absent). The phylogenetic distribution plots are, from left to right: K10922 (transmembrane regulatory protein ToxS), K18955 (WhiB transcriptional regulator), PF01848 (ATP12 chaperone), PF01848 (Hok/Sok antitoxin system), and K07495 (putative transposase). (B) Mean-sorted box plots containing phylogenetic patchiness scores of KO identifiers in their respective KEGG pathways and KEGG BRITE categories. The mean patchiness score of a set of KO identifiers in a KEGG pathway or KEGG BRITE category is indicated by a black line.

References

    1. Venter J.C., Remington K., Heidelberg J.F., Halpern A.L., Rusch D., Eisen Ja., Wu D., Paulsen I., Nelson K.E., Nelson W. et al.. Environmental genome shotgun sequencing of the Sargasso Sea. Science. 2004; 304:66–74. - PubMed
    1. Demuth J., Hahn M.. The life and death of gene families. Bioessays. 2009; 31:29–39. - PubMed
    1. Andersson J.O., Hirt R.P., Foster P.G., Roger A.J.. Evolution of four gene families with patchy phylogenetic distributions: influx of genes into protist genomes. BMC Evol. Biol. 2006; 6:27. - PMC - PubMed
    1. Ravenhall M., Skunca N., Lassalle F., Dessimoz C.. Inferring horizontal gene transfer. PLoS Comput. Biol. 2015; 11:e1004095. - PMC - PubMed
    1. Camacho C., Coulouris G., Avagyan V., Ma N., Papadopoulos J., Bealer K., Madden T.L.. BLAST plus: architecture and applications. BMC Bioinformatics. 2009; 10:1. - PMC - PubMed

Publication types