Review
. 2020 Jan;75(1):37-51.
doi: 10.1037/amp0000452. Epub 2019 May 13.

Understanding, educating, and supporting children with specific learning disabilities: 50 years of science and practice

Affiliations
Review

Understanding, educating, and supporting children with specific learning disabilities: 50 years of science and practice

Elena L Grigorenko et al. Am Psychol. 2020 Jan.

Abstract

Specific learning disabilities (SLDs) are highly relevant to the science and practice of psychology, both historically and currently, exemplifying the integration of interdisciplinary approaches to human conditions. They can be manifested as primary conditions-as difficulties in acquiring specific academic skills-or as secondary conditions, comorbid to other developmental disorders such as attention-deficit hyperactivity disorder. In this synthesis of historical and contemporary trends in research and practice, we mark the 50th anniversary of the recognition of SLDs as a disability in the United States. Specifically, we address the manifestations, occurrence, identification, comorbidity, etiology, and treatment of SLDs, emphasizing the integration of information from the interdisciplinary fields of psychology, education, psychiatry, genetics, and cognitive neuroscience. SLDs, exemplified here by specific word reading, reading comprehension, mathematics, and written expression disabilities, represent spectrum disorders, each occurring in approximately 5% to 15% of the school-aged population. In addition to risk for academic deficiencies and related functional social, emotional, and behavioral difficulties, those with SLDs often have poorer long-term social and vocational outcomes. Given the high rate of occurrence of SLDs and their lifelong negative impact on functioning if not treated, it is important to establish and maintain effective prevention, surveillance, and treatment systems involving professionals from various disciplines trained to minimize the risk and maximize the protective factors for SLDs. (PsycINFO Database Record (c) 2020 APA, all rights reserved).


Figures

Figure 1.
Figure 1.
The Individuals with Disabilities Education Act (IDEA), enacted in 1975 as Public Law 94–142, mandates that children and youth ages 3–21 with disabilities be provided a free and appropriate public school education in the least restricted environment. The percentage of children served by federally mandated special education programs, out of total public school enrollment, increased from 8.3 percent to 13.8 percent between 1976–77 and 2004–05. Much of this overall increase can be attributed to a rise in the percentage of students identified as having SLD from 1976–77 (1.8 percent) to 2004–05 (5.7 percent). The overall percentage of students being served in programs for those with disabilities decreased between 2004–05 (13.8 percent) and 2013–14 (12.9 percent). However, there were different patterns of change in the percentages served with some specific conditions between 2004–05 and 2013–14. The percentage of children identified with SLD declined from 5.7 percent to 4.5 percent of the total public school enrollment during this period. This number is highly variable by state: for example, in 2011 it ranged from 2.3% in Kentucky to 13.8% in Puerto Rico, as there is much variability in the procedures used to identify SLD, and disproportional demographic representation. Figure by Janet Croog.
Figure 2.
Figure 2.
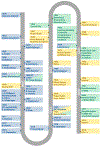
A schematic timeline of the three stands of science and practice in the field of SLD. The colors represent the strands (blue—first, yellow—second, and green—third). Blue: provided phenomenological descriptions and generated hypotheses about the gene-brain bases of SLD (specifically, dyslexia or SRD); it also provided the first evidence that the most effective treatment approaches are skill-based and reflect cognitive models of the conditions. Yellow: differentiated SLD from other comorbid conditions. Green: stressed the importance of focusing on SLD in academic settings and developing both preventive and remediational evidence-based approaches to managing these conditions. Due to space constraints, the names of many highly influential scientists (e.g., Marilyn Adams, Joseph Torgesen, Isabelle Liberman, Keith Stanovich, among others) who shaped the field of SLD have been omitted. Figure by Janet Croog.
Figure 3.
Figure 3.
Results of meta-analyses of functional neuroimaging studies that exemplify the distribution of activation patterns in different reading- (A) and mathematics- (B) related networks, corresponding to componential models of the skills. A (Left panel, light blue): A lexical network in the basal occipito-temporal regions and in the left inferior parietal cortex. A (Middle panel, dark blue): A sublexical network, primarily involving regions of the left temporo-parietal lobe extending from the left anterior fusiform region. A (Right panel): Activation likelihood estimation map of foci from the word>pseudowords (light blue) and pseudowords>words (dark blue) contrasts. The semantic processing cluster is shown in green. B (Left panel): A number-processing network, primarily involving a region of the parietal lobe. B (Middle panel): An arithmetic-processing network, primarily involving regions of the frontal and parietal lobes. B (Right panel): Children (red) and adult (pink) meta-analyses of brain areas associated with numbers and calculations. Figure by Janet Croog.
Figure 4.
Figure 4.
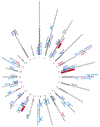
A schematic representation of the genetic regions and gene-candidates linked to or associated with SRD and reading-related processes (shown in blue), and SMD and mathematics-related processes (shown in red). Dark blue signifies more studied loci and genes. Blue highlighted in red indicate the genes implicated in both SRD and SMD. Figure by Janet Croog.

References

    1. *Arsalidou M, Pawliw-Levac M, Sadeghi M, & Pascual-Leone J (2017). Brain areas associated with numbers and calculations in children: Meta-analyses of fMRI studies. Developmental Cognitive Neuroscience. doi:10.1016/j.dcn.2017.08.002 - DOI - PMC - PubMed
    1. Ashkenazi S, Black JM, Abrams DA, Hoeft F, & Menon V (2013). Neurobiological underpinnings of math and reading learning disabilities. Journal of Learning Disabilities, 46, 549–569. - PMC - PubMed
    1. Balu R, Zhu P, Doolittle F, Schiller E, Jenkins J, & Gersten R (2015). Evaluation of response to intervention practices for elementary school reading. Washington, DC: National Center for Educational Evaluation and Regional Assistance.
    1. *Barquero LA, Davis N, & Cutting LE (2014). Neuroimaging of reading intervention: a systematic review and activation likelihood estimate meta-analysis. PLoS ONE, 9, e83668. - PMC - PubMed
    1. Berninger VW (2004). Understanding the graphia in developmental dysgraphia: A developmental neuropsychological perspective for disorders in producing written language In Dewey D & Tupper D (Eds.), Developmental motor disorders: A neuropsychological perspective (pp. 189–233). Guilford Press: New York, NY.