Review
. 2019 Jul;130(7):1098-1124.
doi: 10.1016/j.clinph.2019.04.004. Epub 2019 Apr 15.

Brain networks and their relevance for stroke rehabilitation

Affiliations
Review

Brain networks and their relevance for stroke rehabilitation

Adrian G Guggisberg et al. Clin Neurophysiol. 2019 Jul.

Abstract

Stroke has long been regarded as focal disease with circumscribed damage leading to neurological deficits. However, advances in methods for assessing the human brain and in statistics have enabled new tools for the examination of the consequences of stroke on brain structure and function. Thereby, it has become evident that stroke has impact on the entire brain and its network properties and can therefore be considered as a network disease. The present review first gives an overview of current methodological opportunities and pitfalls for assessing stroke-induced changes and reorganization in the human brain. We then summarize principles of plasticity after stroke that have emerged from the assessment of networks. Thereby, it is shown that neurological deficits do not only arise from focal tissue damage but also from local and remote changes in white-matter tracts and in neural interactions among wide-spread networks. Similarly, plasticity and clinical improvements are associated with specific compensatory structural and functional patterns of neural network interactions. Innovative treatment approaches have started to target such network patterns to enhance recovery. Network assessments to predict treatment response and to individualize rehabilitation is a promising way to enhance specific treatment effects and overall outcome after stroke.

Keywords: Network; Plasticity; Rehabilitation; Stroke.


Conflict of interest statement

Conflict of interest

The authors declare no conflicts of interest.

Figures

Figure 1.
Figure 1.. Schematic representation of different synchronization types.
Modified after (Guggisberg et al., 2015), with permission.
Figure 2.
Figure 2.. Ipsilesional M1 excitability measured with TMS.
A) The stimulus response curve (SRC) evoked by transcranial magnetic stimulation of increasing intensities (35% to 80% of maximum stimulator output) were plotted for a single stroke patient. B, C, D). A three-parameter Boltzmann function was fitted to all SRCs that reached a plateau using the Levenberg-Marquard least-squares algorithm (insert) to extract three curve parameters: MEPmax (plateau of SRC), S50 (TMS intensity needed to elicit an MEP of an amplitude corresponding to the inflection point) and M (slope) parameter. The data are plotted for 15 stroke patients with cortical or subcortical location of a stroke affecting their M1 output system and 11 right handed age- matched healthy subjects. The number of subjects for each parameter is indicated in the figure. MEPmax was statistically significant lower in stroke subjects than in healthy subjects (p=0.02). There was no statistically significant difference in M-parameter and S50 between stroke and healthy subjects. This approach povides a more detailed analysis of M1 excitability. When measured at a constant level of motor activity (here, at rest), the three SRC curve parameters (S50, M-parameter, and MEPmax) completely characterize the input-output relationship of the M1 corticospinal output(Devanne et al., 1997). Therefore, a change in one or more parameters indicates a change in the input-output relationship in iM1 and its corticospinal output. The abnormally low MEPmax found here suggests that CST output from iM1 was reduced after stroke (Buetefisch et al., 2018).
Figure 3.
Figure 3.
Effect of stroke location along the primary motor output (either cortical or subcortical) on primary motor cortex excitability. Paired pulse TMS was used to measure short interval cortical inhibition (SICI) in 23 chronic stroke patients. The data was compared to 20 healthy age matched controls. Upper panel: CONTROL (square) and contra-lesional M1 of patients with cortical (open triangle, A) and subcortical location of infarction (open inverted triangle, B). Lower panel: CONTROL (squares) and ipsilesional M1 of patients with cortical (black triangle, C) and subcortical location of infarction (black inverted triangle, D). Mean ± SE. * p< .05, ** p< .02, *** p< .01. Inserts illustrate the location of the lesion (black dot) and the site of TMS (inverted T). CS= intensity of conditioning stimulus, MT = motor threshold. (Butefisch et al., 2008).
Figure 4.
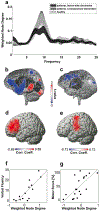
Figure 4.. Disruptions of network interactions after stroke are associated with neurological deficits.
The affected hemisphere of stroke patients shows a global reduction of alpha-band coherence with all other brain regions (a). This disconnection concerns brain areas that are clinically dysfunctional. For instance, a patient with Broca aphasia shows reduced global alpha coherence in left front-temporal areas (b, blue color; stroke lesion is marked in dark gray), a patient with motor deficits in precentral areas (c). Local decreases in alpha-band coherence between a given brain area and the rest of the brain are linearly correlated with neurological deficits. In other words, the less a brain region remains coherent with the rest of the brain after a lesion, the worse patients perform in corresponding motor and cognitive functions (d-g). Modified after (Dubovik et al., 2012) with permission.
Figure 5.
Figure 5.. Network plasticity after stroke.
Perilesional areas can show enhanced beta-band coherence with the rest of the brain during the first weeks after stroke. An example is shown in yellow-red in (a), the lesion is marked in dark grey. Enhancement of coherence between ipsilesional M1 and the rest of the brain was associated with better motor improvement in the subsequent months (b). Coherence between Broca’s area and the rest of the brain was associated with language improvement (c). Modified after (Nicolo et al., 2015b) with permission.

References

    1. Achard S, Salvador R, Whitcher B, Suckling J, Bullmore E. A resilient, low-frequency, small-world human brain functional network with highly connected association cortical hubs. J Neurosci. 2006;26:63–72. doi: 10.1523/JNEUROSCI.3874-05.2006. - DOI - PMC - PubMed
    1. Adeyemo BO, Simis M, Macea DD, Fregni F. Systematic review of parameters of stimulation, clinical trial design characteristics, and motor outcomes in non-invasive brain stimulation in stroke. Front Psychiatry. 2012;3:88. doi:10.3389/fpsyt.2012.00088. - DOI - PMC - PubMed
    1. Adhikari MH, Hacker CD, Siegel JS, Griffa A, Hagmann P, Deco G, et al. Decreased integration and information capacity in stroke measured by whole brain models of resting state activity. Brain. 2017;140:1068–85. doi: 10.1093/brain/awx021. - DOI - PMC - PubMed
    1. Adluru G, Gur Y, Anderson JS, Richards LG, Adluru N, DiBella EV. Assessment of white matter microstructure in stroke patients using NODDI. Conf Proc IEEE Eng Med Biol Soc 2014;2014:742–5. doi: 10.1109/EMBC.2014.6943697. - DOI - PMC - PubMed
    1. Agarwal S, Sair HI, Pillai JJ. The Resting-State Functional Magnetic Resonance Imaging Regional Homogeneity Metrics-Kendall's Coefficient of Concordance-Regional Homogeneity and Coherence-Regional Homogeneity-Are Valid Indicators of Tumor-Related Neurovascular Uncoupling. Brain Connect. 2017;7:228–35. doi: 10.1089/brain.2016.0482. - DOI - PMC - PubMed

Publication types

MeSH terms