

Prediction of Chronic Atrophic Gastritis and Gastric Neoplasms by Serum Pepsinogen Assay: A Systematic Review and Meta-Analysis of Diagnostic Test Accuracy
- PMID: 31083485
- PMCID: PMC6572271
- DOI: 10.3390/jcm8050657
Prediction of Chronic Atrophic Gastritis and Gastric Neoplasms by Serum Pepsinogen Assay: A Systematic Review and Meta-Analysis of Diagnostic Test Accuracy
Abstract
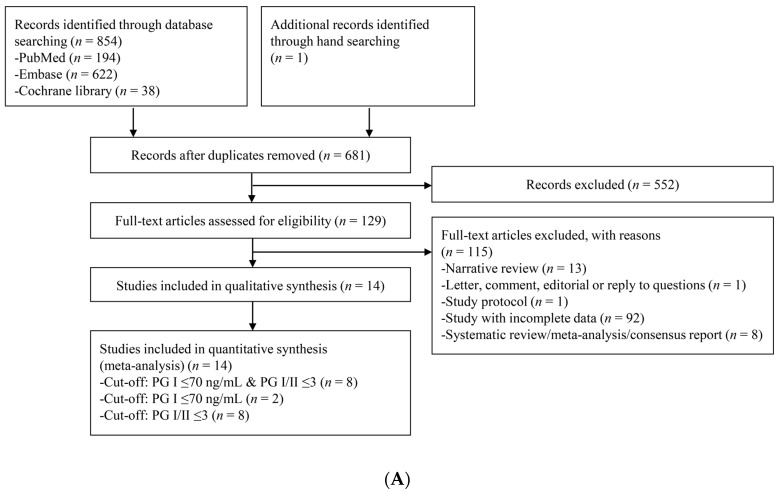
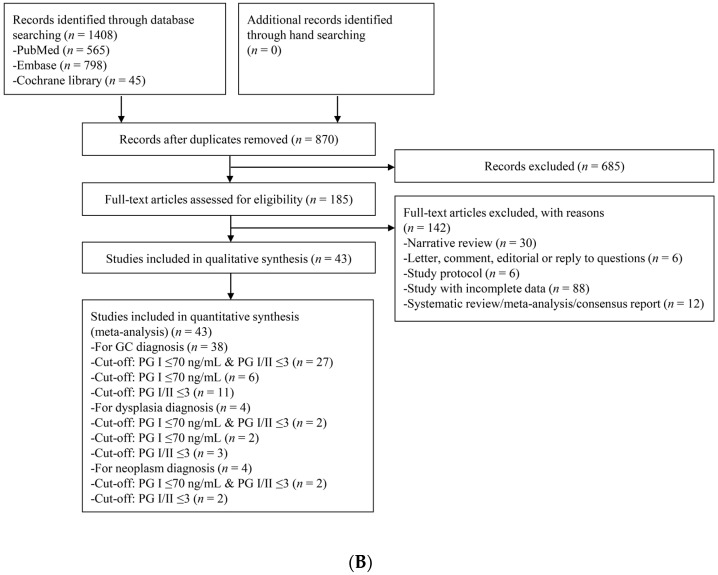
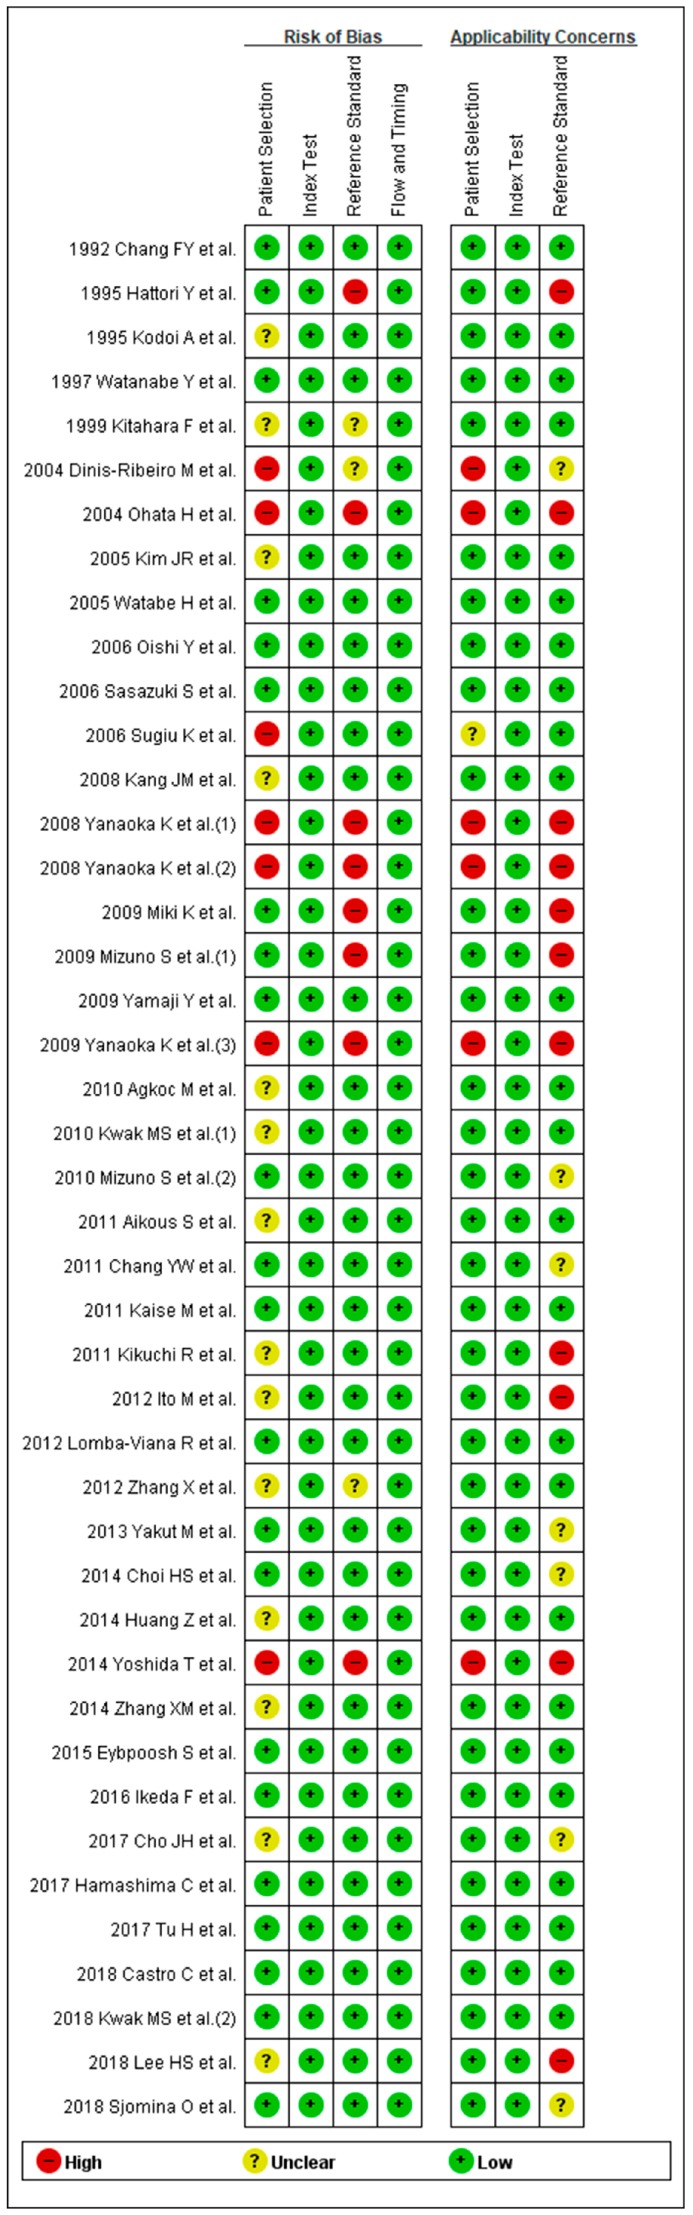
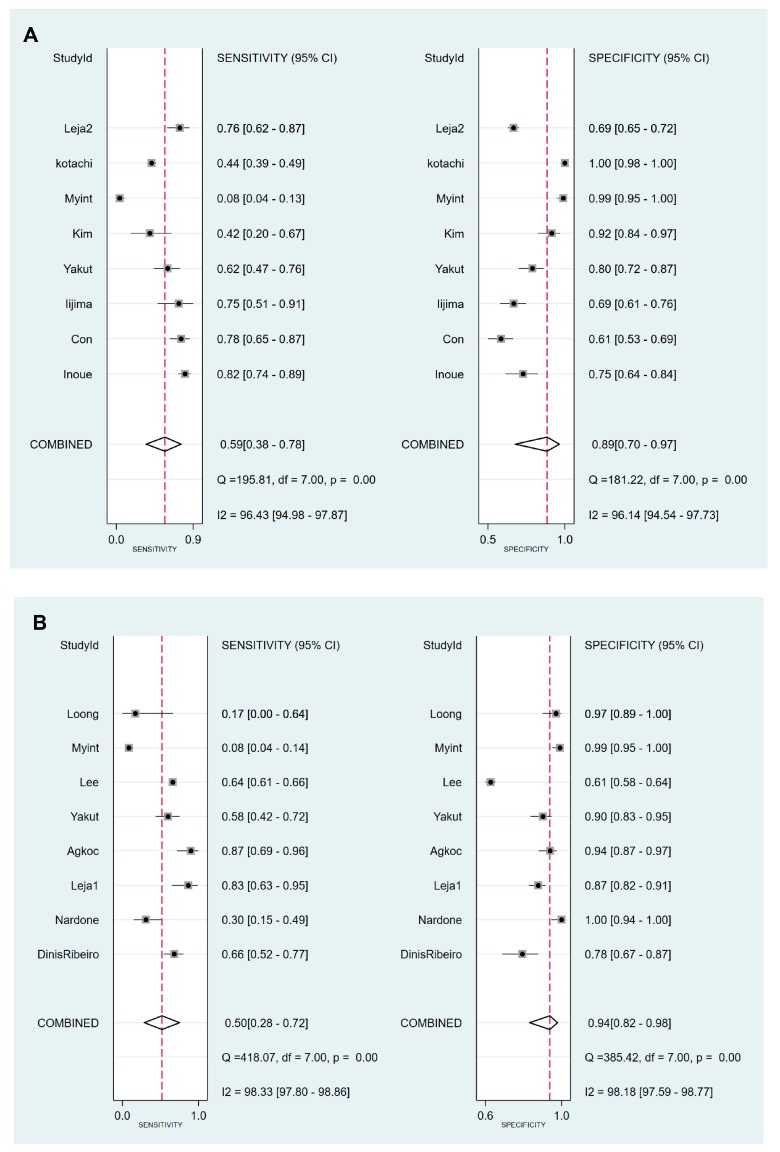
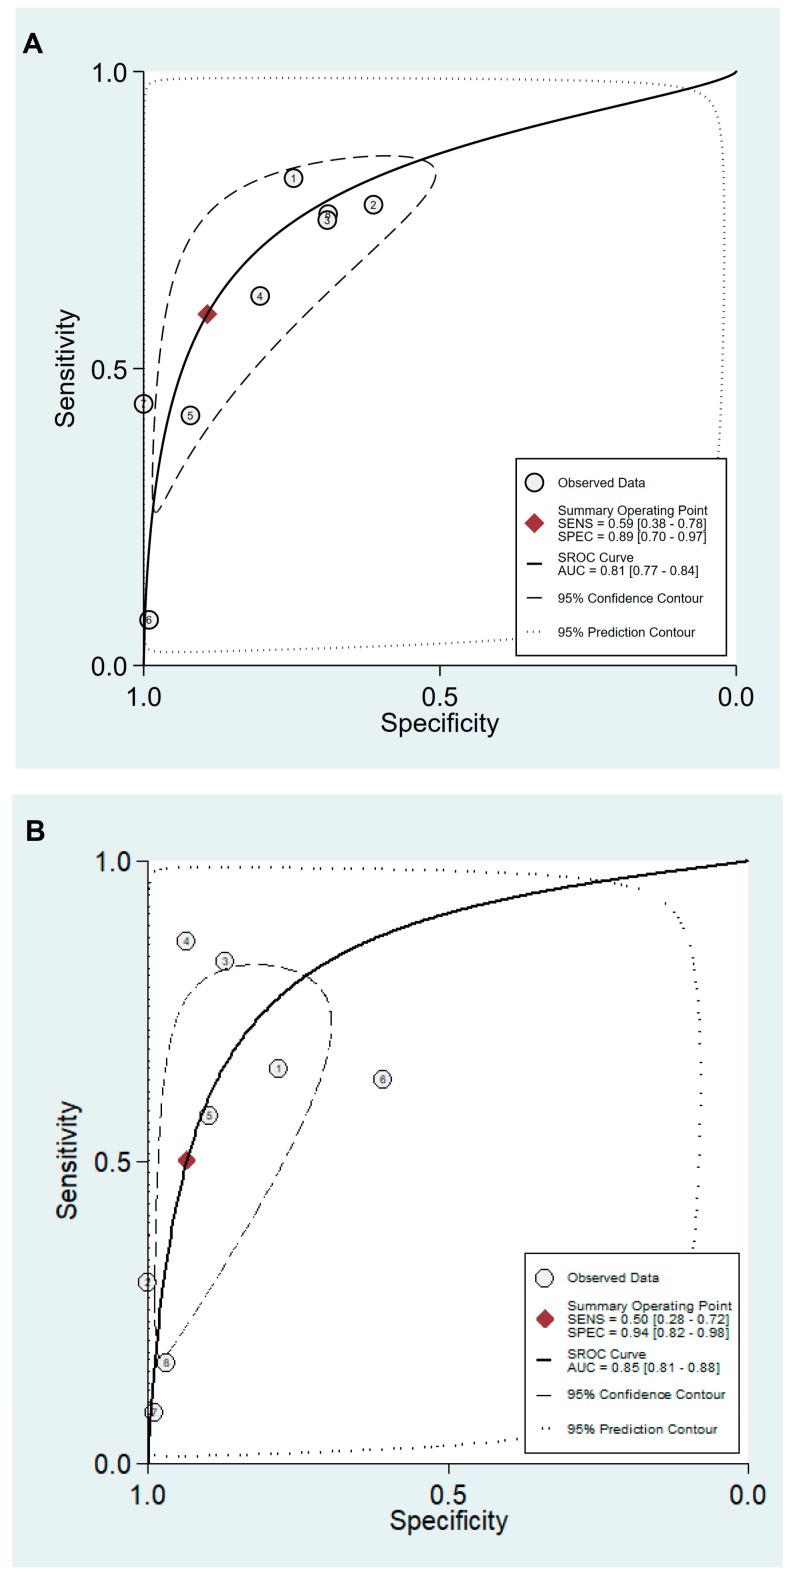
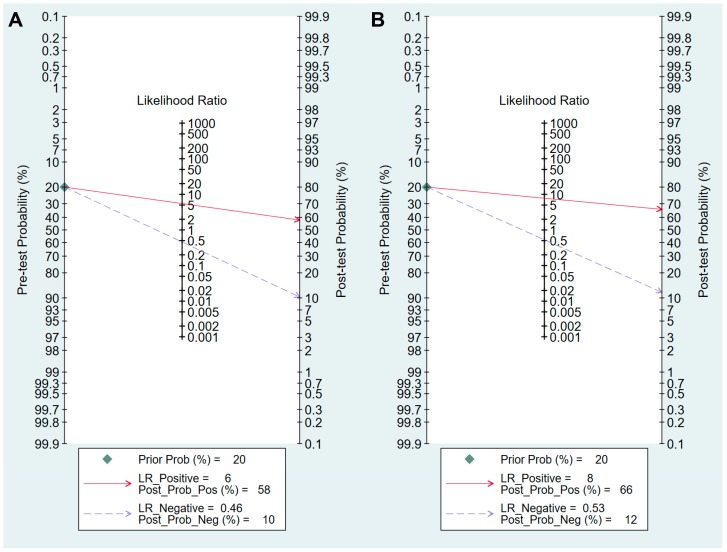
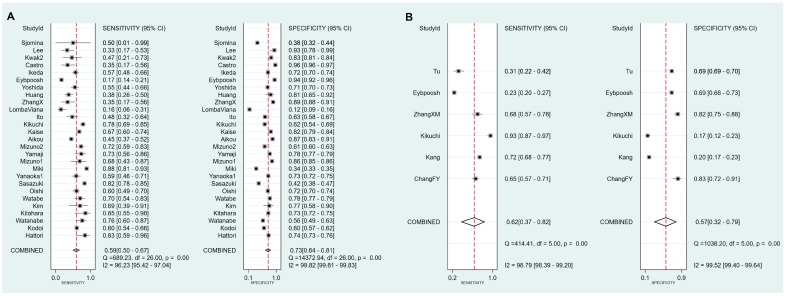
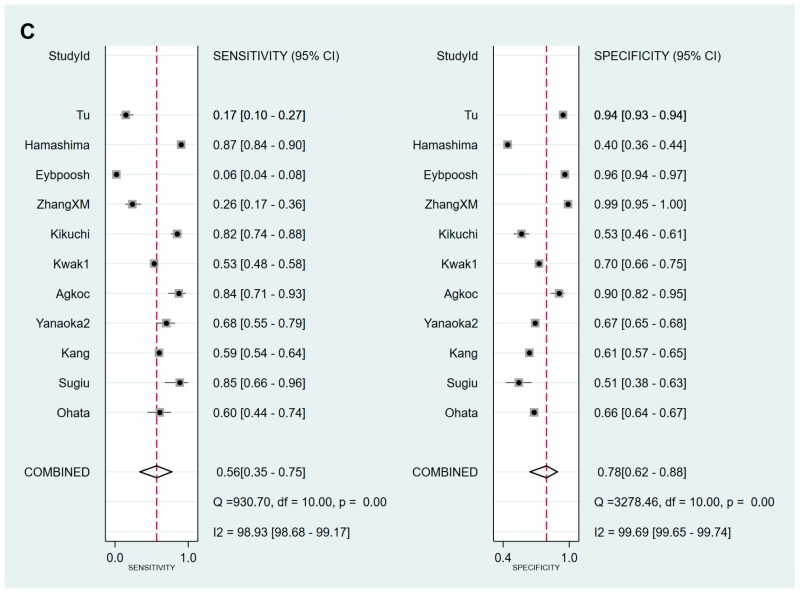
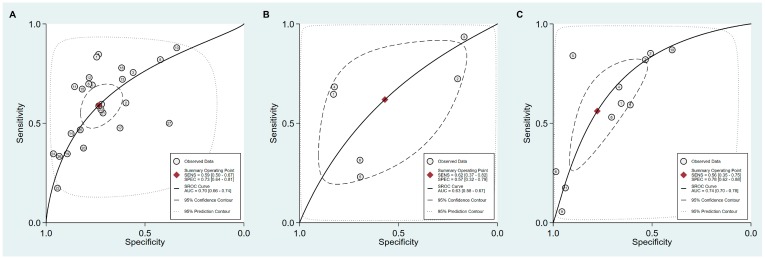
Serum pepsinogen assay (sPGA), which reveals serum pepsinogen (PG) I concentration and the PG I/PG II ratio, is a non-invasive test for predicting chronic atrophic gastritis (CAG) and gastric neoplasms. Although various cut-off values have been suggested, PG I ≤70 ng/mL and a PG I/PG II ratio of ≤3 have been proposed. However, previous meta-analyses reported insufficient systematic reviews and only pooled outcomes, which cannot determine the diagnostic validity of sPGA with a cut-off value of PG I ≤70 ng/mL and/or PG I/PG II ratio ≤3. We searched the core databases (MEDLINE, Cochrane Library, and Embase) from their inception to April 2018. Fourteen and 43 studies were identified and analyzed for the diagnostic performance in CAG and gastric neoplasms, respectively. Values for sensitivity, specificity, diagnostic odds ratio, and area under the curve with a cut-off value of PG I ≤70 ng/mL and PG I/PG II ratio ≤3 to diagnose CAG were 0.59, 0.89, 12, and 0.81, respectively and for diagnosis of gastric cancer (GC) these values were 0.59, 0.73, 4, and 0.7, respectively. Methodological quality and ethnicity of enrolled studies were found to be the reason for the heterogeneity in CAG diagnosis. Considering the high specificity, non-invasiveness, and easily interpretable characteristics, sPGA has potential for screening of CAG or GC.
Keywords: atrophic; gastric neoplasms; gastritis; pepsinogens.
Conflict of interest statement
The authors declare no conflict of interest.
Figures

Similar articles
-
Diagnostic performance of serum pepsinogen assay for the prediction of atrophic gastritis and gastric neoplasms: Protocol for a systematic review and meta-analysis.Medicine (Baltimore). 2019 Jan;98(4):e14240. doi: 10.1097/MD.0000000000014240. Medicine (Baltimore). 2019. PMID: 30681610 Free PMC article.
-
[Studies on the cut-off value of serum pepsinogen abnormality for screening chronic atrophic gastritis and gastric carcinoma].Zhonghua Liu Xing Bing Xue Za Zhi. 2006 Oct;27(10):840-4. Zhonghua Liu Xing Bing Xue Za Zhi. 2006. PMID: 17343174 Chinese.
-
[Correlation of serum pepsinogen level and gastric mucosal changes of residents in the high incidence area of gastric cancer].Zhonghua Zhong Liu Za Zhi. 2006 Jul;28(7):507-11. Zhonghua Zhong Liu Za Zhi. 2006. PMID: 17147114 Chinese.
-
Association of Helicobacter pylori infection with chronic atrophic gastritis: Meta-analyses according to type of disease definition.Int J Cancer. 2008 Aug 15;123(4):874-81. doi: 10.1002/ijc.23539. Int J Cancer. 2008. PMID: 18484586 Review.
-
Using serum pepsinogens wisely in a clinical practice.J Dig Dis. 2007 Feb;8(1):8-14. doi: 10.1111/j.1443-9573.2007.00278.x. J Dig Dis. 2007. PMID: 17261129 Review.
Cited by
-
Artificial Intelligence for the Prediction of Helicobacter Pylori Infection in Endoscopic Images: Systematic Review and Meta-Analysis Of Diagnostic Test Accuracy.J Med Internet Res. 2020 Sep 16;22(9):e21983. doi: 10.2196/21983. J Med Internet Res. 2020. PMID: 32936088 Free PMC article.
-
Development and Validation of Nomograms to Predict Operative Link for Gastritis Assessment Any-Stage and Stages III-IV in the Chinese High-Risk Gastric Cancer Population.Front Med (Lausanne). 2021 Aug 10;8:724566. doi: 10.3389/fmed.2021.724566. eCollection 2021. Front Med (Lausanne). 2021. PMID: 34447771 Free PMC article.
-
Association of serum pepsinogens and gastrin-17 with Helicobacter pylori infection assessed by urea breath test.Front Cell Infect Microbiol. 2022 Aug 16;12:980399. doi: 10.3389/fcimb.2022.980399. eCollection 2022. Front Cell Infect Microbiol. 2022. PMID: 36051244 Free PMC article.
-
Brand interchangeability of pepsinogen tests in the real-world setting after eradication of Helicobacter pylori: a community-based study.BMC Gastroenterol. 2022 Feb 18;22(1):69. doi: 10.1186/s12876-022-02155-7. BMC Gastroenterol. 2022. PMID: 35180851 Free PMC article.
-
Pathways of Gastric Carcinogenesis, Helicobacter pylori Virulence and Interactions with Antioxidant Systems, Vitamin C and Phytochemicals.Int J Mol Sci. 2020 Sep 3;21(17):6451. doi: 10.3390/ijms21176451. Int J Mol Sci. 2020. PMID: 32899442 Free PMC article. Review.
References
-
- World Health Organization (WHO) [(accessed on 1 October 2018)]; Available online: http://www.who.int/mediacentre/factsheets/fs297/en.
-
- Correa P. A human model of gastric carcinogenesis. Cancer Res. 1988;48:3554–3560. - PubMed
Grants and funding
LinkOut - more resources
Full Text Sources
Miscellaneous
