. 2019 May 21;321(19):1916-1925.
doi: 10.1001/jama.2019.4329.

Association of Household Income With Life Expectancy and Cause-Specific Mortality in Norway, 2005-2015

Affiliations

Association of Household Income With Life Expectancy and Cause-Specific Mortality in Norway, 2005-2015

Jonas Minet Kinge et al. JAMA. .

Abstract

Importance: Examining causes of death and making comparisons across countries may increase understanding of the income-related differences in life expectancy.

Objectives: To describe income-related differences in life expectancy and causes of death in Norway and to compare those differences with US estimates.

Design and setting: A registry-based study including all Norwegian residents aged at least 40 years from 2005 to 2015.

Exposures: Household income adjusted for household size.

Main outcomes and measures: Life expectancy at 40 years of age and cause-specific mortality.

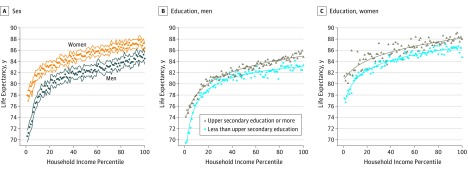
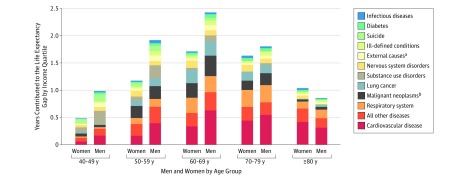
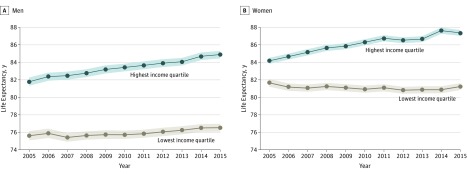
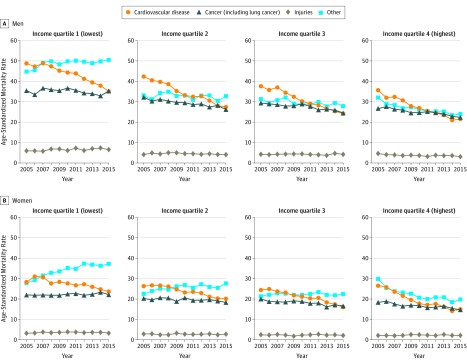
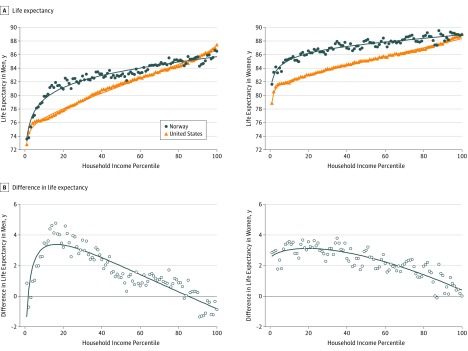
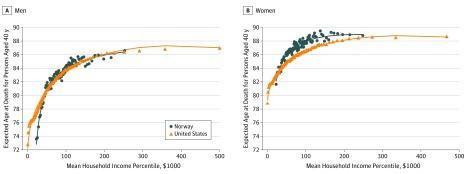
Results: In total, 3 041 828 persons contributed 25 805 277 person-years and 441 768 deaths during the study period (mean [SD] age, 59.3 years [13.6]; mean [SD] number of household members per person, 2.5 [1.3]). Life expectancy was highest for women with income in the top 1% (86.4 years [95% CI, 85.7-87.1]) which was 8.4 years (95% CI, 7.2-9.6) longer than women with income in the lowest 1%. Men with the lowest 1% income had the lowest life expectancy (70.6 years [95% CI, 69.6-71.6]), which was 13.8 years (95% CI, 12.3-15.2) less than men with the top 1% income. From 2005 to 2015, the differences in life expectancy by income increased, largely attributable to deaths from cardiovascular disease, cancers, chronic obstructive pulmonary disease, and dementia in older age groups and substance use deaths and suicides in younger age groups. Over the same period, life expectancy for women in the highest income quartile increased 3.2 years (95% CI, 2.7-3.7), while life expectancy for women in the lowest income quartile decreased 0.4 years (95% CI, -1.0 to 0.2). For men, life expectancy increased 3.1 years (95% CI, 2.5-3.7) in the highest income quartile and 0.9 years (95% CI, 0.2-1.6) in the lowest income quartile. Differences in life expectancy by income levels in Norway were similar to differences observed in the United States, except that life expectancy was higher in Norway in the lower to middle part of the income distribution in both men and women.

Conclusions and relevance: In Norway, there were substantial and increasing gaps in life expectancy by income level from 2005 to 2015. The largest differences in life expectancy between Norway and United States were for individuals in the lower to middle part of the income distribution.


Conflict of interest statement

Conflict of Interest Disclosures: Dr Kinge reported receiving grants from the Research Council of Norway during the conduct of the study. Dr Gjessing reported receiving grants from the Research Council of Norway during the conduct of the study and outside the submitted work. Dr Håberg reported receiving grants from the Research Council of Norway during the conduct of the study. No other disclosures were reported.

Figures

Figure 1.
Figure 1.. Life Expectancy by Income and Education Level in Norway, 2011-2015
The solid lines represent predicted life expectancy estimated from a fractional polynomial of income. Panel A shows life expectancy by income percentile with 95% CIs and panels B and C show life expectancy by income percentiles by highest and lowest level of education. Estimated life expectancy was based on actual mortality rates and is presented as expected age at death. Estimates are based on the total Norwegian population aged at least 40 years, excluding individuals with the lowest 3% income and individuals with immigrant background.
Figure 2.
Figure 2.. University Education, Residential Status, and Single-Person Households by Income Percentile in Norway, 2011-2015
Estimates were based on the total Norwegian population aged at least 40 years, excluding individuals with the lowest 3% income and individuals with immigrant background.
Figure 3.
Figure 3.. Gaps in Life Expectancy Between the Highest and Lowest Income Quartiles by Age and Causes of Death in Norway, 2011-2015
The vertical length of the bars show the number of years contributed to the difference in life expectancy. Estimated life expectancy was based on actual mortality rates and presented as expected age at death. Estimates were based on the total Norwegian population aged at least 40 years, excluding individuals with the lowest 3% income and individuals with immigrant background. The decomposition was done using Arriaga’s method.,, Nervous system disorders include Alzheimer disease and dementia. aInjuries excluding suicide and substance use. bExcluding lung cancer.
Figure 4.
Figure 4.. Annual Life Expectancy With 95% CIs for the Highest and Lowest Income Quartiles in Norway, 2005-2015
Estimated life expectancy was based on actual mortality rates and presented as expected age at death. Estimates were based on the total Norwegian population aged at least 40 years, excluding individuals with the lowest 3% income and individuals with immigrant background.
Figure 5.
Figure 5.. Age-Standardized Annual Mortality Rates for Select Causes of Death by Income Quartiles in Norway, 2005-2015
The age-specific death rates were weighted by the proportion of each group in the mean population in Norway from 2005 to 2011. Estimates were based on the total Norwegian population aged at least 40 years, excluding individuals with the lowest 3% income and individuals with immigrant background.
Figure 6.
Figure 6.. Life Expectancy by Income in Norway vs the United States
The solid lines represent predicted life expectancy estimated from a fractional polynomial of income. Life expectancy was estimated by a combination of actual mortality rates (individuals aged 40-76 years), forecasted mortality rates (individuals aged 77-90 years), and uniform sex-specific mortality rates (individuals aged ≥91 years) and was presented as expected age at death for individuals aged 40 years. Estimates were based on comparable populations in Norway and the United States according to Chetty et al.
Figure 7.
Figure 7.. Life Expectancy by Income in US Dollars in Norway and the United States, 2001-2014
The solid lines represent predicted life expectancy estimated from a fractional polynomial of income. Life expectancy was estimated by a combination of actual mortality rates (individuals aged 40-76 years), forecasted mortality rates (individuals aged 77-90 years), and uniform sex-specific mortality rates (individuals aged ≥91 years) and was presented as expected age at death for individuals aged 40 years. Estimates were based on comparable populations in Norway and the United States according to Chetty et al. The top income percentile was omitted for scaling purposes. The mean household income for US men in the top percentile was US $1.98 million and their expected age at death was 87.3 years. Corresponding numbers in Norwegian men were US $0.53 million and 86.5 years. The mean household income for US women in the top percentile was US $1.92 million and their expected age at death was 88.9 years. Corresponding numbers in Norwegian women were US $0.51 million and 88.9 years. The income variable was pretax household income for both the United States and Norway. Norwegian kroner was translated into US dollars using the 2011 individual consumption expenditure by household value of 9.797 from the International Comparison Program (http://www.worldbank.org/en/programs/icp#5).

Comment in

References

    1. Chetty R, Stepner M, Abraham S, et al. . The association between income and life expectancy in the United States, 2001-2014. JAMA. 2016;315(16):1750-1766. doi:10.1001/jama.2016.4226 - DOI - PMC - PubMed
    1. Mackenbach JP, Stirbu I, Roskam A-JR, et al. ; European Union Working Group on Socioeconomic Inequalities in Health . Socioeconomic inequalities in health in 22 European countries. N Engl J Med. 2008;358(23):2468-2481. doi:10.1056/NEJMsa0707519 - DOI - PubMed
    1. Kinge JM, Vallejo-Torres L, Morris S. Income related inequalities in avoidable mortality in Norway: a population-based study using data from 1994-2011. Health Policy. 2015;119(7):889-898. doi:10.1016/j.healthpol.2015.04.016 - DOI - PubMed
    1. Mortensen LH, Rehnberg J, Dahl E, et al. . Shape of the association between income and mortality: a cohort study of Denmark, Finland, Norway and Sweden in 1995 and 2003. BMJ Open. 2016;6(12):e010974. doi:10.1136/bmjopen-2015-010974 - DOI - PMC - PubMed
    1. Östergren O, Martikainen P, Tarkiainen L, Elstad JI, Brønnum-Hansen H. Contribution of smoking and alcohol consumption to income differences in life expectancy: evidence using Danish, Finnish, Norwegian and Swedish register data. J Epidemiol Community Health. 2019:73(4):334-339. doi:10.1136/jech-2018-211640 - DOI - PMC - PubMed

Publication types