. 2019 May 13;35(5):767-781.e6.
doi: 10.1016/j.ccell.2019.04.003.

Targeting TMEM176B Enhances Antitumor Immunity and Augments the Efficacy of Immune Checkpoint Blockers by Unleashing Inflammasome Activation

Affiliations

Targeting TMEM176B Enhances Antitumor Immunity and Augments the Efficacy of Immune Checkpoint Blockers by Unleashing Inflammasome Activation

Mercedes Segovia et al. Cancer Cell. .

Abstract

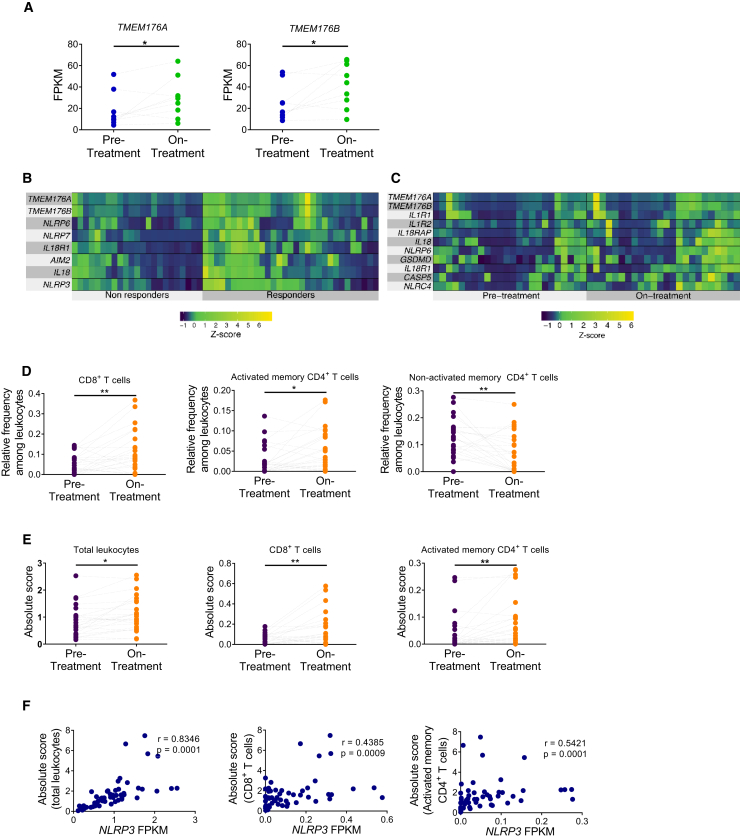
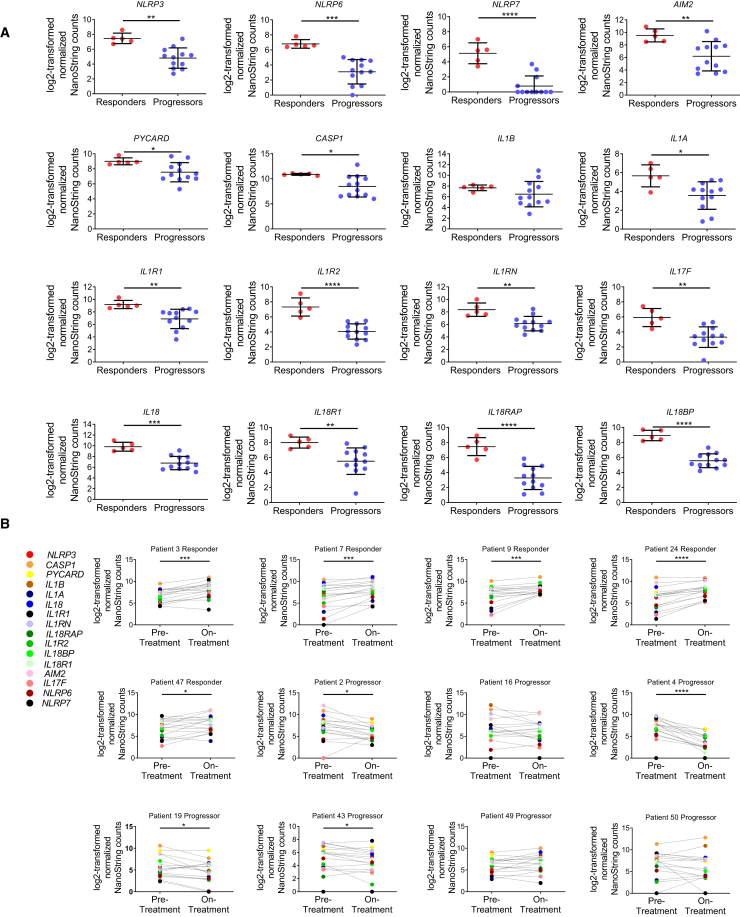
Although immune checkpoint blockers have yielded significant clinical benefits in patients with different malignancies, the efficacy of these therapies is still limited. Here, we show that disruption of transmembrane protein 176B (TMEM176B) contributes to CD8+ T cell-mediated tumor growth inhibition by unleashing inflammasome activation. Lack of Tmem176b enhances the antitumor activity of anti-CTLA-4 antibodies through mechanisms involving caspase-1/IL-1β activation. Accordingly, patients responding to checkpoint blockade therapies display an activated inflammasome signature. Finally, we identify BayK8644 as a potent TMEM176B inhibitor that promotes CD8+ T cell-mediated tumor control and reinforces the antitumor activity of both anti-CTLA-4 and anti-PD-1 antibodies. Thus, pharmacologic de-repression of the inflammasome by targeting TMEM176B may enhance the therapeutic efficacy of immune checkpoint blockers.

Keywords: TMEM176B; cancer; dendritic cells; immune checkpoint blockers; inflammasome; ion channel.


Figures

Figure 1
Figure 1
The Ionic Channel TMEM176B Inhibits the NLRP3 Inflammasome (A) Representative dot plots and absolute number of neutrophils (CD11b+ Ly6Cint Ly6G+) in peritoneal lavage 4 h after intraperitoneal (i.p.) injection with vehicle control (PBS) or 20 mg/kg ATP. In the plots, CD11b+ cells were analyzed for Ly6C and Ly6G expression. At least six animals were studied in each group in two independent experiments. ns, not significant; p < 0.05; one-way ANOVA test. (B and C) Dose-response (B) and time-response (C) analysis of WT and Tmem176b−/− bone marrow-derived DCs (BMDCs) treated with LPS (0.25 μg/mL) for 4 h, washed and treated with ATP (left) or nigericine (Nig) (right). IL-1β in culture supernatants was determined by ELISA. One experiment representative of five is shown. p < 0.05, ∗∗p < 0.01; two-way ANOVA test. (D) Western blot analysis of pro-IL-1β and pro-caspase-1 (lysates) or IL-1β and caspase-1 (supernatants) in WT and Tmem176b−/− BMDCs stimulated with LPS as in (B and C) and then treated for 90 min with 2.5 μM Nig or 0.5 mM ATP. One experiment representative of three is shown. (E) Caspase-1 activation in WT and Tmem176b−/− BMDCs treated with LPS and then exposed to 0.5 mM ATP or 2.5 μM Nig for 45 min. Cells were harvested and stained with FLICA1 reagent. One experiment representative of three is shown. p < 0.05; two-way ANOVA test. (F) IL-1β secretion by WT and Tmem176b−/− BMDCs treated as in (E) compared with those treated with 10 μM Z-WEHD-FMK 15 min before ATP. One experiment representative of three is shown. ∗∗p < 0.01, ∗∗∗∗p < 0.0001; two-way ANOVA test. (G and H) Determination of IL-1β (G) and IL-18 (H) by ELISA in culture supernatants from WT, Tmem176b−/−, and Tmem176b−/−Casp1−/− BMDCs treated as in (E). One experiment representative of two is shown. p < 0.05, ∗∗p < 0.01, ∗∗∗∗p < 0.0001; two-way ANOVA test. (I) Determination of IL-1β in culture supernatants of THP-1-differentiated macrophages expressing GFP or GFP-TMEM176B untreated or treated for 3 h with 0.25 μg/mL LPS and then for 2 h with 2.5 μM Nig. One experiment representative of four is shown. ∗∗p < 0.01, ∗∗∗p < 0.001; two-way ANOVA test. (J) Calcium determination in WT and Tmem176b−/− BMDCs treated for 3 h with 0.25 μg/mL LPS and 0.5 mM ATP. Cells were loaded with Ca2+-sensitive probe Fura-2. Emission at 340/380 nm was recorded in time-lapse experiments; 0.5 mM ATP was added when indicated by the arrow. Scale bars, 10 μm. (K) Determination of IL-1β in BMDCs exposed to the NLRP3 inflammasome activator ATP as described in (E) in the presence or absence of the intracellular Ca2+ chelator BAPTA (100 μM) or DMSO vehicle control. One experiment representative of three is shown. p < 0.05; two-way ANOVA test. (L) Determination of IL-1β in BMDCs following inflammasome activation in the presence of control buffer (5 mM) or high K+ buffer (120 mM). One experiment representative of three is shown. p < 0.05; two-way ANOVA test. (M and N) Determination of IL-1β in BMDCs following inflammasome activation in the presence or absence of the Ca2+-activated K+ channels blockers iberiotoxin (IbTx) in (M) or hydroxychloroquine (HCQ) in (N). One experiment representative of three is shown in each case. p < 0.05, ∗∗p < 0.01; two-way ANOVA test. In ELISA experiments, ND stands for not detected. Mean ± SD are shown. See also Figure S1.
Figure 2
Figure 2
Mice Lacking Tmem176b Control Tumor Growth through an IL-1β- and caspase-1-Dependent Manner (A) Survival of WT and Tmem176b−/− mice injected subcutaneously with MC38 colon cancer cells (1 × 106; left graph), LL2 lung cancer cells (1 × 105; central graph), or EG7 thymic lymphoma cells (1 × 106; right graph). Mice survival was monitored every 3 days. The ratio shows the number of surviving animals/total injected mice from three experiments. p < 0.05, ∗∗p < 0.01; log rank (Mantel-Cox) test. (B and C) Western blot analysis (B) and semiquantification (C) of pro-caspase-1 and caspase-1 expression in tumor-draining lymph nodes (TDLN) from WT and Tmem176b−/− mice. At least four animals/group are shown. p < 0.05; Student's t test. (D and E) Confocal microscopy (D) and semiquantification (E) of activated caspase-1 expression using the FLICA1 fluorescent probe in TDLN. Scale bars, 10 μm. n = 3 each group. p < 0.05, ∗∗∗p < 0.001; one-way ANOVA test. (F) Flow cytometry analysis of FLICA1+ cells within TDLN. SSC, Side scatter. One experiment representative of two is shown. (G) Evaluation of FLICA1+ CD11b+ and CD11b classical DCs (cDCs) in TDLN is shown. ns, not significant; ∗∗∗p < 0.001; Student's t test. (H) Survival of Tmem176b−/− EG7 tumor-bearing mice treated with anti-IL-1β or control immunoglobulin G (IgG) antibodies. The ratio shows the number of surviving animals/total injected mice from one experiment. p < 0.05; log rank (Mantel-Cox) test. (I) Survival of untreated Tmem176b−/− and Tmem176b−/−Casp1−/− EG7 tumor-bearing mice. The ratio shows the number of surviving animals/total injected mice pooled from three independent experiments. p < 0.05; log rank (Mantel-Cox) test. (J) In vivo cytotoxicity against OVA-expressing cells in WT and Tmem176b−/− EG7 tumor-bearing mice. Data from four different animals and one experiment in each group are shown. ∗∗p < 0.01; Student's t test. (K) In vivo cytotoxicity against OVA-expressing cells in EG7 tumor-bearing Tmem176b−/− mice treated with anti-IL-1β neutralizing or control IgG antibodies. p < 0.05; Student's t test. (L) In vivo cytotoxicity against OVA-expressing cells in tumor-bearing Tmem176b−/− versus Tmem176b−/−Casp1−/− mice. Data from two experiments are shown. p < 0.05; Student's t test. (M) Survival of tumor-bearing WT and Tmem176b−/− mice left untreated or treated with anti-CD8 depleting antibodies. The ratio depicts the number of surviving animals/total injected mice. Data from one experiment are shown. p < 0.05; log rank (Mantel-Cox) test. The genetic background of the animals used was C57BL/6. Mean ± SD are shown. See also Figures S2–S5.
Figure 3
Figure 3
Inflammasome Activation Reinforces Immune Checkpoint Blockade (A) Survival of WT, Tmem176b−/−, and Tmem176b−/−Casp1−/− mice inoculated with EG7 tumor cells and receiving anti-CTLA-4 or control IgG antibodies. p < 0.05; log rank (Mantel-Cox) test. (B and C) Survival of WT and Casp1/11−/− (B) or Nlrp3−/− (C) mice inoculated with EG7 tumor cells and injected with control IgG, anti-CTLA-4, or anti-PD-1 antibodies. ns, not significant; p < 0.05; log rank (Mantel-Cox) test. Data from three (A and B) or two (C) experiments are shown. The ratio depicts the number of surviving animals/total injected mice.
Figure 4
Figure 4
Analysis of the Inflammasome Signature in Tumor Biopsies from Melanoma Patients Treated with Immune Checkpoint Blockers (A) Paired analysis comparing pre-treatment versus on-treatment melanoma biopsies of patients who did not respond to anti-PD-1 therapy and were not treated previously with anti-CTLA-4 antibody (IPI-naive). p < 0.05; paired Student's t test. (B) Heatmaps of transcriptome analysis from tumor biopsies of melanoma patients responding (responders) or not (non-responders) to anti-PD-1 therapy. p < 0.05; unpaired Student's t test. (C) Paired analysis comparing pre-treatment versus on-treatment melanoma biopsies of patients responding to anti-PD-1 therapy. The indicated inflammasome-related genes were significantly upregulated during therapy. p < 0.05; paired Student's t test. (D and E) Paired study of the relative frequency (D) and absolute number (E) of the indicated cell populations between pre-treatment versus on-treatment tumor biopsies from total patients responding to anti-PD-1 therapy analyzed by the CIBERSORT method. p < 0.05, ∗∗p < 0.01; paired Student's t test. (F) Association of NLRP3 expression with the frequency of total leukocytes, CD8+ T cells and activated memory CD4+ T cells in patients responding to anti-PD-1 therapy. Results show transcriptomics data obtained from tumor biopsies at the on-treatment stage. See also Tables S1–S6.
Figure 5
Figure 5
Analysis of the Inflammasome Signature in Tumor Biopsies from Melanoma Patients Treated with Immune Checkpoint Blockers (A) Log2-transformed normalized NanoString counts for the indicated inflammasome-related genes in melanoma tumor biopsies from patients being treated with anti-PD-1 mAb. The results for responding and non-responding patients as defined by Chen et al. (2016). Mean ± SD are shown. p < 0.05, ∗∗p < 0.01, ∗∗∗p < 0.001, ∗∗∗∗p < 0.0001; unpaired Student's t test. (B) Paired analysis of the 16 inflammasome-related genes studied in (A) comparing pre-treatment and on-treatment tumor biopsies from melanoma patients responding (n = 5) or not responding (n = 7) to anti-PD-1 therapy. p < 0.05, ∗∗∗p < 0.001, ∗∗∗∗p < 0.0001; paired Student's t test. See also Figures S6 and S7.
Figure 6
Figure 6
Targeting TMEM176B with BayK8644 Triggers Inflammasome-Dependent Antitumor Immunity (A) TMEM176B activity in CHO-7 cells treated or not with BayK8644. Representative flow cytometry histograms displaying ANG-2 fluorescence at the indicated conditions (left) and quantification of ANG-2 mean fluorescence intensity (MFI) (right). One experiment representative of five is shown. ∗∗p < 0.01, ∗∗∗p < 0.001; two-way ANOVA test. (B) TMEM176B-dependent conductance assessed in Xenopus oocytes following addition of 10 μM (+) BayK8644 to extracellular buffer during phorbol myristate acetate (PMA) stimulation. Representative currents (left) and determination of TMEM176B current at 800 s post-extracellular acidification (right) are shown. ∗∗∗p < 0.001; one-way ANOVA test. (C) Determination of IL-1β in culture supernatants from WT and Tmem176b−/− BMDCs primed for 3 h with LPS and then treated or not with 2.5 μM BayK8644. One experiment representative of three is shown. p < 0.05; two-way ANOVA test. (D) Determination of IL-1β in culture supernatants from WT BMDCs primed with LPS and then treated with 10 μM BayK8644 alone or in combination with tetraethylammonium (TEA) (2 mM) or HCQ (10 μM). One experiment representative of three is shown. p < 0.05, ∗∗p < 0.01; one-way ANOVA test. (E) Determination of IL-1β in culture supernatants from THP-1-differentiated macrophages transfected with GFP or TMEM176B/GFP-coding plasmids and then treated or not with LPS plus nigericine (LPS/Nig) in the presence of ethanol (vehicle) or 5 μM BayK8644. To calculate the extent of TMEM176B-dependent inhibition, IL-1β levels (pg/mL) were incorporated to the formula: [GFP/LPS/Nig – GFP untreated] – TMEM176B/LPS/Nig × 100. One experiment representative of three is shown. p < 0.05; Student's t test. (F and G) Survival of WT (F and G) and Tmem176b−/− (F) or Casp1/11−/− (G) mice inoculated with EG7 tumor cells and treated with 1 mg/kg BayK8644 i.p. on days 2–15 after tumor cell injection. p < 0.05, ∗∗p < 0.01; log rank (Mantel-Cox) test. (H) Caspase-1 activation in TDLN from WT mice inoculated with EG7 tumor cells and then treated or not with 1 mg/kg BayK8644 on days 2–13. TDLN were resected 14 days after tumor injection and caspase-1 activation was studied by flow cytometry using the FLICA1 reagent. p < 0.05; Student's t test. (I) In vivo cytotoxicity against OVA-expressing cells in WT mice inoculated with EG7 tumor cells treated or not with BayK8644 as in (F). At day 15, in vivo cytotoxicity was determined. p < 0.05; Student's t test. (J) Survival of tumor (EG7)-bearing WT mice treated with BayK8644 or vehicle control, receiving or not anti-CD8 depleting antibody. ns, not significant. WT + Vehicle versus WT + BayK8644: p < 0.05; WT + BayK8644 versus WT + BayK8644 + anti-CD8: p < 0.05; WT + Vehicle versus WT + BayK8644 + anti-CD8: ns; log rank (Mantel-Cox) test. (K) Survival of tumor (EG7)-bearing WT mice treated or not with BayK8644, anti-CTLA-4 mAb, or BayK8644 plus anti-CTLA-4 mAb. ns, not significant. Untreated versus BayK8644 + anti-CTLA-4: ∗∗p < 0.01; BayK8644 versus BayK8644 + anti-CTLA-4: ns; anti-CTLA-4 versus BayK8644 + anti-CTLA-4: ns; untreated versus anti-CTLA-4: ns; untreated versus BayK8644: ns; log rank (Mantel-Cox) test. (L) Survival of tumor (EG7)-bearing WT mice treated or not with 250 μg anti-PD-1 mAb at days 6, 9, and 12 after tumor inoculation. BayK8644 was injected every day since day 9 (when all mice had established tumors) until day 21. p < 0.05; log rank (Mantel-Cox) test. (M) Frequency of OVA-specific CD8+ T cells as determined by flow cytometry using fluorescent MHC pentamers in EG7 tumor suspensions from WT mice treated with anti-PD-1 alone or anti-PD-1 + BayK8644 in a therapeutic protocol as in (L). p < 0.05; unpaired Student's t test. (N) Survival of tumor (EG7)-bearing WT mice treated or not with BayK8644 plus anti-PD-1 mAb in the absence or presence of anti-CD8 depleting mAb. p < 0.05; log rank (Mantel-Cox) test. (O) Survival of WT mice inoculated with 5,555 melanoma cells and left untreated or treated either with anti-PD-1 mAb (days 6, 9, and 12), BayK8644 (days 9–21), or both. All animals had established tumors when BayK8644 treatment was started. ns, not significant. Untreated versus BayK8644 + anti-PD-1: p < 0.05; BayK8644 versus BayK8644 + anti-PD-1: ns; anti-PD-1 versus BayK8644 + anti-PD-1: ns; untreated versus anti-PD-1: ns; untreated versus BayK8644: ns; log rank (Mantel-Cox) test. In (F), (G), and (J–O) the ratio represents the number of surviving mice/total injected mice. For these experiments we used C57BL/6 mice. Mean ± SD are shown. See also Figure S8.

References

    1. Binnewies M., Roberts E.W., Kersten K., Chan V., Fearon D.F., Merad M., Coussens L.M., Gabrilovich D.I., Ostrand-Rosenberg S., Hedrick C.C. Understanding the tumor immune microenvironment (TIME) for effective therapy. Nat. Med. 2018;24:541–550. - PMC - PubMed
    1. Broz P., von Moltke J., Jones J.W., Vance R.E., Monack D.M. Differential requirement for caspase-1 autoproteolysis in pathogen-induced cell death and cytokine processing. Cell Host Microbe. 2010;8:471–483. - PMC - PubMed
    1. Chen P.-L., Roh W., Reuben A., Cooper Z.A., Spencer C.N., Prieto P.A., Miller J.P., Bassett R.L., Gopalakrishnan V., Wani K. Analysis of immune signatures in longitudinal tumor samples yields insight into biomarkers of response and mechanisms of resistance to immune checkpoint blockade. Cancer Discov. 2016;6:827–837. - PMC - PubMed
    1. Condamine T., Le Texier L., Howie D., Lavault A., Hill M., Halary F., Cobbold S., Waldmann H., Cuturi M.-C., Chiffoleau E. Tmem176B and Tmem176A are associated with the immature state of dendritic cells. J. Leukoc. Biol. 2010;88:507–515. - PubMed
    1. Crozat K., Tamoutounour S., Vu Manh T.-P., Fossum E., Luche H., Ardouin L., Guilliams M., Azukizawa H., Bogen B., Malissen B. Cutting edge: expression of XCR1 defines mouse lymphoid-tissue resident and migratory dendritic cells of the CD8+ type. J. Immunol. 2011;187:4411–4415. - PubMed

Publication types

MeSH terms

Substances