. 2019 May 28;116(22):10927-10936.
doi: 10.1073/pnas.1821301116. Epub 2019 May 13.

CHD4 is essential for transcriptional repression and lineage progression in B lymphopoiesis

Affiliations

CHD4 is essential for transcriptional repression and lineage progression in B lymphopoiesis

Tessa Arends et al. Proc Natl Acad Sci U S A. .

Abstract

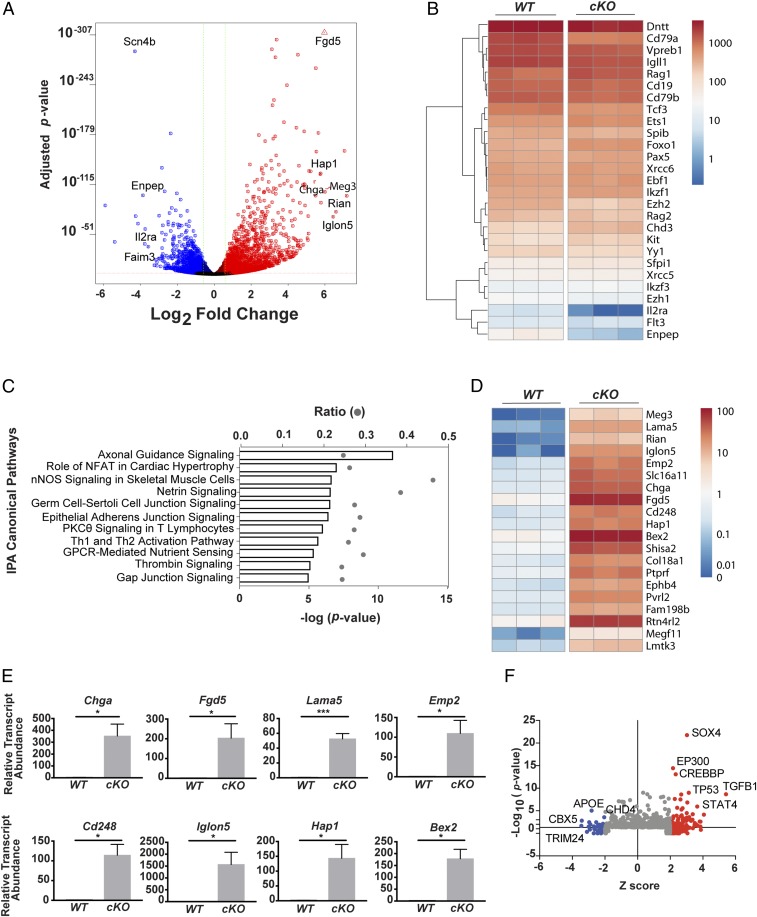
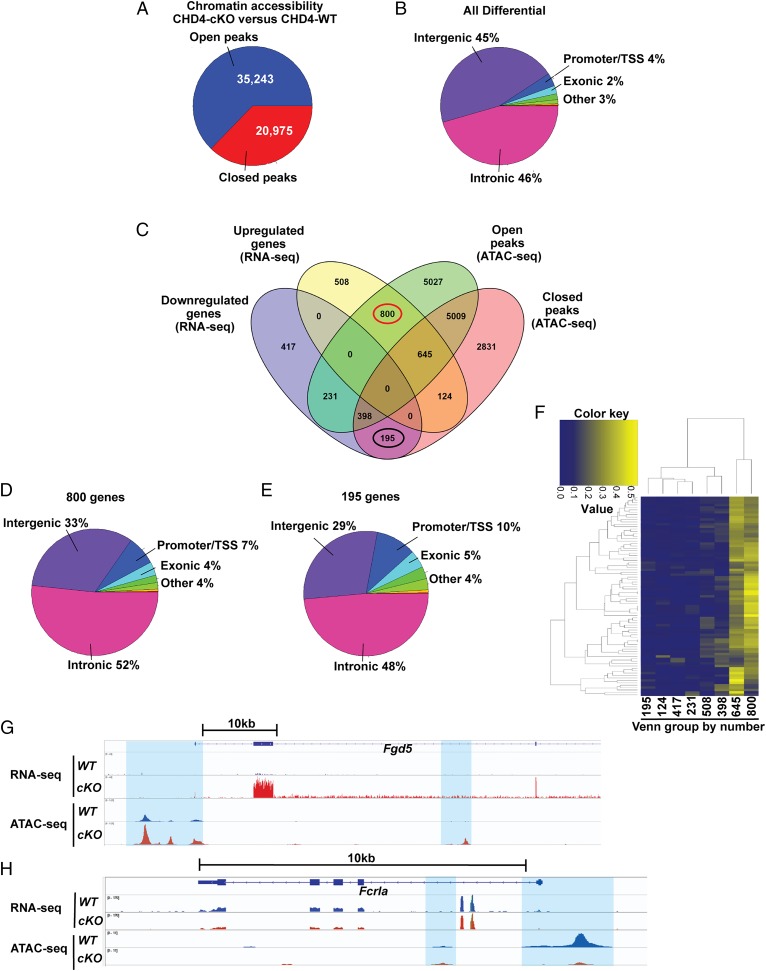
Cell lineage specification is a tightly regulated process that is dependent on appropriate expression of lineage and developmental stage-specific transcriptional programs. Here, we show that Chromodomain Helicase DNA-binding protein 4 (CHD4), a major ATPase/helicase subunit of Nucleosome Remodeling and Deacetylase Complexes (NuRD) in lymphocytes, is essential for specification of the early B cell lineage transcriptional program. In the absence of CHD4 in B cell progenitors in vivo, development of these cells is arrested at an early pro-B-like stage that is unresponsive to IL-7 receptor signaling and unable to efficiently complete V(D)J rearrangements at Igh loci. Our studies confirm that chromatin accessibility and transcription of thousands of gene loci are controlled dynamically by CHD4 during early B cell development. Strikingly, CHD4-deficient pro-B cells express transcripts of many non-B cell lineage genes, including genes that are characteristic of other hematopoietic lineages, neuronal cells, and the CNS, lung, pancreas, and other cell types. We conclude that CHD4 inhibits inappropriate transcription in pro-B cells. Together, our data demonstrate the importance of CHD4 in establishing and maintaining an appropriate transcriptome in early B lymphopoiesis via chromatin accessibility.

Keywords: B lymphocyte development; B lymphopoiesis; chromatin remodeling complexes; transcriptional programming; transcriptional repression.


Conflict of interest statement

The authors declare no conflict of interest.

Figures

Fig. 1.
Fig. 1.
CHD4 depletion results in a total decrease of bone marrow and spleen cellularity. (A) Total cell counts of bone marrow cells harvested from 4- to 6-wk-old Cd79afl/flCd79a-CreTg/+ (cKO; n = 21) mice and WT (n = 14) mice. Each dot represents an individual mouse. (B) Total cell counts of splenocytes harvested from 4- to 6-wk-old Chd4fl/flCd79a-CreTg/+ (n = 47) and WT (n = 61) mice. Each dot represents an individual mouse. (C) Flow cytometry and (D) total numbers of B220+CD19+ cells isolated from bone marrow of Chd4fl/flCd79a-CreTg/+ (n = 13) and WT (n = 10) mice. Each dot represents an individual mouse. Asterisks indicate statistical significance compared with WT littermate controls as unpaired, two-tailed Student’s t test without Welch’s correction. *P < 0.05, ****P < 0.0001. Graphs represent arithmetic mean with ±SEM. All data are representative of at least three independent experiments.
Fig. 2.
Fig. 2.
B cell development is arrested at an early pro–B-like stage of development in the absence of CHD4. Quantitation of B cell subsets in bone marrow. (A) Flow cytometry and (B) frequencies and numbers of various B cell populations (Hardy fractions) from bone marrow of 4- to 6-wk-old Chd4fl/flCd79a-CreTg/+ (cKO; n = 29) and WT (n = 24). (C) Flow cytometry and (D) frequencies (cKO, n = 9; WT, n = 10) and numbers (cKO, n = 4; WT, n = 4) of CD19+ and CD19+ c-Kit+ cells from bone marrow of 4- to 6-wk-old Chd4fl/flCd79a-CreTg/+ and WT mice. Asterisks indicate statistical significance compared with WT littermate controls using two-way ANOVA with Sidak’s multiple comparisons test. *P < 0.05, **P < 0.005, ***P < 0.0005, ****P < 0.0001. Graphs represent arithmetic mean with ±SEM. All data are representative of at least three independent experiments.
Fig. 3.
Fig. 3.
CHD4 is required for proliferation of pro-B cells downstream of IL-7R signaling. (A) Pro-B cells (B220+CD43+CD24+BP1+IgM) were sorted from Chd4fl/flCd79a-CreTg/+ mice (cKO; n = 3) and WT littermate controls (n = 3) for culture in IL-7 (10 ng/mL). Cell counts were taken daily for 7 d, represented as the number of cells over the initial cell count. Asterisks indicate statistical significance compared with WT littermate controls using two-way ANOVA with Sidak’s multiple comparisons test. **P < 0.005, ****P < 0.0001. Graphs represent arithmetic mean with ±SEM. All data are representative of at least three independent experiments. (B) Representative flow cytometry of CD127 (IL-7Rα) expression on B220+CD43+ cells isolated from Chd4fl/flCd79a-CreTg/+ and WT littermate controls. (C) Total numbers of B220+CD43+CD127+ cells from the bone marrow of Chd4fl/flCd79a-CreTg/+ (n = 5) and WT (n = 10) mice. Each dot represents an individual mouse. (D) Representative flow cytometry of intracellular phosphor-STAT5a in c-Kit+ pro-B cells (LinCD19+c-Kit+CD25IgMIgD) isolated from Chd4fl/flCd79a-CreTg/+ and WT littermate controls. (E) Detection of pSTAT5A in CD19+ c-Kit+ pro-B cells isolated from Chd4fl/flCd79a-CreTg/+ (n = 3) and WT (n = 3) mice. The lineage (Lin) stain included: CD3ε, CD11b, CD11c, Gr-1, NK1.1, Ly6C, CD317, and Ter119. Asterisks indicate statistical significance compared with WT littermate controls as unpaired, two-tailed Student’s t test without Welch’s correction. *P < 0.05, **P < 0.005, ****P < 0.0001, NS, not significant. Graphs represent arithmetic mean ± SD. All data are representative of at least three independent experiments.
Fig. 4.
Fig. 4.
Loss of CHD4 results in reduced VH to DJH rearrangements and increased DNA damage in pro-B cells. (A) qPCR analysis of rearranged proximal (VH7183) and distal (VHJ558) gene segments from genomic DNA isolated from sorted c-Kit+ pro-B cells (LinCD19+c-Kit+CD25IgMIgD) and c-Kitlow pro-B cells (LinCD19+c-KitlowCD25IgMIgD) from bone marrow of 4- to 6-wk-old Chd4fl/flCd79a-CreTg/+ mice (n = 3) and WT littermate controls (n = 3). (B) Flow cytometry of cytoplasmic Ig µ-expression in sorted B220+CD43+sIgM B cells isolated from bone marrow from 4- to 6-wk-old Chd4fl/flCd79a-CreTg/+ (n = 2) and WT (n = 2) mice. (C) Flow cytometry of cytoplasmic Ig µ-expression in sorted B220+CD43+sIgM B cells isolated from bone marrow from 4- to 6-wk-old Chd4fl/flCd79a-CreTg/+ (n = 2) and a Rag1 knockout mouse (n = 1). Data are derived from one experiment. (D) The 3D-FISH confocal images of hybridized probes in CD19+c-Kit+ pro-B cell (as described above) nuclei isolated from bone marrow of Chd4fl/flCd79a-CreTg/+ and WT mice. The IgH404 proximal probe (RP23-404D8) was labeled with Alexa Fluor 488 (AF488); the IgH189 distal probe (RP23-189H12) was labeled with AF568; major satellite repeats (γ-sat) were conjugated to AF647; and nuclei were counterstained with DAPI. (E) Distributions of spatial distances (in micrometers) separating BAC probes, located at each end of the Igh locus (IgH404 vs. IgH189) in pro-B cells isolated from bone marrow of Chd4fl/flCd79a-CreTg/+ (n = 92 cells) and WT (n = 69 cells). Each dot represents an individual allele. (F) Representative flow cytometry and (G) MFI of c-Kit+ pro-B cells stained for intracellular γ-H2AX from bone marrow of Chd4fl/flCd79a-CreTg/+ (n = 4) and WT (n = 3) mice. The asterisks indicate statistical significance compared with the WT littermate controls as unpaired, two-tailed Student’s t test with equal SD, Mann–Whitney rank test or two-way ANOVA with Sidak’s multiple comparisons test. **P < 0.0005, ****P < 0.0001. All data are representative of at least three independent experiments.
Fig. 5.
Fig. 5.
CHD4 is required for transcriptional repression of non-B lineage genes. (A) Volcano plot of expression in transcripts per million (TPM) of genes in Chd4fl/flCd79a-CreTg/+ c-Kit+ pro-B cells. Genes significantly increased (red) and decreased (blue) greater than 1.5-fold (Padj ≤ 0.05) are highlighted. (B) Heatmap depicting TPM of select B-lineage genes. (C) IPA enrichment for the top 10 most significantly enriched canonical pathways. (D) Heatmap of TPM values for non-B lineage genes. (E) Validation (qRT-PCR) of select up-regulated non-B lineage genes in CHD4-deficient and WT pro-B cells. Statistical significance of RT-PCR data was validated using the Mann–Whitney rank test: *P < 0.05, ***P < 0.0005. (F) IPA upstream regulators predicted as activated (red) and inhibited (blue).
Fig. 6.
Fig. 6.
CHD4 modulates chromatin accessibility in early pro-B cells. (A) Comparison of filtered, statistically called ATAC-seq peaks between CHD4-deficient and WT pro-B cells. (B) Analysis of HOMER annotated regions within differential peaks called between CHD4-deficient and WT pro-B cells. (C) Integration and comparison of differential RNA-seq and ATAC-seq datasets between CHD4-deficient and WT pro-B cells. The 800 gene set (up-regulated with only open peaks) and 195 gene set (down-regulated with only closed peaks) are circled red and black, respectively. (D) Assessment of chromatin distribution within 800 gene set (RNA-seq/ATAC-seq integration) between CHD4-deficient and WT pro-B cells. (E) Assessment of chromatin distribution within 195 gene set (RNA-seq/ATAC-seq integration) between CHD4-deficient and WT pro-B cells. (F) Heatmap of GO pathway analysis for the total set of RNA-seq differentially expressed genes compared with the number of shared genes between each Venn subgroup and the total genes within each GO pathway. (G) Visualization of Fgd5 gene landscape (integration of RNA-seq and ATAC-seq datasets) between CHD4-deficient and WT pro-B cells. (H) Visualization of Fcrla gene landscape (integration of RNA-seq and ATAC-seq datasets) between CHD4-deficient and WT pro-B cells.

Similar articles

Cited by

References

    1. Abdelrasoul H, Werner M, Setz CS, Okkenhaug K, Jumaa H (2018) PI3K induces B-cell development and regulates B cell identity. Sci Rep 8:1327. - PMC - PubMed
    1. Miyai T, et al. (2018) Three-step transcriptional priming that drives the commitment of multipotent progenitors toward B cells. Genes Dev 32:112–126. - PMC - PubMed
    1. Revilla-I-Domingo R, et al. (2012) The B-cell identity factor Pax5 regulates distinct transcriptional programmes in early and late B lymphopoiesis. EMBO J 31:3130–3146. - PMC - PubMed
    1. Li R, et al. (2018) Dynamic EBF1 occupancy directs sequential epigenetic and transcriptional events in B-cell programming. Genes Dev 32:96–111. - PMC - PubMed
    1. Maier H, et al. (2004) Early B cell factor cooperates with Runx1 and mediates epigenetic changes associated with mb-1 transcription. Nat Immunol 5:1069–1077. - PubMed

Publication types