. 2019 Aug 22;201(18):e00110-19.
doi: 10.1128/JB.00110-19. Print 2019 Sep 15.

Causes and Biophysical Consequences of Cellulose Production by Pseudomonas fluorescens SBW25 at the Air-Liquid Interface

Affiliations

Causes and Biophysical Consequences of Cellulose Production by Pseudomonas fluorescens SBW25 at the Air-Liquid Interface

Maxime Ardré et al. J Bacteriol. .

Abstract

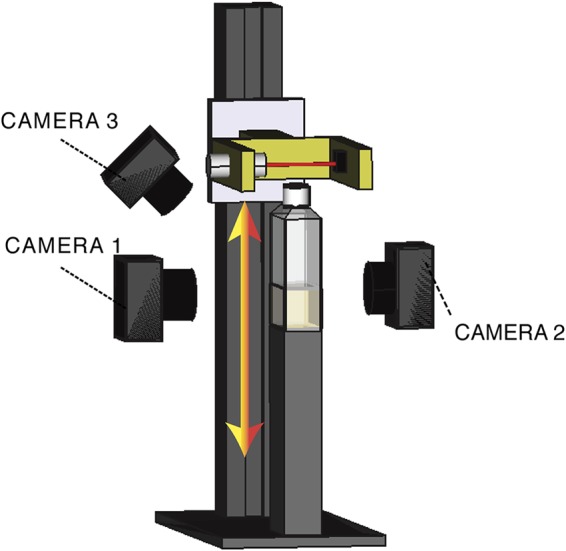
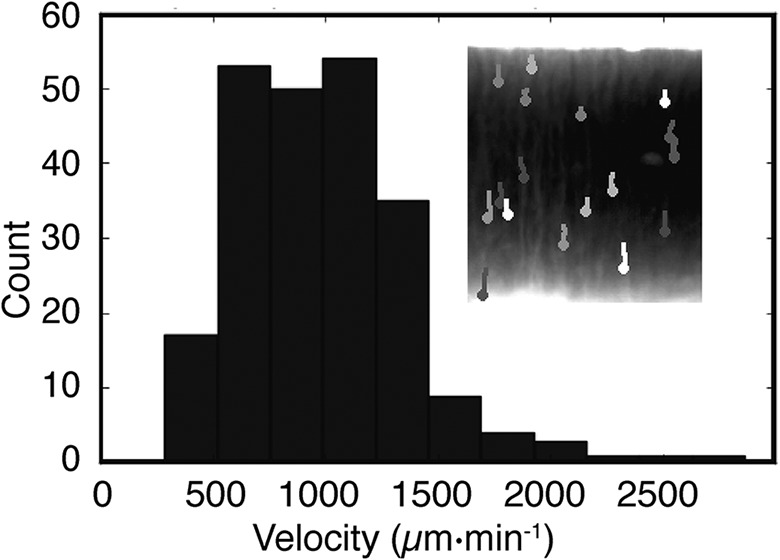
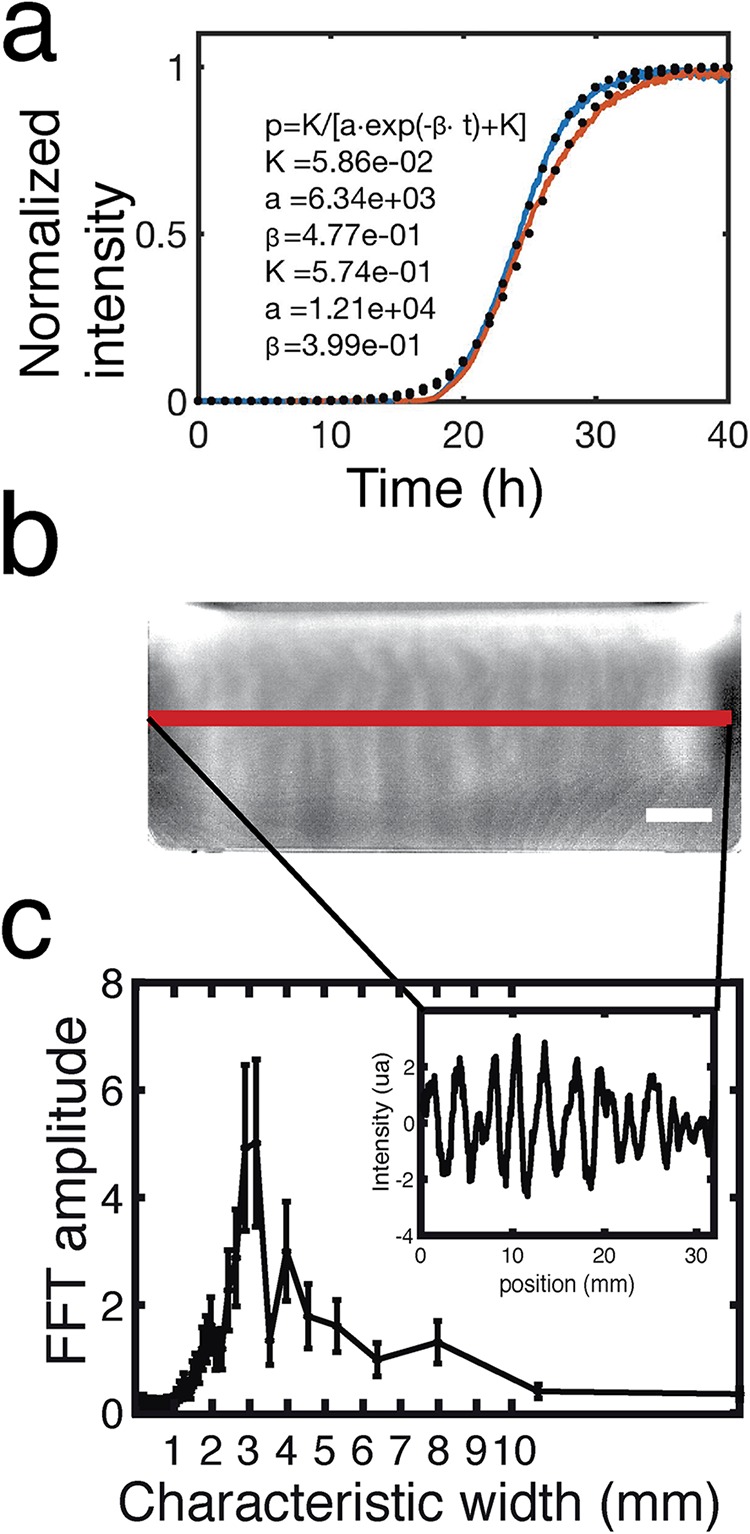
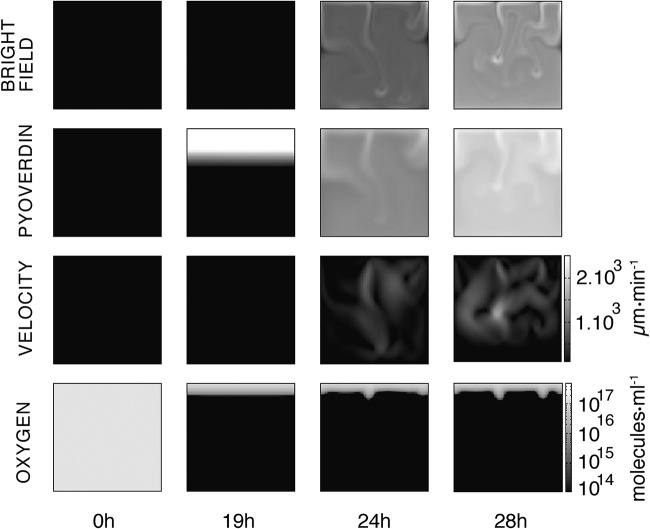
Cellulose-overproducing wrinkly spreader mutants of Pseudomonas fluorescens SBW25 have been the focus of much investigation, but conditions promoting the production of cellulose in ancestral strain SBW25 and its effects and consequences have escaped in-depth investigation through lack of an in vitro phenotype. Here, using a custom-built device, we reveal that in static broth microcosms, ancestral SBW25 encounters environmental signals at the air-liquid interface that activate, via three diguanylate cyclase-encoding pathways (Wsp, Aws, and Mws), production of cellulose. Secretion of the polymer at the meniscus leads to modification of the environment and growth of numerous microcolonies that extend from the surface. Accumulation of cellulose and associated microbial growth leads to Rayleigh-Taylor instability resulting in bioconvection and rapid transport of water-soluble products over tens of millimeters. Drawing upon data, we built a mathematical model that recapitulates experimental results and captures the interactions between biological, chemical and physical processes.IMPORTANCE This work reveals a hitherto unrecognized behavior that manifests at the air-liquid interface that depends on production of cellulose and hints at undiscovered dimensions to bacterial life at surfaces. Additionally, the study links activation of known diguanylate cyclase-encoding pathways to cellulose expression and to signals encountered at the meniscus. Further significance stems from recognition of the consequences of fluid instabilities arising from surface production of cellulose for transport of water-soluble products over large distances.

Keywords: continuum field models; microbial mats; pellicle; pyoverdin; spatial structure.


Figures

FIG 1
FIG 1
Experimental device. A polycarbonate cell culture bottle filled with 20 ml of KB and inoculated with bacteria is placed on a fixed vertical stand. The device and associated cameras are maintained within a 28°C incubator. The flask is scanned vertically every 5 min with a 600-nm laser beam with a 1-mm section. Light passing through the flask is collected by a photodiode. To obtain a measurement of the optical density in the flask along a vertical profile, the laser and linked photodiode are coupled to a motorized device that ensures smooth vertical translation. Three cameras are located around the flask. The first (camera 1) obtains a side-view image of the liquid phase of the medium using bright-field illumination. The second (camera 2), also fixed perpendicular to the flask, monitors fluorescence associated with pyoverdin (excitation of 405/emission of 450 nm). The third (camera 3) is oriented with a 45° angle and captures growth at the ALI using bright-field illumination.
FIG 2
FIG 2
Production of cellulose maximizes growth in static broth culture. Dynamics of growth of P. fluorescens SBW25 (black lines) and P. fluorescens SBW25 ΔwssA–J (cellulose-negative mutant) (gray lines) in unshaken KB as determined by the scanning laser device and associated photodiode depicted in Fig. 1. Every curve is an independent experiment made in a new flask. Data are the spatial average of the optical density at 600 nm (OD600) obtained from scanning the vertical section of a flask. OD600 measurements are calibrated using direct plate counts of CFU (equivalent CFU · ml−1). Measurements were taken every 5 min. The arrow denotes the onset of bioconvection caused by production of cellulose that marks a secondary increase in growth. This second growth phase is absent in the cellulose-negative mutant.
FIG 3
FIG 3
Cellulose is necessary for growth at the air-liquid interface (ALI) and results in bioconvection. Shown are bright-field images of ancestral P. fluorescens SBW25 (a) and SBW25 ΔwssA–J (cellulose-negative mutant) (b) taken at four time intervals. Complete movies are available as Movies S1, S2, S6, and S7 at figshare (https://figshare.com/projects/Causes_and_consequences_of_cellulose_production_by_Pseudomonas_fluorescens_SBW25_at_the_air-liquid_interface/59630). Images above the line show growth at the ALI captured using camera 3; images below the line are from camera 1 (Fig. 1). At 0 h, the medium is inoculated with ∼104 cells · ml−1. By 19 h, the ancestral cellulose-producing genotype has formed a thin white pellicle at the ALI (visible by both cameras 1 and 3). No pellicle formation is seen in the cellulose-negative mutant, but growth is evident in the broth phase. By 26 h, in cultures of the cellulose-producing ancestral type, plumes characteristic of bioconvection stream from the ALI (pointed at by the black arrow). No evidence of mat formation or streaming is seen in SBW25 ΔwssA–J. By 40 h, streaming has largely ceased in the ancestral type, although growth is still apparent at the ALI. Scale bars are 5 mm. Contrast has been adjusted to highlight salient features.
FIG 4
FIG 4
Multiple diguanylate cyclases are required for colonization of the ALI. Microcolony formation at the ALI for ancestral P. fluorescens SBW25 and a range of mutants was captured from a camera mounted directly above individual wells of a six-well tissue culture plate containing 5 ml KB. (a) The time course of microcolony formation for ancestral P. fluorescens SBW25. The complete movie S5 can be seen at figshare (https://figshare.com/projects/Causes_and_consequences_of_cellulose_production_by_Pseudomonas_fluorescens_SBW25_at_the_air-liquid_interface/59630). (b) Comparison with SBW25 ΔwssA–J (cellulose-negative mutant) at 19 h. (c) Patterns of microcolony formation at 19 h in mutants devoid of the Wsp (Δwsp), Aws (Δaws), and Mws (Δmws) diguanylate cyclase-encoding pathways and combinations thereof are shown. Scale bars are 1 mm, except in the entire well in panel a, in which the scale bar is 5 mm.
FIG 5
FIG 5
Bioconvection caused by cellulose. Time-lapse images via bright-field camera 1 (Fig. 1) capture biomass dynamics in the liquid medium. By 25 h, Rayleigh-Taylor instability generates plumes of biomass that fall from the ALI to the bottom of the flask (inset). The velocity of movement is obtained by tracking trajectories of the plumes. The frequency distribution of plume velocity reveals a mean speed ± standard deviation (SD) of 983 ± 373 μm · min−1.
FIG 6
FIG 6
Camera 2 (Fig. 1) monitors the pyoverdin concentration in the flask by measuring fluorescence. Pyoverdin is produced primarily at the ALI. (a) The average fluorescence along the ALI increases with time like a sigmoid curve. The ad hoc logistic function of the inset gives the normalized intensity (p) as a function of the time (t) and the parameters of the fit (K, a, and β). The fitted curves (dotted line) adjust the experimental curves (plain line) for the estimated values of the parameters given in the inset. (b) Plumes due to Rayleigh-Taylor instability transport pyoverdin from the ALI to the liquid phase. The pyoverdin concentration is transiently higher along vertical columns that correspond to the plumes flowing from the ALI. The scale bar is 5 mm. (c) The fluorescence intensity profile along the red line (b) shows that pyoverdin is distributed with a fluctuating spatial structure (inset). Fast Fourier transformation (FFT) of the intensity profile reveals these fluctuations to have a characteristic wavelength of 3 mm.
FIG 7
FIG 7
Numerical simulation of the mathematical model. Images display the dynamics of the simulated microcosm from inoculation at 0 h to 28 h. Time-resolved movies are available in Movies S8 to S11 at figshare (https://figshare.com/projects/Causes_and_consequences_of_cellulose_production_by_Pseudomonas_fluorescens_SBW25_at_the_air-liquid_interface/59630). The first row above shows the dynamics of the biomass in the bulk (bacteria and cellulose) as if observed with bright-field illumination 1 (Fig. 1). In the experiments, at 24 h plumes concentrated in biomass flow are evident in the liquid phase. The second row shows the concentration of pyoverdin in the liquid phase. The plumes transport pyoverdin into the bulk phase. The third row shows the dynamics of liquid velocity. When bioconvection is activated, fluid flow is of the order of 1,000 μm · min−1, which is consistent with the measurements shown (Fig. 5). The fourth row shows the dynamics of oxygen concentration. Soon after inoculation, oxygen in the bulk phase is eliminated due to metabolic (oxygen-consuming) activities of bacteria. The supply of oxygen at the ALI combined with growth of bacteria and production of cellulose means a gradient of oxygen 2 to 3mm into the liquid. Images at 24 and 28 h show oxygen transport from the ALI before consumption by bacteria in the liquid phase. The square images are 1 cm2, and contrast is identical across each row.

References

    1. Costerton JW, Stewart PS, Greenberg EP. 1999. Bacterial biofilms: a common cause of persistent infections. Science 284:1318–1322. doi: 10.1126/science.284.5418.1318. - DOI - PubMed
    1. Davey ME, O'Toole GA. 2000. Microbial biofilms: from ecology to molecular genetics. Microbiol Mol Biol Rev 64:847–867. doi: 10.1128/MMBR.64.4.847-867.2000. - DOI - PMC - PubMed
    1. Flemming HC, Wingender J, Szewzyk U, Steinberg P, Rice SA, Kjelleberg S. 2016. Biofilms: an emergent form of bacterial life. Nat Rev Microbiol 14:563–575. doi: 10.1038/nrmicro.2016.94. - DOI - PubMed
    1. Marshall KC. 1996. Adhesion as a strategy for access to nutrients, p 59–87. In Fletcher M. (ed), Bacterial adhesion: molecular and ecological diversity. Wiley-Liss, Inc, New York, NY.
    1. Watnick P, Kolter R. 2000. Biofilm, city of microbes. J Bacteriol 182:2675–2679. doi: 10.1128/JB.182.10.2675-2679.2000. - DOI - PMC - PubMed

Publication types

LinkOut - more resources