. 2019 Jul 23;87(8):e00175-19.
doi: 10.1128/IAI.00175-19. Print 2019 Aug.

Modeling Pneumonic Plague in Human Precision-Cut Lung Slices Highlights a Role for the Plasminogen Activator Protease in Facilitating Type 3 Secretion

Affiliations

Modeling Pneumonic Plague in Human Precision-Cut Lung Slices Highlights a Role for the Plasminogen Activator Protease in Facilitating Type 3 Secretion

Srijon K Banerjee et al. Infect Immun. .

Abstract

Pneumonic plague is the deadliest form of disease caused by Yersinia pestis Key to the progression of infection is the activity of the plasminogen activator protease Pla. Deletion of Pla results in a decreased Y. pestis bacterial burden in the lung and failure to progress into the lethal proinflammatory phase of disease. While a number of putative functions have been attributed to Pla, its precise role in the pathogenesis of pneumonic plague is yet to be defined. Here, we show that Pla facilitates type 3 secretion into primary alveolar macrophages but not into the commonly used THP-1 cell line. We also establish human precision-cut lung slices as a platform for modeling early host/pathogen interactions during pneumonic plague and solidify the role of Pla in promoting optimal type 3 secretion using primary human tissue with relevant host cell heterogeneity. These results position Pla as a key player in the early host/pathogen interactions that define pneumonic plague and showcase the utility of human precision-cut lung slices as a platform to evaluate pulmonary infection by bacterial pathogens.

Keywords: Pla; Yersinia; Yersinia pestis; hPCLS; human precision-cut lung slices; plague; plasminogen activator protease; pneumonic plague; pulmonary infection; type 3 secretion.


Figures

FIG 1
FIG 1
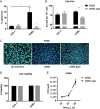
Adherence and T3S of Y. pestis wild-type and Δpla strains in vitro. (A) THP-1 cells differentiated with PMA and hAMs were seeded at 105/ml and infected with bacteria at an MOI of 20 for 1 h. Cells were washed and plated on BHI for CFU enumeration. Control wells were not washed, and the total bacteria in the well were plated. Plots represent the comparison between washed and control wells. (B) Yop translocation by CO92 and CO92 Δpla as measured by flow cytometry. THP-1 cells and hAMs were seeded at 5 × 105/ml and infected with the wild-type and Δpla strains harboring a YopE-Bla reporter protein at an MOI of 20 for 1 h. Cells were treated with CCF2-AM and processed for flow cytometry analysis. (C) Epifluorescence microscopy of hAMs to detect the difference in Yop translocation between the wild-type and Δpla strains of Y. pestis. hAMs were seeded at 5 × 105 cells/ml and infected with the wild-type and Δpla strains at an MOI of 20 for 1 h. Cells were treated with CCF2-AM and processed for microscopy. Blue cells are positive for Yop translocation. Bars, 50 μm. (D) The viability of cells from the experiment whose results are presented in panel C was measured as the percentage of cells that were CCF2-AM positive out of all cells analyzed. (E) Bacterial survival was measured by analysis of the number of CFU after infection of 105 cells/ml at an MOI of 10 for 1 h. For all experiments, n was equal to 3 technical replicates (wells). The plots are representative of those from 3 independent experiments. Error bars represent SD. p.i., postinfection. Significance was calculated with Welch’s t test; *, P < 0.05; **, P < 0.01.
FIG 2
FIG 2
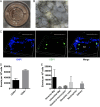
Establishing human precision-cut lung slices as a platform to evaluate Y. pestis Δpla. (A) A single human precision-cut lung slice (hPCLS) with culture medium in one well of a 48-well plate. (B) Bright-field image of hPCLS at ×200 magnification. AS, alveolar space; IS, interstitial space. (C) Immunostaining of lung slices. hPCLS were washed with PBS, fixed, and immunostained with anti-human CD71 conjugated to Alexa Fluor 488 to detect alveolar macrophages. DAPI (4′,6-diamidino-2-phenylindole) was used to stain all cells. Bar, 100 μm. (D, E) Analysis of the total cell types present in hPCLS. (D) hPCLS were digested with collagenase, incubated with fluorescently labeled antibodies to CD45, and analyzed by flow cytometry to determine the ratio of CD45+ lymphocyte/leukocyte populations to CD45 epithelial/endothelial populations. (E) CD45+ cell types present in hPCLS. The plot represents the population of cells in every 105 CD45+ cells that were alveolar macrophages (CD206+ CD71+), interstitial macrophages (CD206+ CD71), classical monocytes (CD206 CD71 CD14+), dendritic cells (CD206 CD14 CD11c+), neutrophils (CD206 CD24+ CD16+), or others (other CD45+ cells). For all experiments, n was equal to 3 technical replicates (wells). The plots are representative of those from 3 independent experiments.
FIG 3
FIG 3
Yop translocation in hPCLS. (A) Epifluorescence microscopy of hPCLS infected with pgm-negative CO92 containing the YopE-Bla reporter as a proof of concept. hPCLS was infected with 107 bacteria, washed, and treated with CCF2-AM for microscopy. The two images represent different magnifications: ×40 (left) and ×100 (right). White arrows indicate blue cells that have been targeted for Yop delivery. Bars, 250 μm (left) and 100 μm (right). (B) Time course analyses of Yop translocation in hPCLS infected with 107 CFU of pgm-negative CO92 YopE-Bla. hPCLS were washed, digested, and treated with CCF2-AM for flow cytometry. NI, noninfected hPCLS or background. The plot represents the number of blue cells (Yop targeted) in every 104 total cells of the hPCLS. (C) Flow cytometry plots from the experiment whose results are presented in panel B showing the gating for blue cells (Yop targeted). For all experiments, n was equal to 3 technical replicates (wells). The plots are representative of those from 3 independent experiments. Error bars represent SD. GFP, green fluorescent protein. Significance was calculated with Welch’s t test.
FIG 4
FIG 4
T3S of Y. pestis wild-type and Δpla strains in hPCLS. (A) Flow cytometry analyses of Yop translocation levels in hPCLS infected with CO92 and CO92 Δpla containing the YopE-Bla reporter. hPCLS were infected with 107 bacteria for 30 min or 1 h, washed, and either overlaid with medium for longer times or digested, stained with CCF2-AM, and fixed for analysis. The plot represents the number of blue cells (Yop targeted) in every 104 cells of the hPCLS. (B) Viability of hPCLS cells after infection with Y. pestis. hPCLS were infected with 107 CFU of CO92 and CO92 Δpla for 1 h, washed, and overlaid with medium. At the indicated time points, hPCLS were digested and stained with CCF2-AM to measure viability (green fluorescence, CCF2-AM positive) via flow cytometry. (C) Bacterial burden in hPCLS. Slices were infected with 105 CFU of CO92 and CO92 Δpla. At the indicated time points, hPCLS were digested and the contents of the well were serially diluted to enumerate the CFU. (D) Cell types targeted for Yop delivery by Y. pestis lacking Pla. hCPLS were infected with 107 CFU of the Y. pestis YopE-Bla wild-type and Δpla strains for 1 h, digested, and stained with fluorescently labeled antibodies. The plot represents the population of blue cells (Yop targeted) in every 105 of CD45+ cells that were alveolar macrophages (CD206+ CD71+), interstitial macrophages (CD206+ CD71), classical monocytes (CD206 CD71 CD14+), dendritic cells (CD206 CD14 CD11c+), neutrophils (CD206 CD24+ CD16+), or others (other CD45+ cells). (E) Analysis of the total cell types present in infected hPCLS. hCPLS were infected with 107 CFU of the Y. pestis YopE-Bla wild-type and Δpla strains treated as described in the legend to panel D. The plot represents the total population of alveolar macrophages, interstitial macrophages, classical monocytes, dendritic cells, neutrophils, and other CD45+ cells in the infected lung slices. For all experiments, n was equal to 3 technical replicates (wells). The plots are representative of those from 3 independent experiments. Error bars represent SD. Significance was calculated with Welch’s t test. *, P < 0.05; **, P < 0.01; ***, P < 0.001.
FIG 5
FIG 5
Infection of hPCLS with Y. pestis Δpla alters proinflammatory cytokine secretion. (A to C) Cytokine secretion in hPCLS infected with Y. pestis. hPCLS were infected with 107 CFU of CO92 and CO92 Δpla for 1 h, washed, and overlaid with medium. At the indicated time points, the medium was collected and filtered, and cytokines were measured using bead arrays. TNF-α (A), IL-6 (B), and IL-8 (C) levels after subtraction of the levels for uninfected cells are represented. For all experiments, n was equal to 3 technical replicates (wells). The plots are representative of those from 3 independent experiments. Error bars represent SD. Significance was calculated with Welch’s t test. **, P < 0.01; ***, P < 0.001.
FIG 6
FIG 6
Yop translocation in murine lungs in the presence and absence of Pla. (A) Yop translocation levels in the BALF of C57BL/6 mice infected with 5 × 104 CFU of CO92 and CO92 Δpla containing YopE-Bla for 4 and 12 h. BALF was treated with CCF2-AM and subjected to flow cytometry analysis. The plot represents the number of blue cells (Yop targeted) in every 104 cells of the BALF. (B) Number of bacterial CFU obtained in the lungs of infected C57BL/6 mice after BALF was collected. The plot represents the total combined number of CFU in the BALF and the lavaged lung at both 4 and 12 hpi. (C, D) BALF collected at 4 hpi (C) and 12 hpi (D) in the experiment whose results are presented in panel A was immunostained, stained with CCF2-AM, fixed, and analyzed by flow cytometry to identify the proportion of blue cells that were alveolar macrophages (F4/80+ CD11chigh CD11bmid/low), interstitial macrophages (CD45+ CD3 F4/80+ CD11clow CD11bhigh), neutrophils (CD45+ CD3 F4/80 Ly-6G+ CD11bhigh), dendritic cells (CD45+ CD3 F4/80 CD11chigh CD11bhigh/low), or others (other blue cells). For all experiments, n was equal to 5 mice. The plots are representative of those from 3 independent experiments. Error bars represent SD. Significance was calculated with Welch’s t test. *, P < 0.05; **, P < 0.01; ***, P < 0.001.

References

    1. Inglesby TV, Dennis DT, Henderson DA, Bartlett JG, Ascher MS, Eitzen E, Fine AD, Friedlander AM, Hauer J, Koerner JF, Layton M, McDade J, Osterholm MT, O'Toole T, Parker G, Perl TM, Russell PK, Schoch-Spana M, Tonat K. 2000. Plague as a biological weapon: medical and public health management. Working Group on Civilian Biodefense. JAMA 283:2281–2290. doi:10.1001/jama.283.17.2281. - DOI - PubMed
    1. Pechous RD, Sivaraman V, Stasulli NM, Goldman WE. 2016. Pneumonic plague: the darker side of Yersinia pestis. Trends Microbiol 24:190–197. doi:10.1016/j.tim.2015.11.008. - DOI - PubMed
    1. Mead PS. 2018. Plague in Madagascar—a tragic opportunity for improving public health. N Engl J Med 378:106–108. doi:10.1056/NEJMp1713881. - DOI - PubMed
    1. Tsuzuki S, Lee H, Miura F, Chan YH, Jung S-M, Akhmetzhanov AR, Nishiura H. 2017. Dynamics of the pneumonic plague epidemic in Madagascar, August to October 2017. Euro Surveill 22(46):pii=17-00710 10.2807/1560-7917.ES.2017.22.46.17-00710. - DOI - PMC - PubMed
    1. Drancourt M, Raoult D. 2018. Investigation of pneumonic plague, Madagascar. Emerg Infect Dis 24:183. doi:10.3201/eid2401.170760. - DOI - PMC - PubMed

Publication types