. 2019 Jun;11(6):521-532.
doi: 10.1038/s41557-019-0261-6. Epub 2019 May 13.

Diverse compounds from pleuromutilin lead to a thioredoxin inhibitor and inducer of ferroptosis

Affiliations

Diverse compounds from pleuromutilin lead to a thioredoxin inhibitor and inducer of ferroptosis

Evijola Llabani et al. Nat Chem. 2019 Jun.

Abstract

The chemical diversification of natural products provides a robust and general method for the creation of stereochemically rich and structurally diverse small molecules. The resulting compounds have physicochemical traits different from those in most screening collections, and as such are an excellent source for biological discovery. Herein, we subject the diterpene natural product pleuromutilin to reaction sequences focused on creating ring system diversity in few synthetic steps. This effort resulted in a collection of compounds with previously unreported ring systems, providing a novel set of structurally diverse and highly complex compounds suitable for screening in a variety of different settings. Biological evaluation identified the novel compound ferroptocide, a small molecule that rapidly and robustly induces ferroptotic death of cancer cells. Target identification efforts and CRISPR knockout studies reveal that ferroptocide is an inhibitor of thioredoxin, a key component of the antioxidant system in the cell. Ferroptocide positively modulates the immune system in a murine model of breast cancer and will be a useful tool to study the utility of pro-ferroptotic agents for treatment of cancer.


Conflict of interest statement

Competing interests

The University of Illinois has filed patents on some compounds described in this manuscript.

Figures

Figure 1:
Figure 1:. Compounds synthesized via ring system distortion of pleuromutilin using the CtD strategy.
a. Synthetic route to P5 from P using a ring contraction of the 8-membered ring followed by a Rubottom oxidation and oxidative cleavage. b. Synthetic route to P9 from P using ring expansion, diastereoselective epoxidation and elimination. c. Synthetic route to lactam P12 from P using a retro-Michael ring cleavage and oxidative rearrangement followed by a Beckmann ring expansion. d. Synthetic route to P15 upon ring fusion of P by C–H amidation followed by alkaline autoxidation, hydride migration, and lactonization. e. Synthesis of oxafenestranes from P as described previously.
Figure 2:
Figure 2:. Synthesis and evaluation of ferroptocide.
a. Structure of P4, a hit compound in the cytotoxic phenotypic screen. Synthesis of lead compound P18 (hereafter, ferroptocide). Below each compound is their respective 72 hr half-maximal inhibitory concentration (IC50) value against ES-2 cells. Data represent the mean ± s.e.m., n=3 biological replicates. b. Structure–activity relationship studies of P18 analogues, bioactivity is expressed as a 72 hr IC50 value against ES-2 cell line as measured by Alamar Blue fluorescence. Data represent the mean ± s.e.m., n=3 biological replicates. c. Ferroptocide displays broad activity in a 72 hr cell viability assay in immortalized cancer cells and in primary cells isolated from metastatic cancer patients. PPC: primary peritoneal carcinoma. Data represent the mean ± s.e.m., n=3 biological replicates. d. Tool compounds P28, P29, and P30 retain biological activity in a 72 hr cell viability assay in ES-2 cells. Confocal microscopy images of ES-2 cells treated with fluorescent analogue, P30 (1 μM) for 15 min show non-nuclear localization (green). Nucleus was stained with Hoechst (blue) n=3 biological replicates.
Figure 3:
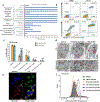
Figure 3:. Ferroptocide induces rapid non-apoptotic cell death.
a. Speed of death of cells treated with ferroptocide versus 16 other anticancer compounds in ES-2 cells (all tested at 10 μM). Cell viability was assessed by AV/PI analysis. Representative data shown from full time course data (three biological replicates) in Supplementary Fig. 8. b. Time-course analysis of ES-2 cell viability upon treatment with ferroptocide (10 μM) indicates a non-apoptotic mode of cell death. AV/PI graphs are representative of three biological replicates. c. Effect of pretreatment with Q-VD-OPh (25 μM) for 2 hr followed by dose-response treatment with ferroptocide or positive control Raptinal (5 μM) for 13 hr in ES-2 cells. Data are plotted as the mean ± s.e.m., n=3 biological replicates. Two-sided t-test, ***P = 0.0003, n.s. P > 0.05. d. Transmission electron micrographs of ES-2 cells treated with DMSO (left), ferroptocide (10 μM, center) or staurosporine (STS, 10 μM, right) for 30 min. The images show lack of apoptotic morphological features and swelling of mitochondria upon ferroptocide treatment (red arrows) versus controls. TEM data are representative images of three technical replicates. e. Co-localization analysis with mitochondria. ES-2 cells were stained with MitoTracker Red (100 nM) followed by 30 min treatment with fluorescent analogue P30 (10 μM). Nucleus was stained with Hoechst. Yellow dots indicate P30 (green) on the mitochondria (red) in merged images, n=3 independent experiments. f. Ferroptocide induces dose-dependent ROS generation within 1 hr similar to positive control TBHP in ES-2 cells (and also in HCT 116 cells, see Supplementary Fig. 2). DMSO and etoposide were included as negative controls. Data are representative of three independent experiments.
Figure 4:
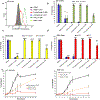
Figure 4:. Ferroptocide kills cancer cells through ferroptosis.
a. Ability of iron chelator deferoxamine (DFO) to prevent ferroptosis upon treatment with ferroptocide or positive control RSL3 for 1 hr in ES-2 cells (C11-BODIPY probe, lipid ROS). Data is representative of three independent biological experiments. b. Lipophilic antioxidant Trolox (250 μM) rescues ES-2 cells from ferroptocide-induced cytotoxicity after 14 hr incubation. c. Ability of ferroptosis inhibitor, ferrostatin (2 μM), to protect cells against ferroptocide treatment after 14 hr in ES-2 cells. d. Effect of DFO (100 μM) on viability of ES-2 cells after 14 hr incubation with ferroptocide and erastin (positive control). e. Comparison of speed of cell death of ferroptocide, RSL3, and erastin, each at 10 μM in HCT 116 and A549 (two K-RAS mutant cancer cell lines) respectively. b–e. Cell viability was determined with AV/PI staining. Data are plotted as the mean ± s.e.m., n=3 biological replicates. Two-sided t-test, **** P < 0.0001, *** 0.0001 ≤ P < 0.001, ** 0.001 ≤ P < 0.01, n.s. P > 0.05 (P values were 1.1 E−5, 1.8 E−6, 0.0001, 0.009 for trolox; 3.3 E−8, 6.5 E−6, 1.7 E−7, 0.0008, for ferrostatin-1; 0.0002, 3.3 E−8, 4.5 E−9, 0.003 for DFO from left to right).
Figure 5:
Figure 5:. Ferroptocide selectively and covalently modifies its target in cells.
a. Proteomic profile for fluorescent analogue P30 in HCT 116 cells after 60 min treatment reveals labeling of five main bands, n=3 biological replicates. (Note: Band A and A’ often appear as one band). Coomassie stain of gel demonstrates equal loading (Figure S9a). b. Competitive profiling of the proteomic reactivity of P30 with ferroptocide. HCT 116 cells were pre-treated with DMSO or various concentrations of ferroptocide (30 min) followed by treatment with P30 (1 μM, 30 min) and in-gel fluorescence analysis, n=3 biological replicates. Coomassie stain of gel demonstrates equal loading (Supplementary Fig. 9b). c. Ferroptocide covalently modifies the same target(s) in multiple cell lines. Competition experiments were performed by treatment of cells with DMSO or ferroptocide (20 μM, 30 min) followed by P30 incubation (1 μM, 30 min) and then analyzed using an in-gel fluorescence assay. Images are representative of three biological replicates. Coomassie stain of gels demonstrates equal loading (Supplementary Fig. 9c). d. Ferroptocide causes the same proteomic competitive profile in primary cells isolated from metastatic cancer patient samples. These cells were pre-treated with DMSO or ferroptocide (20 μM, 30 min) followed by P30 incubation (1 μM, 30 min) and in-gel fluorescence analysis. Representative images of two biological replicates. PPC: primary peritoneal carcinomatosis. Coomassie stain of gels demonstrates equal loading (Supplementary Fig. 9d). e. Schematic of biotin-streptavidin pulldown method: Treatment of HCT 116 cells with ferroptocide (20 μM, 30 min) and P29 (20 μM, 60 min) was followed by CuAAC reaction with biotin-azide and enrichment with streptavidin magnetic beads. On-bead trypsin digestion coupled to LC/LC–MS/MS provided a list of over 300 targets (see Data Package 2). f. Enrichment of proteins based on P values <0.05 and fold change >3 in HCT 116 cells, n=2 independent experiments, two-sided student t-test. Thioredoxin (TXN) was a top target candidate. g. Proteins identified for follow-up characterization based on shared enrichment in both HCT 116 and ES-2 cell lines, as well as molecular weights matching the bands observed by gel.
Figure 6:
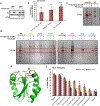
Figure 6:. Ferroptocide modulates active site cysteines of thioredoxin.
a. Immunoblot of thioredoxin pulldown upon treatment of HCT 116 cells with DMSO or P29 (20 μM, 60 min) followed by CuAAC reaction with biotin-azide and streptavidin enrichment. BPD (biotin pulldown) and input (soluble cell lysate). Images are representative of three biological experiments. b. Effect of ferroptocide (20 μM) and known inhibitors PMX464 and PX-12 (50 μM) on thioredoxin activity in ES-2 cells after 30 min incubation. Data are represented as mean ± s.e.m, two-sided student t-test, P-values are relative to DMSO control (0.003 and 0.03 from left to right); ** 0.001 ≤ P < 0.01, * 0.01 ≤ P < 0.05, n.s. P > 0.05, n=3 independent experiments. c. Competition profile of thioredoxin labeling by probe P29 (20 μM, 60 min) upon pretreatment with DMSO or ferroptocide (20 μM, 30 min) followed by CuAAC with Cy3 azide in HCT 116 cells overexpressing TXN-GFP plasmid vs. non-transfected (wild type, WT) cells, Cy3 channel. Red box indicates competition of the band of interest. Representative in-gel fluorescence images of n=3 biological replicates. Coomassie stain of gel demonstrates equal loading (Supplementary Fig. 10). d. Identification of ferroptocide labeling sites on thioredoxin. In-gel fluorescence scanning of HCT 116 cells overexpressing each cysteine-mutated thioredoxin. Cells were pre-treated with DMSO or ferroptocide (20 μM, 30 min) followed by incubation with P29 probe (5 μM, 60 min) and then CuAAC reaction with Cy3 azide. The serine mutations of the active site cysteines 32, 35 and cysteine 73 diminished compound labeling. Data are representative of three biological replicates. Coomassie stain of gels demonstrates equal loading (Supplementary Fig. 11). e. Crystal structure of thioredoxin with cysteine residues colored in red (PIB:1ERT). f. siRNA of thioredoxin in HCT 116 cells (48 hr) sensitizes them to ferroptocide treatment (10 μM) but not Raptinal (10 μM) at the indicated time points. Note: siRNA of TXN at 48 hr is not toxic to cells. Cell viability was determined with AV/PI staining. Data are plotted as the mean ± s.e.m., n=3 biological replicates. Two-sided student t-test, **** P < 0.0001, *** 0.0001 ≤ P < 0.001, ** 0.001 ≤ P < 0.01, n.s. P > 0.05 (P values were 0.04, 0.004, 0.0006, 0.03, 0.04, 0.006 from left to right).
Figure 7:
Figure 7:. Ferroptocide modulates the immune system.
Ferroptocide inhibits subcutaneous 4T1 tumor growth in immunocompetent Balb/c mice (left) but not in immunodeficient SCID mice (right) as measured by tumor volume. Ferroptocide was administered intraperitoneally at 50 mg/kg, twice a week, five doses (n=7 mice per group). Data represent the mean ± s.e.m. Two-sided student t-test, P values are relative to vehicle control; ** p < 0.01, * 0.01 ≤ p < 0.05 (0.009 and 0.04 from left to right).

Comment in

  • Diverse engineering.
    Cañeque T, Rodriguez R. Cañeque T, et al. Nat Chem. 2019 Jun;11(6):499-500. doi: 10.1038/s41557-019-0269-y. Nat Chem. 2019. PMID: 31086301 No abstract available.

References

    1. Lovering F, Bikker J & Humblet C Escape from flatland: Increasing saturation as an approach to improving clinical success. J. Med. Chem 52, 6752–6756, (2009). - PubMed
    1. Swinney DC & Anthony J How were new medicines discovered? Nat. Rev. Drug Discov 10, 507–519, (2011). - PubMed
    1. Galloway WRJD, Isidro-Llobet A & Spring DR Diversity-oriented synthesis as a tool for the discovery of novel biologically active small molecules. Nat. Commun 1, 80–93, (2010). - PubMed
    1. Gerry CJ & Schreiber SL Chemical probes and drug leads from advances in synthetic planning and methodology. Nat. Rev. Drug Discov 17, 333–352, (2018). - PMC - PubMed
    1. Morrison KC & Hergenrother PJ Natural products as starting points for the synthesis of complex and diverse compounds. Nat. Prod. Rep 31, 6–14, (2014). - PubMed

Publication types

MeSH terms