. 2019 Aug;4(8):1294-1305.
doi: 10.1038/s41564-019-0439-0. Epub 2019 May 13.

Bacillus subtilis cell diameter is determined by the opposing actions of two distinct cell wall synthetic systems

Affiliations

Bacillus subtilis cell diameter is determined by the opposing actions of two distinct cell wall synthetic systems

Michael F Dion et al. Nat Microbiol. 2019 Aug.

Abstract

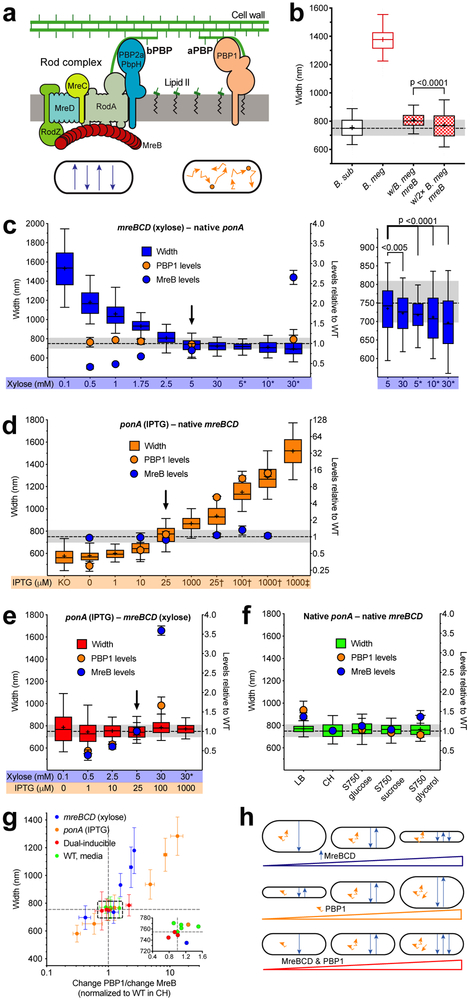
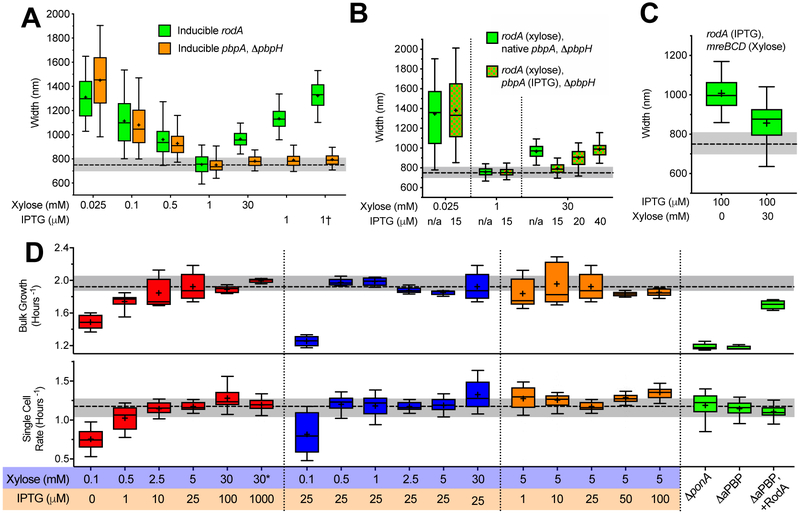
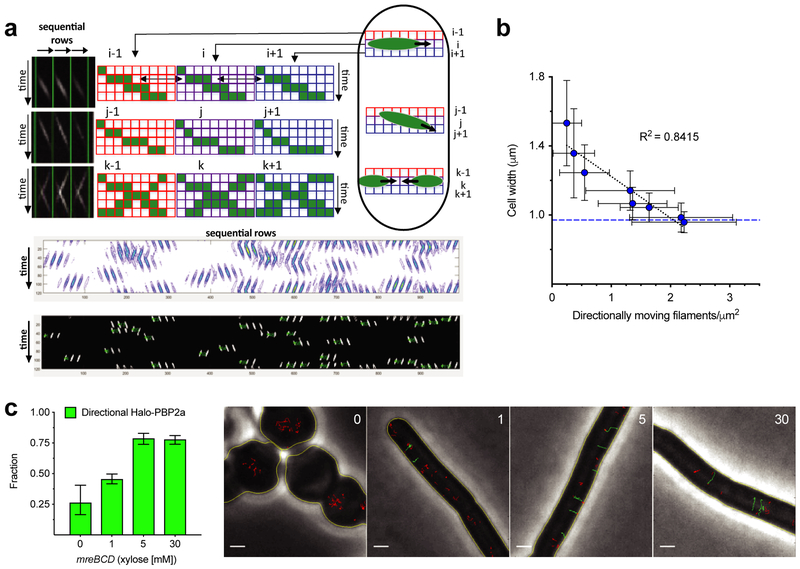
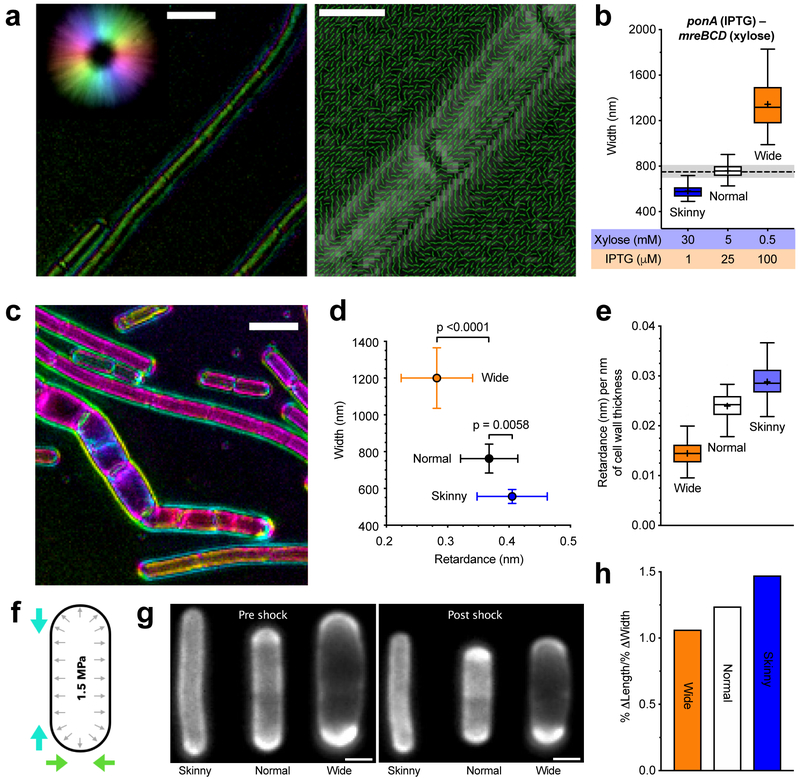
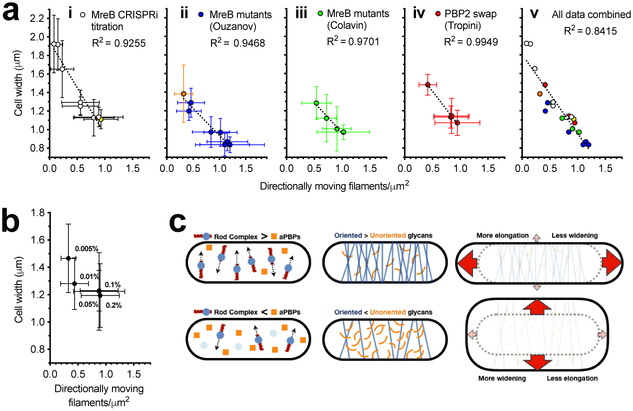
Rod-shaped bacteria grow by adding material into their cell wall via the action of two spatially distinct enzymatic systems: the Rod complex moves around the cell circumference, whereas class A penicillin-binding proteins (aPBPs) do not. To understand how the combined action of these two systems defines bacterial dimensions, we examined how each affects the growth and width of Bacillus subtilis as well as the mechanical anisotropy and orientation of material within their sacculi. Rod width is not determined by MreB, rather it depends on the balance between the systems: the Rod complex reduces diameter, whereas aPBPs increase it. Increased Rod-complex activity correlates with an increased density of directional MreB filaments and a greater fraction of directional PBP2a enzymes. This increased circumferential synthesis increases the relative quantity of oriented material within the sacculi, making them more resistant to stretching across their width, thereby reinforcing rod shape. Together, these experiments explain how the combined action of the two main cell wall synthetic systems builds and maintains rods of different widths. Escherichia coli Rod mutants also show the same correlation between width and directional MreB filament density, suggesting this model may be generalizable to bacteria that elongate via the Rod complex.


Figures

Figure 1 —
Figure 1 —. Rod width depends on the relative levels of widening aPBPs to the thinning Rod system.
Except where indicated, all strains were grown in CH medium. For b–f, the median width of WT B. subtilis grown in CH is depicted by dashed line, grey shading indicates 25–75 percentiles. For details regarding statistics and box plot definitions, see the “Statistics” subheading in “Methods”. a. Diagram depicting the two peptidoglycan synthesis systems responsible for elongation. Bottom - schematic of each system’s in vivo motions. b. B. subtilis expressing B. megaterium mreB forms rods close to B. subtilis width.B. sub” is WT B. subtilis.B. meg is B. megaterium. Checkered boxes are bMD465 (amyE::erm Pxyl-mreBCD minCDB. megaterium, ΔmreBCD ΔminCD::spc mreBCD minCDB. megaterium), a B. subtilis strain where the native mreBCD minCD operon was replaced with the same operon from B. megaterium, and an additional B. megaterium mreBCD minCD operon under xylose control at an ectopic locus. “w/B. meg mreB” was grown with 1% glucose to repress ectopic expression. “w/2× B. meg mreB” was grown with 30 mM xylose to overexpress the ectopic B. megaterium mreB operon. c–f. Titrations of ponA and mreBCD vs. cell width. Strains were grown with the inducer concentrations below each graph. Width plotted on left, mean MreB and PBP1 relative abundances (determined by mass spectrometry, normalized to levels in WT cells grown in CH) on right. Arrowheads are inductions producing WT widths and protein levels. Supplementary Figure 3c shows effects on cell length. c. Diameter decreases with mreBCD induction. Inductions of bMD545 (amyE::erm Pxyl-mreBCD, ΔmreBCD::spc), except for those marked * which are bMK355 (amyE::erm Pxyl-mreBCD) containing a xylose-inducible mreBCD in addition to native mreBCD. Right is a zoomed view of highest 5 inductions. Supplementary Figure 1c–d shows MreB levels determined by western blot across the entire range. d. Cell diameter increases with ponA induction. “KO” is bMK005 (ΔponA::cat). Inductions of bMD598 (yhdG::cat Pspank-ponA, ΔponA::kan), except for the those marked and , which are under stronger promoters; is bMD586 (yhdG::cat Phyperspank-ponA, ΔponA::kan), is bMD554 (yhdG::cat Phyperspank-ponA) which has an inducible ponA in addition to the native copy. e. Balanced expression of both PG synthetic systems yields normal width across a large range. Dual inductions of bMD620 (amyE::erm Pxyl-mreBCD, ΔmreBCD::spc, yhdH::cat Pspank-ponA, ΔponA::kan). * indicates bMD622 (amyE::erm Pxyl-mreBCD, yhdG::cat Pspank-ponA, ΔponA::kan) with a xylose-inducible mreBCD in addition to native mreBCD. f. WT B. subtilis maintains constant width in different media. g. WT width is maintained within a narrow range of relative PBP1/MreB ratios. Plotted are mean widths (error bars are SD) of cells from c–f against the ratio of fold change in PBP1 to MreB. Inset shows zoomed view of box. Lines indicate mean WT width and PBP1/MreB ratio. h. Model for how the two PG synthesis systems affect rod width. Top – As circumferentially organized PG synthesis increases (blue arrows), cell diameter decreases. Middle – As non-circumferential synthesis increases (orange squiggles), so does cell diameter. Bottom – As long as non-circumferential and circumferential synthesis is balanced, width remains constant, even across a range of protein levels.
Figure 2 —
Figure 2 —. Effects of RodA/PBP2a on cell width, and how each PG synthetic system affects growth.
All strains were grown in CH medium in the inducer concentrations shown below the graphs. For details regarding statistics and box plot definitions see the “Statistics” subheading in “Methods”. a–c. Titrations of rodA, pbpA, and mreBCD vs. cell width. The median width of WT B. subtilis grown in CH is depicted by dashed line, grey shading indicates 25–75 percentiles. a. As rodA or pbpA induction is increased, cell diameter decreases up to a point, beyond which it increases with rising rodA induction, but not for pbpA. Green boxes are bMD592 (rodA::erm Pxyl-rodA), save bMD580 (yhdG::cat Phyperspank-rodA, ΔrodA::kan) and bMD556 (yhdG::cat Phyperspank-rodA – labeled †). Orange boxes are bMD597 (pbpA::erm Pxyl-pbpA, ΔpbpH::spc), save bMD574 (yhdG::cat Phyperspank-pbpA, ΔpbpA::erm, ΔpbpH::spc) and bMD573 (yhdG::cat Phyperspank-pbpA, ΔpbpH::spc – labeled ). b. Overexpression of rodA increases cell diameter, but only when pbpA expression is also sufficiently high. Green boxes are bMD627 (rodA::erm Pxyl-rodA, ΔpbpH::spc). Green/orange checkered boxes are bMD631 (rodA::erm Pxyl-rodA, yhdG::ble Pspank-pbpA, ΔpbpH::spc). c. The increase in cell diameter caused by overexpression of rodA is reduced by simultaneous overexpression of mreBCD. Green boxes are bMD583 (yhdG::cat Phyperspank-rodA, ΔrodA::kan, amyE::erm Pxyl-mreBCD). d. Rates of cell growth measured at the population and single cell level. Rates of growth were measured either by (top) OD600 in a shaking plate reader, or (bottom) by microscopically assaying the rate single cells (grown under a CH agarose pad) increased in perimeter. All measures are bMD620 (amyE::erm Pxyl-mreBCD, ΔmreBCD::spc, yhdG::cat Pspank-ponA, ΔponA::kan), with the exception of: “ΔponA” which is bMK005 (ΔponA::cat), “ΔaPBP” which is bAM268 (ΔpbpF, ΔpbpG, ΔpbpD, ΔponA::kan), and “ΔaPBP+ RodA” which is bAM288 (ΔpbpF, ΔpbpG, ΔpbpD. ΔponA:kan, amyE::spc Phyperspank-rodA-His10), where rodA is induced with 25 μM IPTG. Median growth rate of WT B. subtilis grown in CH is depicted bydashed lines, with shading indicating 25–75 percentiles.
Figure 3 —
Figure 3 —. Increased mreBCD increases directional MreB filament density and the fraction of directional PBP2a molecules.
a. Schematic of our method to quantitate directional MreB filament density. Example data (top) generated from simulated TIRFM movies. First, a kymograph is generated for each row of pixels along the cell midline. These kymographs are lined up side by side to generate a single 2D image, where each column contains a kymograph of each sequential row of pixels in the cell. First, the image is adaptively thresholded, then segmented with contour analysis to extract fluorescent objects (middle). These objects are used to get velocity (slope), time (centroid), and position (row) for each particle. As particles will show similar intensities in adjacent rows, or sometimes move at angles, objects up to two rows apart are grouped based on time, position, and velocity. This yields the final particle count (bottom). See Supplementary Figure 5 for further details and validations. b. Increasing mreBCD induction correlates with an increasing density of directionally moving MreB filaments. bYS981 (amyE::erm Pxyl-mreB-msfGFPsw mreCD, ΔmreBCD::spc) was grown in different amounts of xylose, imaged with TIRFM, and analyzed as in a. Plotted are mean cell widths (error bars are SD) against the density of directionally moving filaments. Blue dotted line indicates mean width of bYS19, expressing MreB-msfGFPsw at the native locus. (Note that strains that contain fluorescent protein-MreB fusions are wider than WT.) c. The fraction of directionally moving Halo-PBP2a molecules increases with MreBCD expression. Left – mreBCD was induced in bMK385 (amyE::erm Pxyl-mreBCD, ΔmreBCD::spc, pbpA::cat HaloTag-11aa-pbpA) in different amounts of xylose, and single molecules of JF-549-labeled Halo-PBP2a were imaged by TIRFM. Plotted are the mean (error bars are 95% CI) fraction of labeled PBP2a trajectories over 7 frames in length that moved directionally. Right - Representative montage of Halo-PBP2a trajectories at different levels of mreBCD inductions overlaid on phase images. Directionally moving tracks are green; all other tracks are red. Scale bars are 1 μm. See also Supplementary Movie 1.
Figure 4 —
Figure 4 —. Increased Rod activity increases both the amount of oriented material within sacculi and their mechanical anisotropy.
For details regarding statistics and box plot definitions, see the “Statistics” subheading in “Methods”. a. Polarization microscopy reveals oriented material within the cell wall. Retardance is the differential optical path length for light polarized parallel and perpendicular to the axis of molecular alignment; alternatively, it is defined as birefringence (Δn) multiplied by the path length through an anisotropic material. Left – Example LC-PolScope image of purified WT sacculi. Focused at the surface, the wall is seen to be birefringent. Color is the slow axis orientation, intensity corresponds to retardance in that direction (reference, upper left circle). Scale bar is 2 μm. Right - Polarization orientation view of sacculi surface; lines point in predominant orientation of the slow axis. Scale bar is 1 μm. See also Supplementary Movie 2. b. Inductions used to assay sacculi. bMD620 (amyE::erm Pxyl-mreBCD, ΔmreBCD::spc, yhdG::cat Pspank-ponA, ΔponA::kan) was induced to grow at 3 different widths. Dashed line is the median width of WT B. subtilis, shading indicates 25-75 percentiles. c. Example LC-PolScope image of bMD620 sacculi induced at different widths. Pairs of purified sacculi (wide and normal, or wide and skinny) were combined and Z-stacks collected in 100 nm steps. Scale bar is 2 μm. See also Supplementary Movie 3. d–e. The amount of oriented material in the cell wall increases with mreBCD induction, and inversely correlates with width. d. Mean retardance vs. width of projected Z-stacks of at least 90 different cells for each condition (error bars are SD). e. Mean retardance normalized to the mean thickness of cell walls in each induction condition (determined with TEM; Supplementary Figure 6a). f. Schematic of osmotic shock assay of anisotropy. B. subtilis sacculi are normally stretched by high internal turgor (black arrows). Hyperosmotic shocks negate this pressure, allowing observation of how sacculi shrink in length and width (colored arrows). g. Example FDAA-labeled cells before and after shocks. Scale bars are 1μm. h. As the relative amount of Rod activity increases, so does the mechanical anisotropy of the sacculus. Percent change in length/percent change in width for each condition following osmotic shock. See also Supplementary Figure 6b–d.
Figure 5 —
Figure 5 —. Directional MreB filament density also correlates with cell width of E. coli Rod mutants.
For details regarding statistics see the “Statistics” subheading in “Methods”. Filament densities in a and b were calculated as in Figure 3b. a. Cell width vs. density of directionally moving MreB filaments in different E. coli strains. (i) AV88 (186::Ptet-dCas9, mreB::mreB-msfGFPsw) allows the tunable expression of MreB-msfGFPsw by expressing various sgRNAs with different matches against msfGFP. Yellow indicates WT expression. (ii) MreB-msfGFPsw mutant strains from Ouzounov et al., 2016. Orange indicates RM478 (ΔrodZ, mreB(S14A)-msfGFPsw) from Morgenstein et al., 2015. (iii) MreB-msfGFPsw mutants believed to change filament curvature from Colavin et al., 2018. (iv) msfGFP-MreB strains from Tropini et al., 2015, where mrdA is replaced with mrdA from other species. (v) All data from (i)–(iv) combined. See also Supplementary Movie 4. b. Decreased cell width caused by increased RodZ expression correlates with an increased density of directionally moving MreB filaments. KC717 (csrD::kan, mreB::msfGFP-mreB, ProdZ<>(frt araC PBAD)) was grown at different arabinose concentrations (%, indicated on the graph). See also Supplementary Movie 5. c. Model for how the balance between aPBPs and the Rod system affects cell width. When Rod complex activity is high relative to that of aPBPs (top left), sacculi have more circumferentially oriented material (top center) compared to when aPBP activity is greater (bottom left, bottom center). As the amount of oriented material increases, sacculi become more rigid across their width, but less rigid along their length. Thus, stretched by the internal turgor pressure, sacculi with more Rod activity are better able to maintain their width, and instead, stretch more along their length (top right). In contrast, cells with reduced Rod activity have less circumferentially oriented glycans to reinforce their width, and thus expand more along their width (bottom right).

References

    1. Vadia S & Levin PA Growth rate and cell size: a re-examination of the growth law. Curr Opin Microbiol 24, 96–103 (2015). - PMC - PubMed
    1. Sharpe ME, Hauser PM, Sharpe RG & Errington J Bacillus subtilis cell cycle as studied by fluorescence microscopy: constancy of cell length at initiation of DNA replication and evidence for active nucleoid partitioning. J Bacteriol 180, 547–555 (1998). - PMC - PubMed
    1. Vollmer W, Blanot D & de Pedro MA Peptidoglycan structure and architecture. FEMS Microbiol Rev 32, 149–167 (2008). - PubMed
    1. Lebar MD et al. Reconstitution of Peptidoglycan Cross-Linking Leads to Improved Fluorescent Probes of Cell Wall Synthesis. J Am Chem Soc 136, 10874–10877 (2014). - PMC - PubMed
    1. Banzhaf M et al. Cooperativity of peptidoglycan synthases active in bacterial cell elongation. Mol Microbiol 85, 179–194 (2012). - PubMed

Publication types

MeSH terms