

C9ORF72-ALS/FTD-associated poly(GR) binds Atp5a1 and compromises mitochondrial function in vivo
- PMID: 31086314
- PMCID: PMC6800116
- DOI: 10.1038/s41593-019-0397-0
C9ORF72-ALS/FTD-associated poly(GR) binds Atp5a1 and compromises mitochondrial function in vivo
Abstract
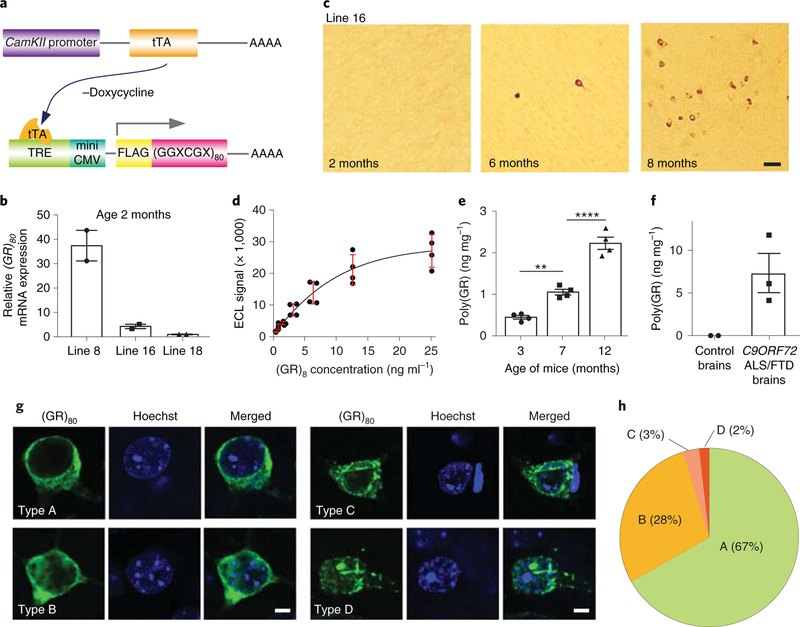
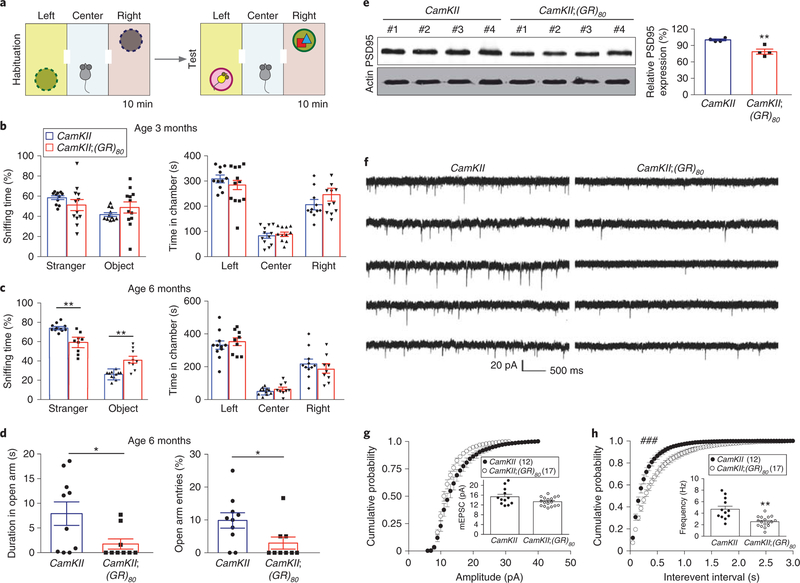
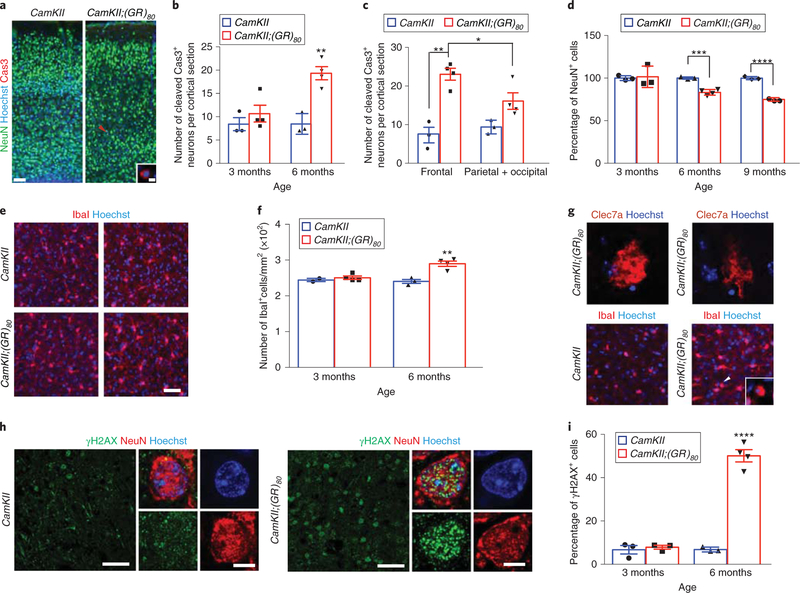
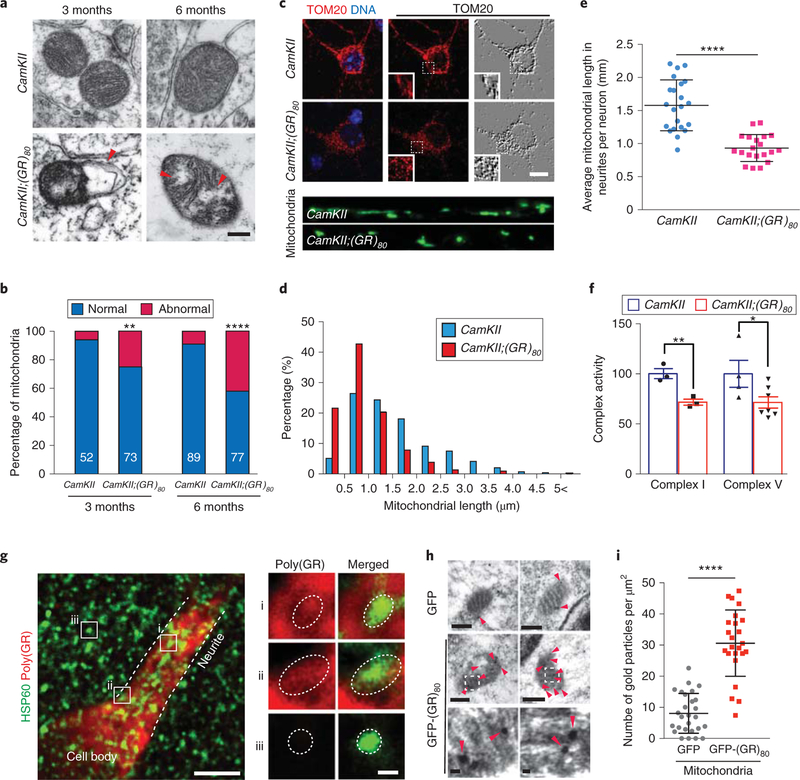
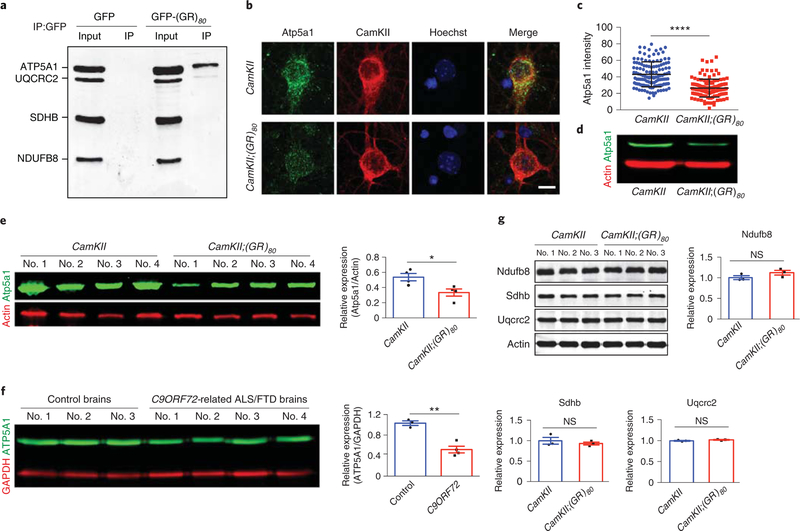
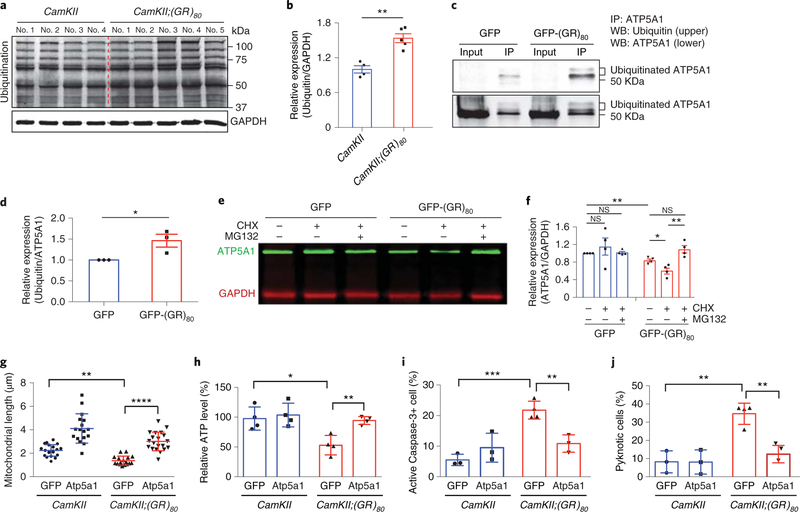
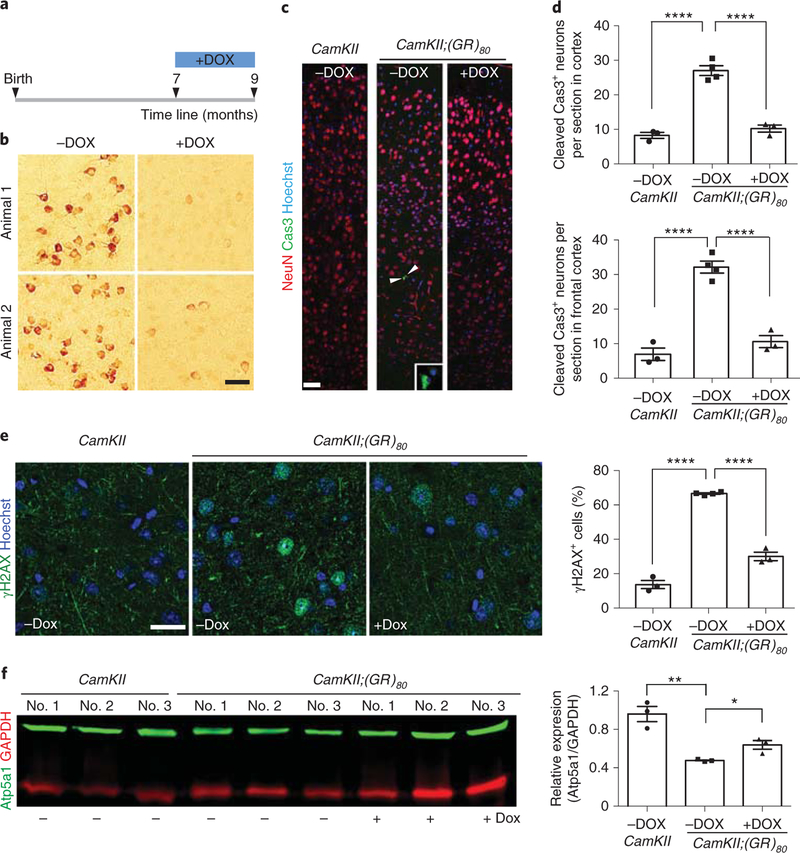
The GGGGCC repeat expansion in C9ORF72 is the most common genetic cause of amyotrophic lateral sclerosis (ALS) and frontotemporal dementia (FTD). However, it is not known which dysregulated molecular pathways are primarily responsible for disease initiation or progression. We established an inducible mouse model of poly(GR) toxicity in which (GR)80 gradually accumulates in cortical excitatory neurons. Low-level poly(GR) expression induced FTD/ALS-associated synaptic dysfunction and behavioral abnormalities, as well as age-dependent neuronal cell loss, microgliosis and DNA damage, probably caused in part by early defects in mitochondrial function. Poly(GR) bound preferentially to the mitochondrial complex V component ATP5A1 and enhanced its ubiquitination and degradation, consistent with reduced ATP5A1 protein level in both (GR)80 mouse neurons and patient brains. Moreover, inducing ectopic Atp5a1 expression in poly(GR)-expressing neurons or reducing poly(GR) level in adult mice after disease onset rescued poly(GR)-induced neurotoxicity. Thus, poly(GR)-induced mitochondrial defects are a major driver of disease initiation in C9ORF72-related ALS/FTD.
Figures
References
-
- Hardiman O. et al. Amyotrophic lateral sclerosis. Nat. Rev. Dis. Primers 3, 17085 (2017). - PubMed
Publication types
MeSH terms
Substances
Supplementary concepts
Grants and funding
LinkOut - more resources
Full Text Sources
Other Literature Sources
Medical
Molecular Biology Databases
Miscellaneous
