. 2019 Jun;22(6):897-908.
doi: 10.1038/s41593-019-0399-y. Epub 2019 May 13.

Proneural factors Ascl1 and Neurog2 contribute to neuronal subtype identities by establishing distinct chromatin landscapes

Affiliations

Proneural factors Ascl1 and Neurog2 contribute to neuronal subtype identities by establishing distinct chromatin landscapes

Begüm Aydin et al. Nat Neurosci. 2019 Jun.

Abstract

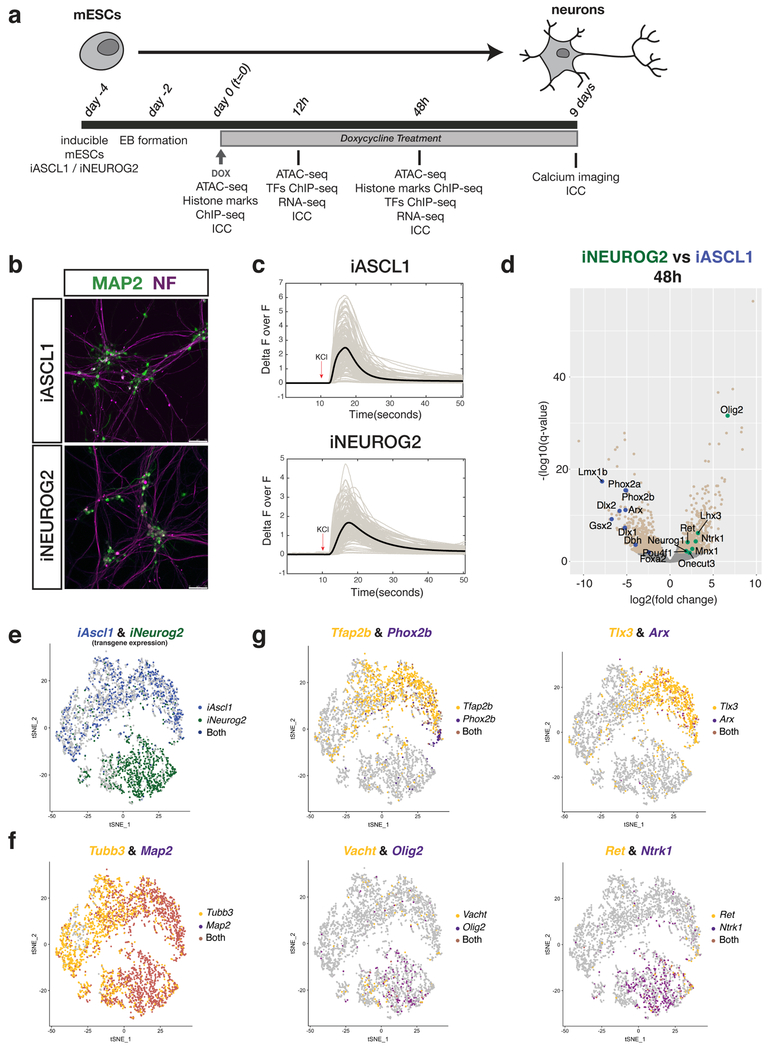
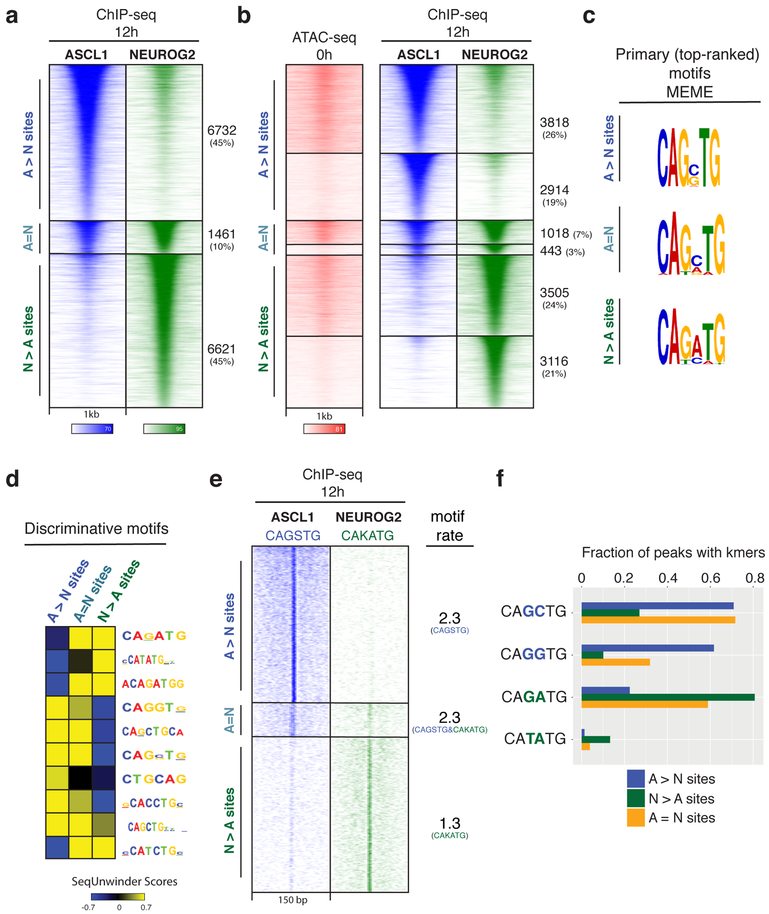
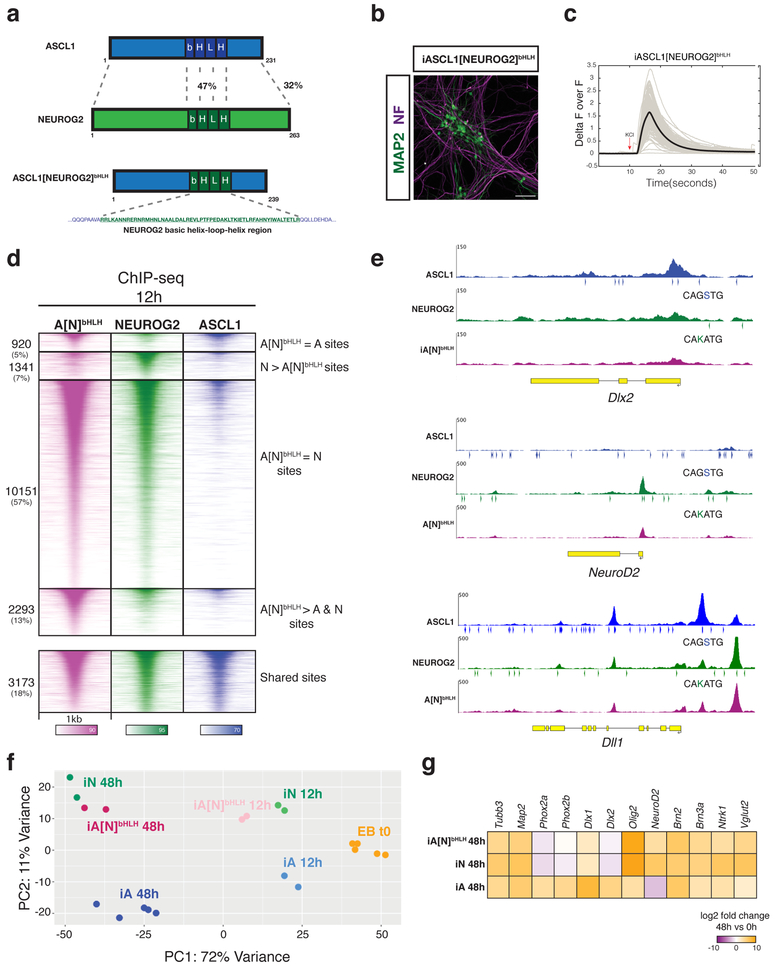
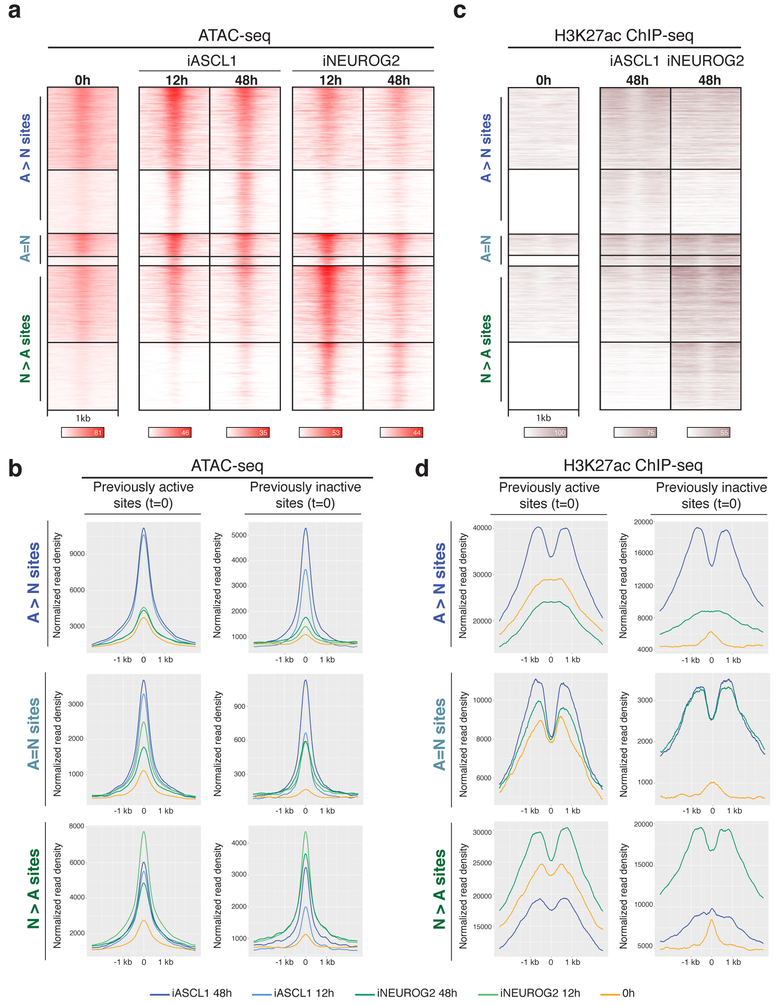
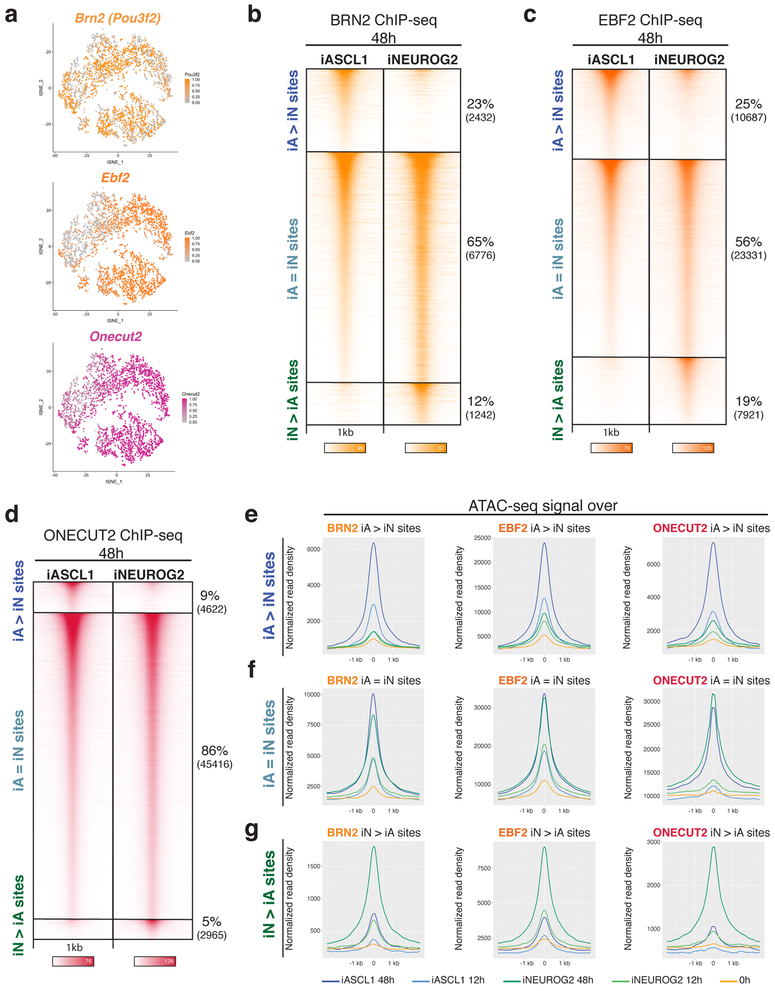
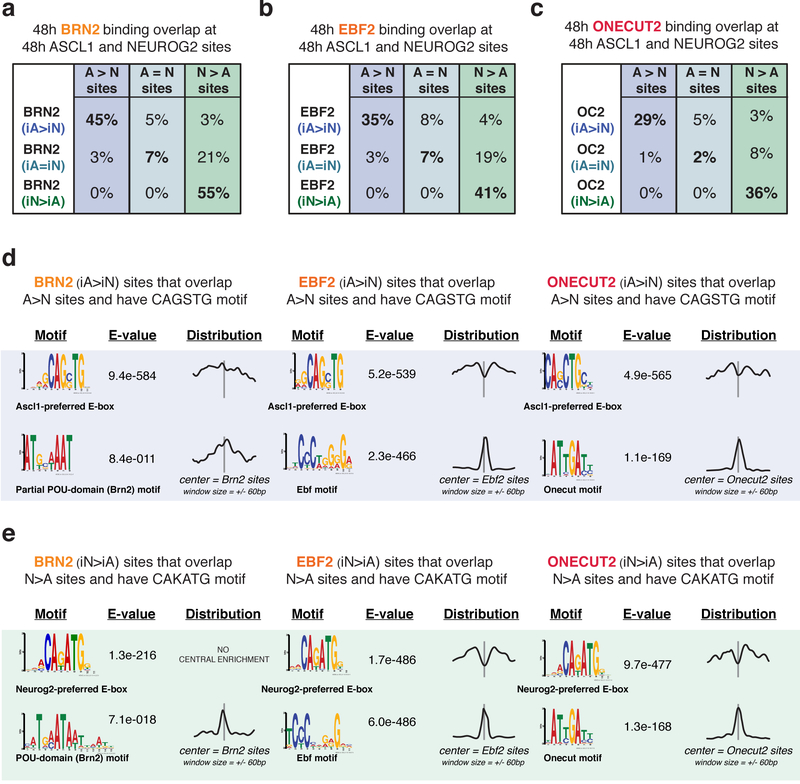
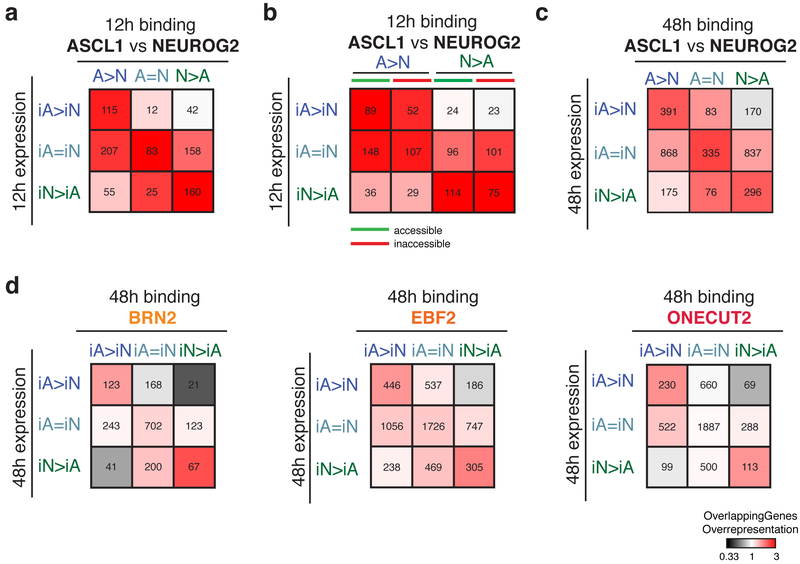
Developmental programs that generate the astonishing neuronal diversity of the nervous system are not completely understood and thus present a major challenge for clinical applications of guided cell differentiation strategies. Using direct neuronal programming of embryonic stem cells, we found that two main vertebrate proneural factors, Ascl1 and neurogenin 2 (Neurog2), induce different neuronal fates by binding to largely different sets of genomic sites. Their divergent binding patterns are not determined by the previous chromatin state, but are distinguished by enrichment of specific E-box sequences that reflect the binding preferences of the DNA-binding domains. The divergent Ascl1 and Neurog2 binding patterns result in distinct chromatin accessibility and enhancer activity profiles that differentially shape the binding of downstream transcription factors during neuronal differentiation. This study provides a mechanistic understanding of how transcription factors constrain terminal cell fates, and it delineates the importance of choosing the right proneural factor in neuronal reprogramming strategies.


Conflict of interest statement

Competing interests

Authors declare no competing interests.

Figures

Fig. 1:
Fig. 1:. Ascl1 and Neurog2 induction in differentiating mESCs generates neurons with distinct neuronal subtype bias.
a, Experimental scheme (EB: Embryoid body; ICC: Immunocytochemistry). b, iA and iN neurons express mature neuronal markers MAP2 (green) and Neurofilament (NF; purple) 9 days after Ascl1 and Neurog2 induction, respectively. Similar results were obtained n=2 independent cell differentiations. c, iA and iN neurons change their Ca++ levels upon KCl depolarization (9 days after induction). The thick line shows the average of individual recordings (from n=2 independent cell differentiations). d, Volcano plot comparing mRNA levels between iA and iN neurons by RNA-seq at 48 hours after induction (iA 48h n=5; iN 48h n=2). Beige dots represent the differentially expressed genes between iA or iN (q-value < 0.01, Wald test). Green and blue dots represent examples of differentially expressed genes in iN and iA, respectively. e, tSNE plot showing the single-cell clustering of the iA or iN neurons. Dots are colored by the expression of transgenes (iA cells – blue (top cluster), iN cells – green (bottom cluster) (n=1 cell differentiation). f, tSNE plot showing the cells that express generic neuronal markers Tubb3 and Map2. Note the maturation axis towards the left of the clusters (n=1 cell differentiation). g, tSNE plots showing iA and iN clusters expressing distinct neuronal subtype markers. The dots are colored by expression of Ascl1-specific genes Tfap2b&Phox2b (noradrenergic) and Tlx3&Arx (interneuron) (top panel), or Neurog2-specific genes Vacht&Olig2 (motor neuron) and Ret&Ntrk1 (sensory neuron) (bottom panel) (n=1 cell differentiation).
Fig. 2:
Fig. 2:. Genome-wide characterization of Ascl1 and Neurog2 binding and its determinants.
a, ChIP-seq heatmap showing Ascl1 and Neurog2 binding at 12 hours after induction. Ascl1- and Neurog2-preferred sites are designated as “A>N” and “N>A”, respectively. Sites that are bound by both Ascl1 and Neurog2 are designated as shared sites (A=N). Top 10k sites are plotted on the heatmap within a 1kb window around the peak center (n=3). b, Ascl1 and Neurog2 binding does not depend on prior chromatin accessibility. Ascl1 and Neurog2 ChIP-seq heatmap partitioned into previously accessible and inaccessible sites per 0h ATAC-seq signal at bound sites. c, Primary (top-ranked) motifs enriched at the differentially bound A>N, N>A, and shared (A=N) sites differ in central nucleotides. d, The discriminative motifs enriched at the A>N, A=N, N>A sites corroborate the relative enrichment of the distinct E-box variants. e, CAGSTG and CAKATG k-mer occurrences plotted at Ascl1 and Neurog2 binding sites within a 150 bp window (S: G/C; K: G/T). The rate of motif/k-mer occurrence at the binding sites are shown on the right. f, Ascl1 and Neurog2 differentially bound sites are distinguished by specific E-box instances. Fraction of differentially bound and shared sites containing various k-mer sequences within a 150 bp window around the peak center.
Fig. 3:
Fig. 3:. bHLH domain of Neurog2 is sufficient to drive both the genomic binding and transcriptional output.
a, Schematic of generation of the bHLH chimera by swapping the bHLH domain of Ascl1 with that of Neurog2. The percentages represent the amino acid sequence similarity between the bHLH domains (47%) and the overall protein (32%). The A[N]bHLH chimeric TF construct was used to generate a stable inducible iA[N]bHLH line. b, Expression of A[N]bHLH chimeric TF generates neurons that express mature neuronal markers MAP2 (green) and NF (purple) 9 days after induction. Similar results were observed in two independent cell differentiations. c, iA[N]bHLH neurons respond to KCl-induced depolarization by changing their intracellular Ca++ levels. Thick line represents the average across recordings (from n=2 independent cell differentiations). d, The A[N]bHLH chimera binds largely to Neurog2 sites in the genome. ChIP-seq heatmap showing the binding sites of A[N]bHLH chimera in comparison to Neurog2 and Ascl1. e, Genome browser snapshots of Ascl1, Neurog2, and A[N]bHLH chimera binding sites (12h ChIP-seq) with distribution of Ascl1- or Neurog2-preferred E-boxes (arrowheads) on subtype-specific genes (Dlx2 and NeuroD2) and a shared target Dll1 (S: G/C; K: G/T) (A[N]bHLH n=2). f, Principal Component Analysis (PCA) of the RNA-seq replicates shows A[N]bHLH chimera-induced neurons (iA[N]bHLH) cluster with Neurog2-induced neurons (iN) both at 12h and 48h (each dot represents independent cell differentiations). g, RNA-seq heatmap showing the expression of representative subtype-specific genes in iA, iN, and iA[N] neurons at 48h.
Fig. 4:
Fig. 4:. Ascl1 and Neurog2 binding results in differential chromatin accessibility and enhancer activity.
a, Time-series ATAC-seq heatmaps displaying the gain of accessibility at the Ascl1 and Neurog2 binding sites (n=2). b, Metagene plots of accessibility (ATAC-seq reads) at the differentially bound and shared sites of Ascl1 and Neurog2 that were previously active (left) or previously inactive (right) before induction of the TFs (0h or EB t=0). c, H3K27ac ChIP-seq at Ascl1 and Neurog2 binding sites at 48h shows the gain of enhancer activity at the bound sites in comparison to 0h (n=2). d, Metagene plots of H3K27ac ChIP-seq at the differentially bound and shared sites of Ascl1 and Neurog2 that were previously active (left) or previously inactive (right) before the induction of the TFs (0h or EB t=0).
Fig. 5:
Fig. 5:. Differential chromatin landscapes induced by Ascl1 and Neurog2 shape the binding patterns of the shared downstream TFs.
a, tSNE plots showing the cells that express downstream TFs (Top cluster iA, below cluster iN – Fig. 1e). The dots are colored by the expression levels of downstream TF Brn2, Ebf2, and Onecut2 (n=1 cell differentiation). b-d, ChIP-seq heatmaps of endogenous Brn2 (A), Ebf2 (B), and Onecut2 (C) binding in iA and iN neurons at 48h after induction of Ascl1 and Neurog2. “iA>iN” designates sites enriched in iA neurons, “iN>iA” designates sites enriched in iN neurons, and “iA=iN” designates shared binding in both neurons (n=2). e, Metagene plots of accessibility (ATAC-seq reads) overlap at the differentially bound sites of Brn2 (left), Ebf2 (middle), and Onecut2 (right) in iA neurons (iA>iN sites).f, Metagene plots of accessibility (ATAC-seq reads) overlap at the shared sites of Brn2 (left), Ebf2 (middle), and Onecut2 (right) in iA and iN neurons (iA=iN sites). g, Metagene plots of accessibility (ATAC-seq reads) overlap at the differentially bound sites of Brn2 (left), Ebf2 (middle), and Onecut2 (right) in iN neurons (iN>iA sites).
Fig. 6:
Fig. 6:. Differentially bound sites of downstream TFs in iA or iN neurons overlap with Ascl1 or Neurog2 binding.
a-c, A subset of differentially enriched Brn2 (a), Ebf2 (b), Onecut2 (c) binding sites in iA or iN neurons at 48h overlap with Ascl1 or Neurog2 differential binding at 48h. d, MEME motif search at the 48h differentially bound Brn2, Ebf2, and Onecut2 sites in iASCL1 neurons (iA>iN) that overlap with differentially bound Ascl1 sites (A>N) with CAGSTG motif. Note that the cognate motif of downstream TFs is present and Ascl1-preferred E-boxes are depleted in the motif distribution graphs centered on downstream TF motifs. The E-values are reported by MEME, and represent an estimate of the expected number of motifs with the same log likelihood ratio that one would find in a similarly sized set of random sequences. e. MEME motif search at the 48h differentially bound Brn2, Ebf2, and Onecut2 sites in iNEUROG2 neurons (iN>iA) that overlap with differentially bound Neurog2 sites (N>A) with CAKATG motif.
Fig. 7:
Fig. 7:. Associations between genomic binding sites and gene expression.
a, Heatmap representing the associations (ratio between the genes overlapped by Ascl1 or Neurog2 peaks versus random peaks: overlapping genes overrepresentation) between 12h Ascl1 and Neurog2 binding with 12h gene expression. b, Heatmap representing the associations between 12h Ascl1 and Neurog2 sites that were previously accessible (green) or inaccessible (red) with 12h gene expression. c, Heatmap representing the associations between 48h Ascl1 and Neurog2 binding with 48h gene expression. d, Heatmap representing the associations between 48h Brn2 (top), Ebf2 (middle), Onecut2 (bottom) binding in iA and iN neurons with 48h gene expression in iA and iN neurons. For all panels: the number of genes that overlap with specific binding classes are listed inside the squares.

References

    1. Bertrand N, Castro DS & Guillemot F Proneural genes and the specification of neural cell types. Nat. Rev. Neurosci 3, 517–530 (2002). - PubMed
    1. Guillemot F & Hassan BA Beyond proneural: emerging functions and regulations of proneural proteins. Curr. Opin. Neurobiol 42, 93–101 (2017). - PubMed
    1. Urbán N & Guillemot F Neurogenesis in the embryonic and adult brain: same regulators, different roles. Front Cell Neurosci 8, 396 (2014). - PMC - PubMed
    1. Schuurmans C & Guillemot F Molecular mechanisms underlying cell fate specification in the developing telencephalon. Curr. Opin. Neurobiol 12, 26–34 (2002). - PubMed
    1. Parras CM et al. Divergent functions of the proneural genes Mash1 and Ngn2 in the specification of neuronal subtype identity. Genes Dev. 16, 324–338 (2002). - PMC - PubMed

Publication types

Substances