. 2019 Jul;3(7):520-531.
doi: 10.1038/s41551-019-0397-0. Epub 2019 May 13.

A complex human gut microbiome cultured in an anaerobic intestine-on-a-chip

Affiliations

A complex human gut microbiome cultured in an anaerobic intestine-on-a-chip

Sasan Jalili-Firoozinezhad et al. Nat Biomed Eng. 2019 Jul.

Erratum in

Abstract

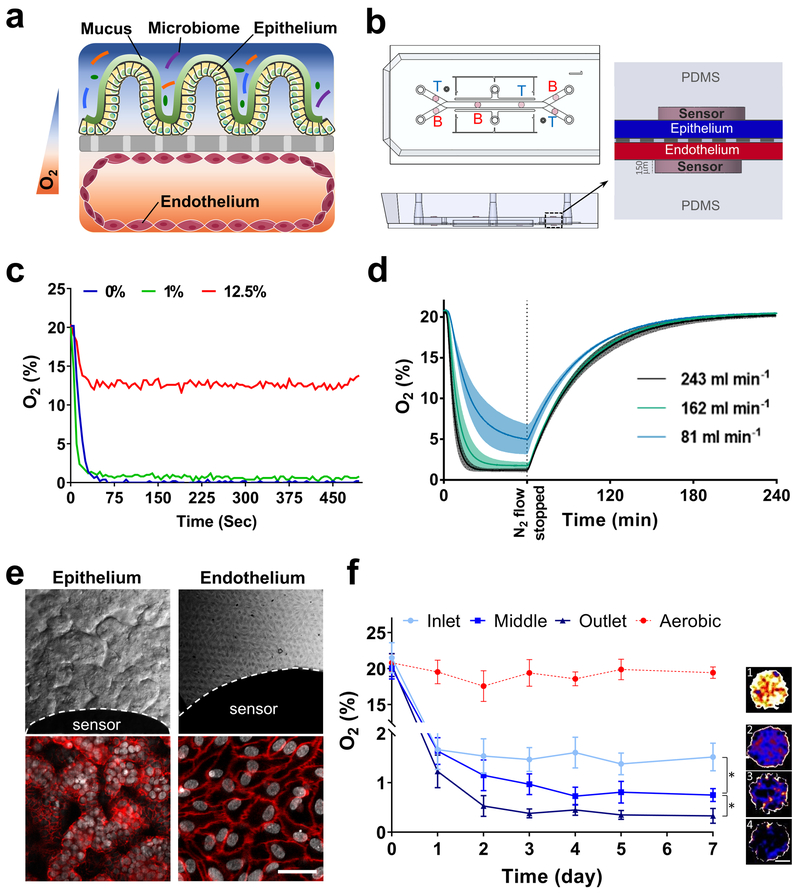
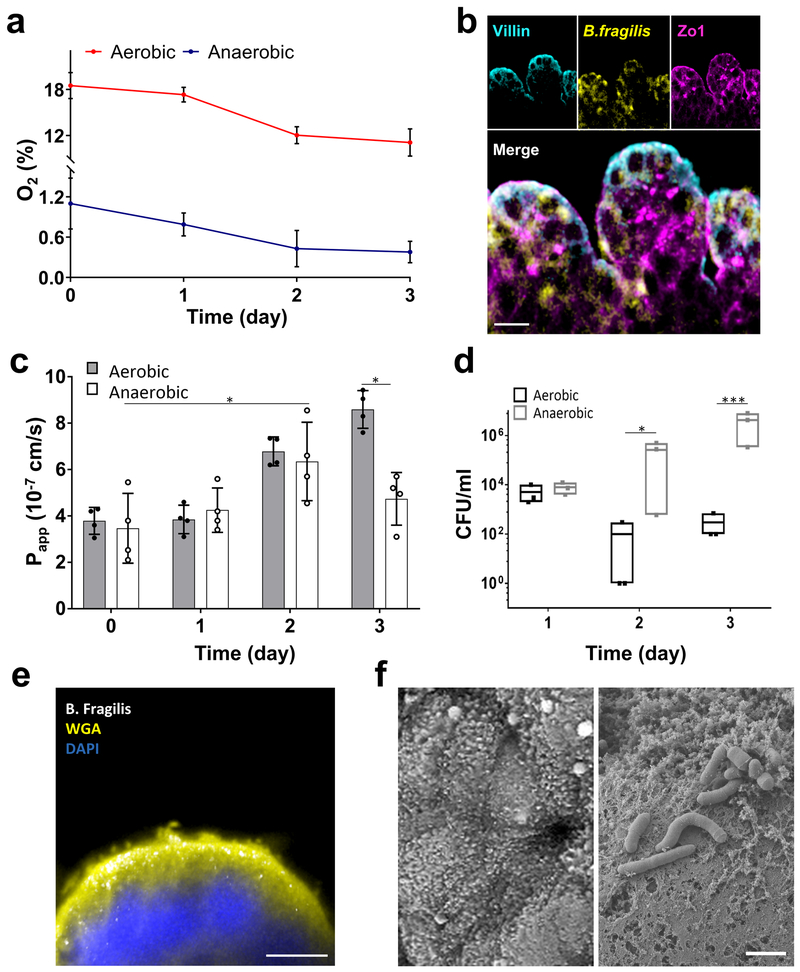
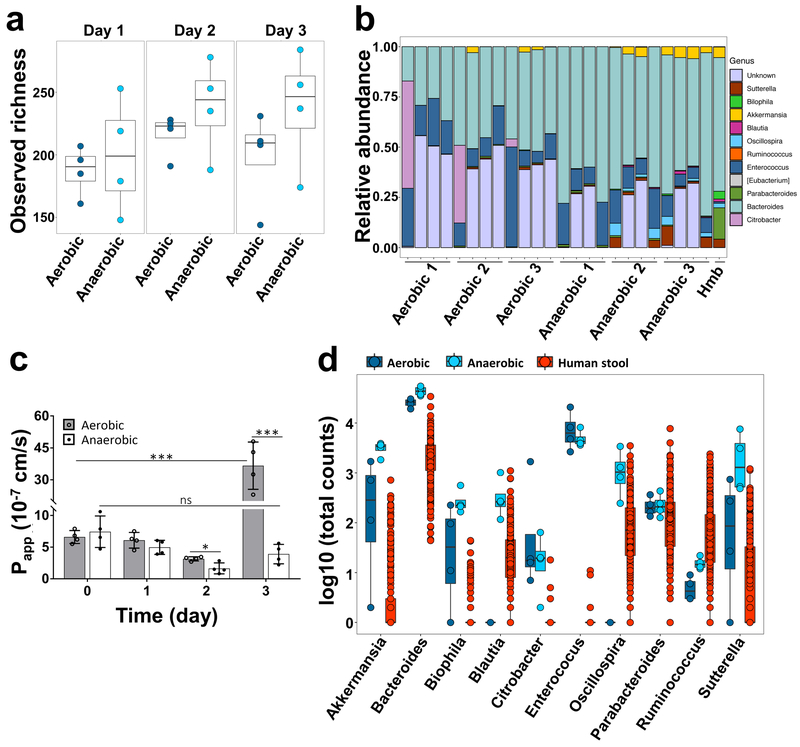
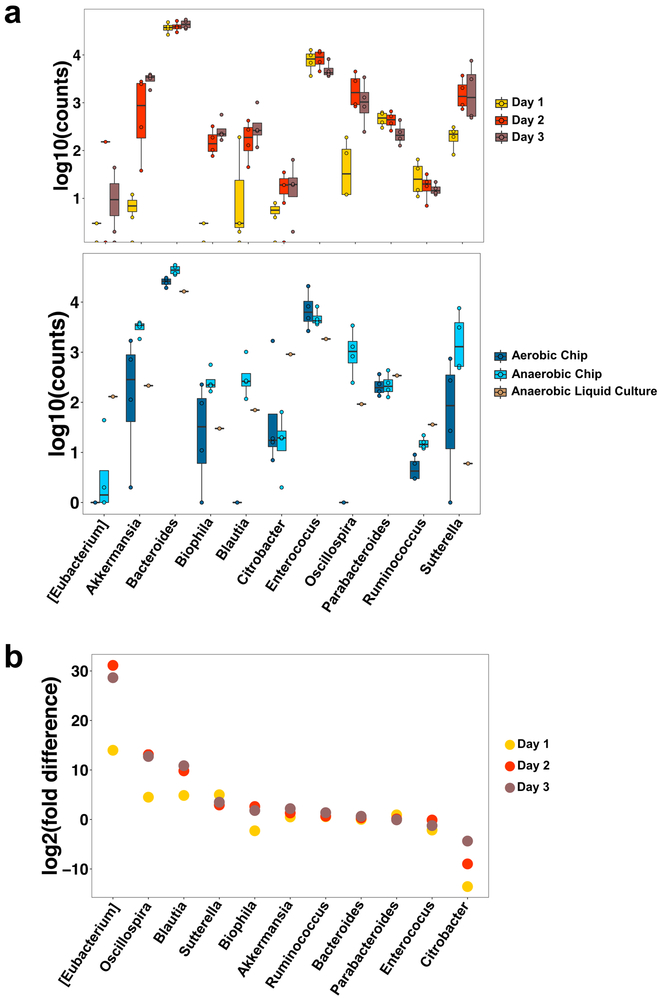
The diverse bacterial populations that comprise the commensal microbiome of the human intestine play a central role in health and disease. A method that sustains complex microbial communities in direct contact with living human intestinal cells and their overlying mucus layer in vitro would thus enable the investigation of host-microbiome interactions. Here, we show the extended coculture of living human intestinal epithelium with stable communities of aerobic and anaerobic human gut microbiota, using a microfluidic intestine-on-a-chip that permits the control and real-time assessment of physiologically relevant oxygen gradients. When compared to aerobic coculture conditions, the establishment of a transluminal hypoxia gradient in the chip increased intestinal barrier function and sustained a physiologically relevant level of microbial diversity, consisting of over 200 unique operational taxonomic units from 11 different genera and an abundance of obligate anaerobic bacteria, with ratios of Firmicutes and Bacteroidetes similar to those observed in human faeces. The intestine-on-a-chip may serve as a discovery tool for the development of microbiome-related therapeutics, probiotics and nutraceuticals.


Figures

Fig. 1 ∣
Fig. 1 ∣. Oxygen sensitive human Intestine Chip microfluidic culture device.
a, Schematic showing the position of the human intestinal epithelium overlaid with its own mucus layer and complex gut microbiota on top, with vascular endothelium on bottom side of the same ECM-coated porous membrane, within a 2-channel microfluidic Organ Chip device in presence of oxygen gradients. Orange and blue colors indicated high and low levels of oxygen concentration, respectively. b, Schematic representation of the Intestine Chip with 6 oxygen quenched fluorescent particles embed in inlet, middle and outlet of top and bottom channels. (T, top channel; B, bottom channel). c, Sensitivity analysis of oxygen spots located in the Intestine Chip in response to defined, standard oxygen concentrations. d, Anaerobic chamber validation at various N2 inflow pressures; N2 was introduced into the chamber at 81 mL min−1, 162 mL min−1, or 243 mL min−1 for 1 h before gas flow was stopped and the chamber was allowed to recover (n=3, shaded regions indicate standard deviation; data are presented as mean ± s.d.). e, Microscopic views showing the villus morphology of the human Caco-2 intestinal epithelium (top left; scale bar, 100 μm) and vascular endothelium (top right; scale bar, 100 μm) cultured for 6 days in the Intestine Chip under anaerobic conditions, when viewed from above by DIC and phase contrast imaging, respectively, or by immunofluorescence staining for the tight junction protein, ZO-1 (red, bottom left; scale bar, 100 μm) and endothelial cell junction-associated protein, VE-cadherin (red, bottom right; scale bar, 20 μm). Gray indicates DAPI-stained nuclei; white dashed lines indicate the border of the oxygen sensor spot). f, Oxygen concentration profiles within aerobically- and anaerobically-cultured Intestine Chips. Representative pseudocolor insets indicate average oxygen concentration in aerobic chip (1), and inlet (2), middle (3) and outlet (4) of the anaerobically-cultured epithelium channel, at day 7 of culture. Scale bar, 200 μm. (n=3 individual chips; data are presented as mean ± s.d.; significance was calculated by one-way analysis of variance; *P = 0.046).
Fig. 2 ∣
Fig. 2 ∣. Co-culture of human intestinal epithelium and obligate anaerobe, Bacteroides fragilis, on-chip.
a, Oxygen concentration profiles in aerobic and anaerobic Intestine Chips co-cultured with Bacteroides fragilis (n=4 individual chips; data are presented as mean ± s.d.). b, Representative vertical cross-sectional, confocal micrographic views through the intestinal epithelium-microbiome interface within the Intestine Chip cultured under anaerobic conditions, when immunostained for villin (cyan), ZO-1 (magenta) and nuclei with DAPI (blue). (scale bar, 50 μm; B. fragilis was HADA (yellow) labelled; representative images from 4 intestine chips are shown). c, Changes in apparent paracellular permeability (Papp) measured by quantitating cascade blue transport across the tissue-tissue interface within the Intestine Chip microdevices co-cultured with Bacteroides fragilis under aerobic and anaerobic conditions (n=4 individual chips; data are presented as mean ± s.d.; significance was calculated by one-way analysis of variance; *P = 0.042 and 0.033 for anaerobic day 2 vs. day 0 and aerobic vs. anaerobic day 3, respectively). d, CFU counts/mL of Bacteroides fragilis co-cultured in the Intestine Chip under aerobic and anaerobic conditions (n=3 individual chips; data are presented as mean ± s.d.; significance was calculated by one-way analysis of variance; *P = 0.031 for day 2 and ***P<0.001 for day 3). e, Cross-sectional fluorescence microscopic view of the Caco2 epithelium (nuclei stained in blue with DAPI), overlying mucus layer stained with Alexa Fluor 488-conjugated WGA (yellow), and B. fragilis bacteria (GalCCP labelled, white) when co-cultured in the Intestine Chip. Scale bar, 10 μm. f, SEM views of the apical surface of the Caco2 epithelium in the Intestine Chip comparing the morphology on day 4 of culture before it accumulates a mucus layer and when the surface microvilli are visible (top) versus when Bacteroides fragilis have been added on day 12 after the mucus layer has accumulated, which can be seen as a dense mat that separates the bacteria from the epithelial cell surface (bottom). Scale bar, 2 μm.
Fig. 3 ∣
Fig. 3 ∣. Analysis of the diversity and relative abundance of microbiota co-cultured in Intestine Chips under aerobic and aerobic conditions.
a, Observed alpha diversity (richness) in our complex gut microbiome samples when cultured for 1 to 3 days in direct contact with human Caco2 intestinal epithelium (each data point represents one Intestine Chip). b, Relative abundance of genera measured across all samples highlighting changes in the abundance of the different genera observed over time. Data points represent each of the 3 replicates cultured under aerobic or anaerobic conditions at 0, 1, 2 or 3 days of culture (left to right, respectively); Hmb indicates genera abundance in the complex microbiome stock at time 0. c, Changes in apparent paracellular permeability (Papp) measured by quantifying cascade blue transport across the tissue-tissue interface within the Intestine Chip after co-culture with complex gut microbiome under aerobic and anaerobic conditions (n=4 individual chips; data are presented as mean ± s.d.; significance was calculated by one-way analysis of variance; *P = 0.048, ***P<0.001, ns = not significant). d, Differences in microbial abundance between Intestine Chip samples (dark blue: aerobic; light blue: anaerobic) and human microbiome stool sample from the Human Microbiome Project (red). Data are shown as log10 of the total number of reads; each data point corresponds to a single sample (error bars represent the s.d.; data are presented as box plots with individual data points overlaid, where lower or upper edges of the box represent 25th or 75th percentiles and the middle bar is the median).
Fig. 4 ∣
Fig. 4 ∣. Anaerobic conditions in the Intestine Chip enhance the growth of multiple genera compared to the aerobic chip and conventional liquid culture.
a, Differential abundance bacterial genera in the Caco2 Intestine Chip measured under anaerobic conditions over 3 days of culture (top), or at day 3 in the anaerobic chip compared to the aerobic chip or anaerobic liquid culture (bottom). Data are presented as log10 of the total read counts for each genus; each data point represents one chip.The total read counts for all genera at the bottom are normalized to their counts in liquid culture (data are presented as box plots with individual data points overlaid, where lower or upper edges of the box represent 25th or 75th percentiles and the middle bar is the median). b, Differential abundance in bacterial genera measured over 1 to 3 days of co-culture in the anaerobic versus aerobic Intestine Chip (data are represented as log2 fold change; each data point corresponds to the differential abundance for a given genus at a given day, comparing anaerobic to aerobic cultures; n=4 chips for each group on each day; error bars represent the s.d.).
Fig. 5 ∣
Fig. 5 ∣. Anaerobic co-culture of gut microbiome obtained from fresh human patient-derived stool with primary human ileal epithelium in the Intestine Chip.
a, Microscopic views showing the villus morphology of the primary ileal epithelium cultured for 5 days in the Intestine Chip under anaerobic conditions when viewed from above by DIC (scale bar, 50μm) or b, shown in cross-section by confocal immunofluorescence imaging for MUC2 (red), F-actin (yellow) and DAPI (blue) (scale bar, 50μm; inset shows area highlighted in white dashed line at higher magnification; representative images from 4 intestine chips are shown). c, Changes in apparent paracellular permeability (Papp) measured by quantifying cascade blue transport across the tissue interface within the primary Intestine Chip during co-culture with or without complex human gut microbiome under anaerobic conditions (bacteria contained with patient-derived stool samples were added on day 0; n=3 individual chips; data are presented as mean ± s.d.). For richness and Shannon diversity of bacteria in effluent samples of primary Intestine Chips refer to Supplementary Table S2.

Comment in

References

    1. Cho I & Blaser MJ The human microbiome: at the interface of health and disease. Nat. Rev. Genet. 13, 260 (2012). - PMC - PubMed
    1. Donaldson GP, Lee SM & Mazmanian SK Gut biogeography of the bacterial microbiota. Nat. Rev. Microbiol. 14, 20–32 (2016). - PMC - PubMed
    1. Pickard JM, Zeng MY, Caruso R & Núñez G Gut microbiota: Role in pathogen colonization, immune responses, and inflammatory disease. Immunol. Rev. 279, 70–89 (2017). - PMC - PubMed
    1. Sommer F & Bäckhed F The gut microbiota — masters of host development and physiology. Nat. Rev. Microbiol. 11, 227 (2013). - PubMed
    1. Walter J & Ley R The human gut microbiome: ecology and recent evolutionary changes. Annu. Rev. Microbiol. 65, 411–429 (2011). - PubMed

Publication types

MeSH terms

LinkOut - more resources