. 2019 Jun;570(7759):77-82.
doi: 10.1038/s41586-019-1184-5. Epub 2019 May 13.

Molecular recording of mammalian embryogenesis

Affiliations

Molecular recording of mammalian embryogenesis

Michelle M Chan et al. Nature. 2019 Jun.

Abstract

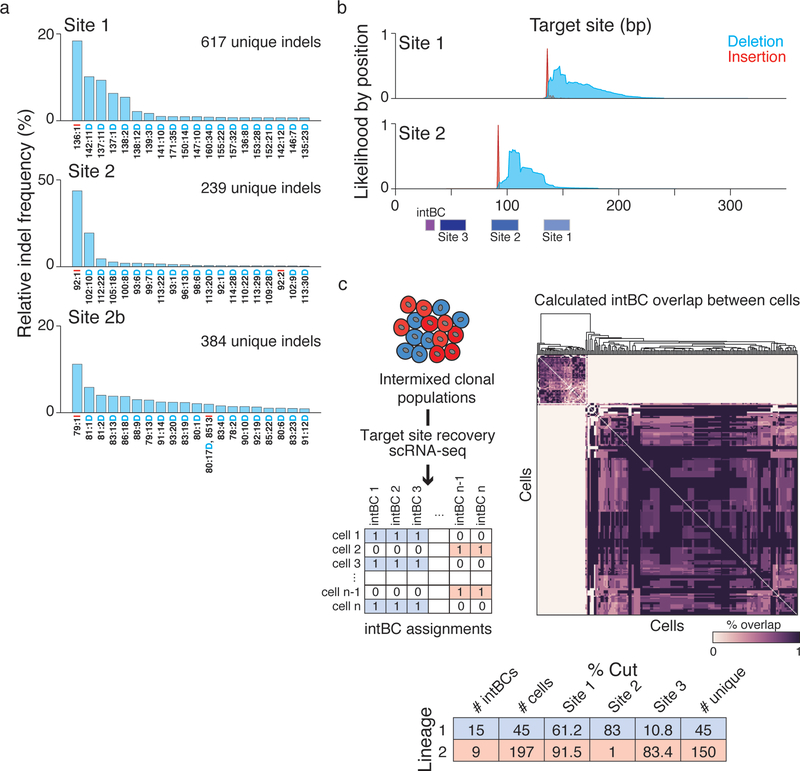
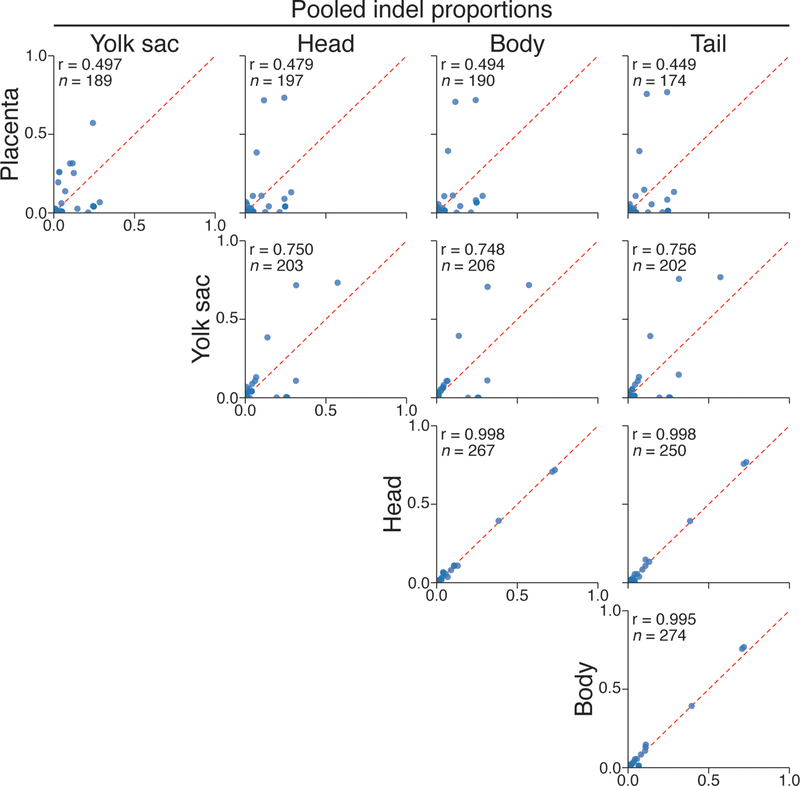
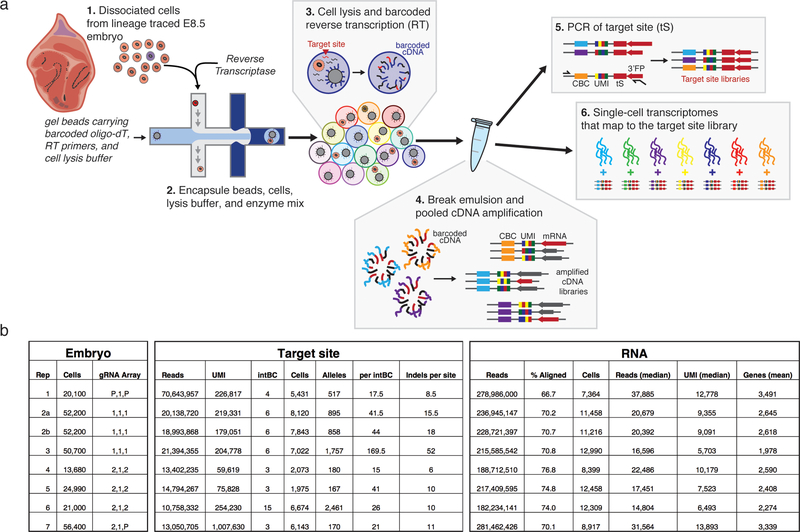
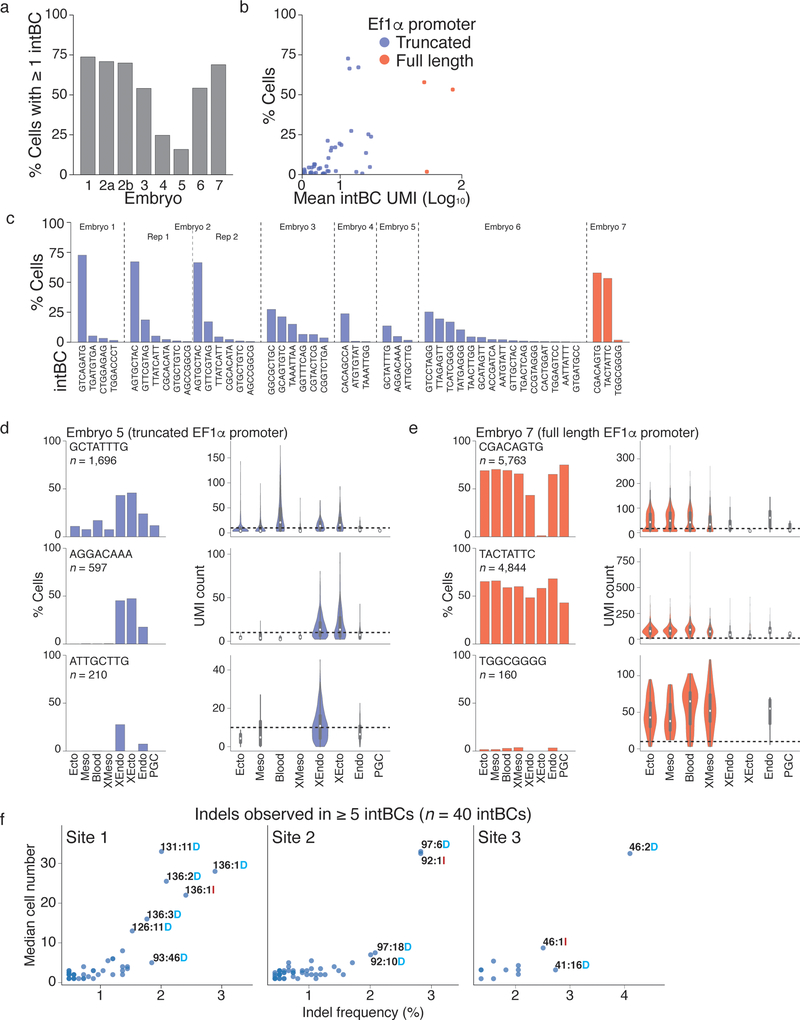
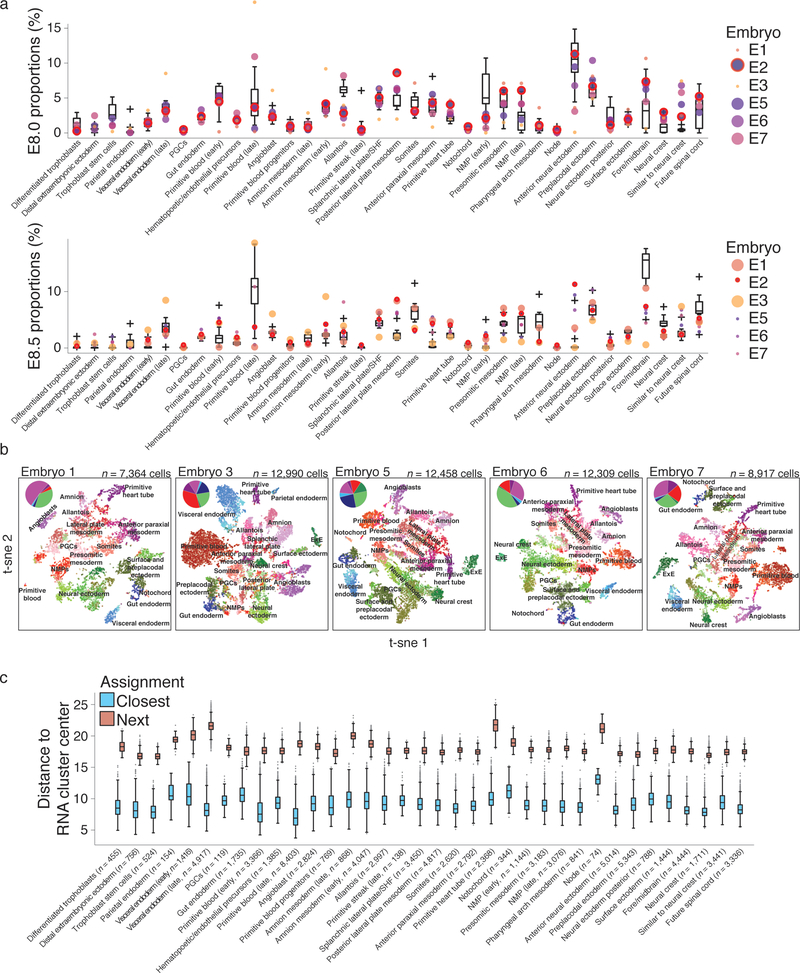
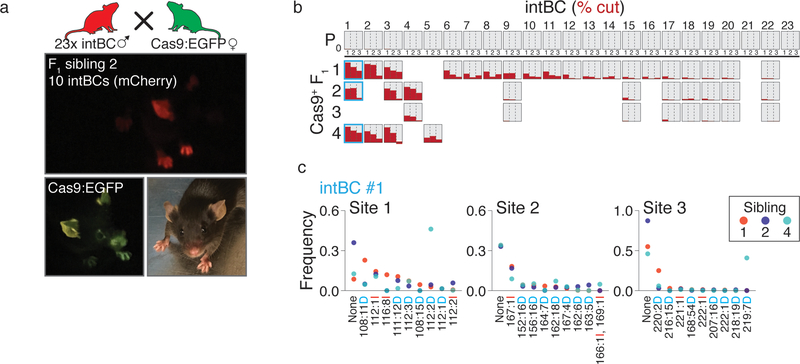
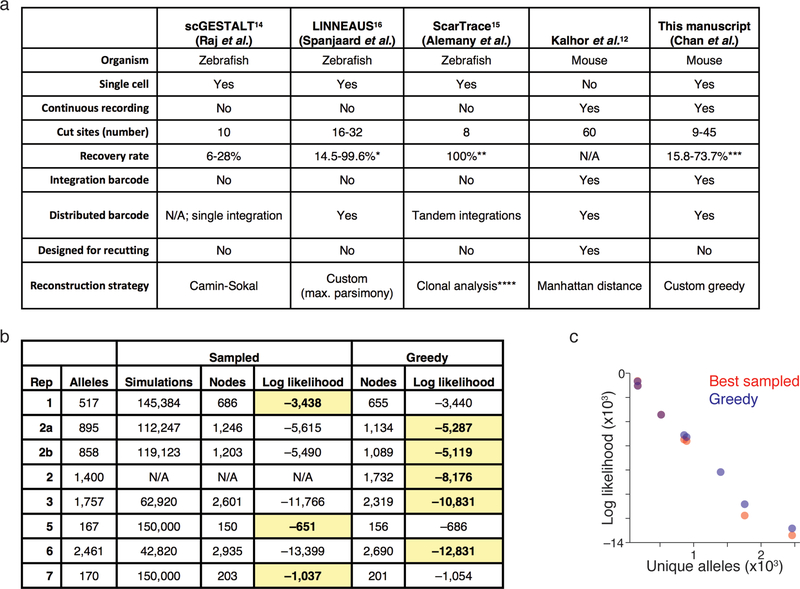
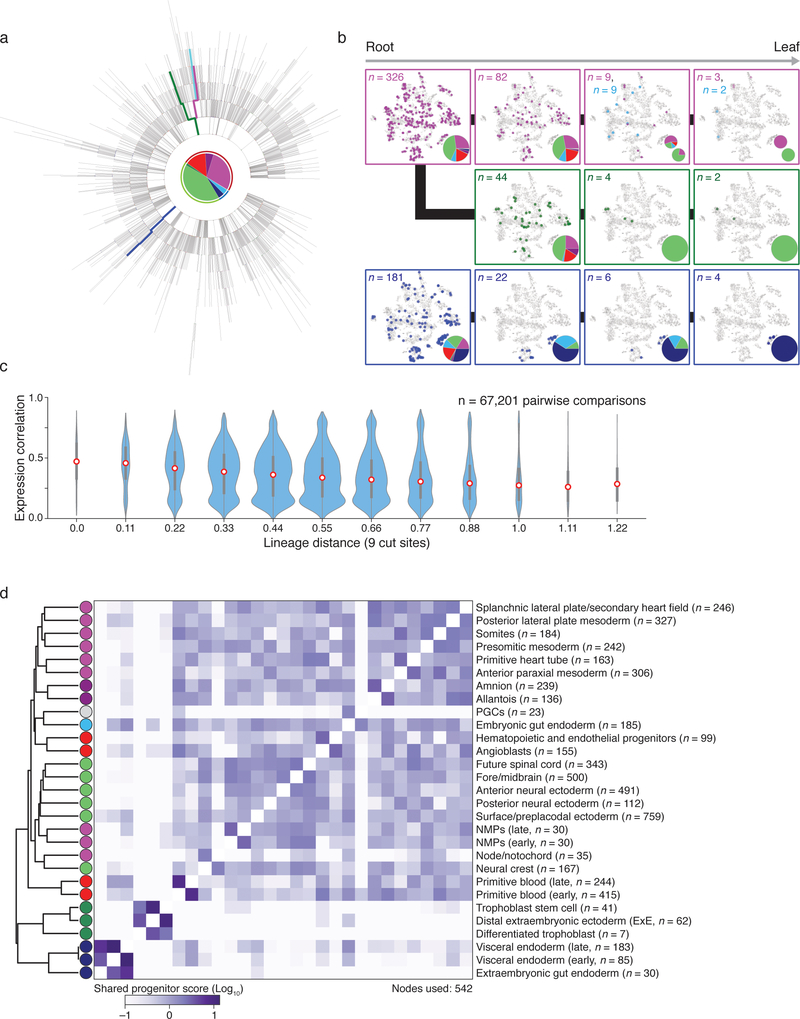
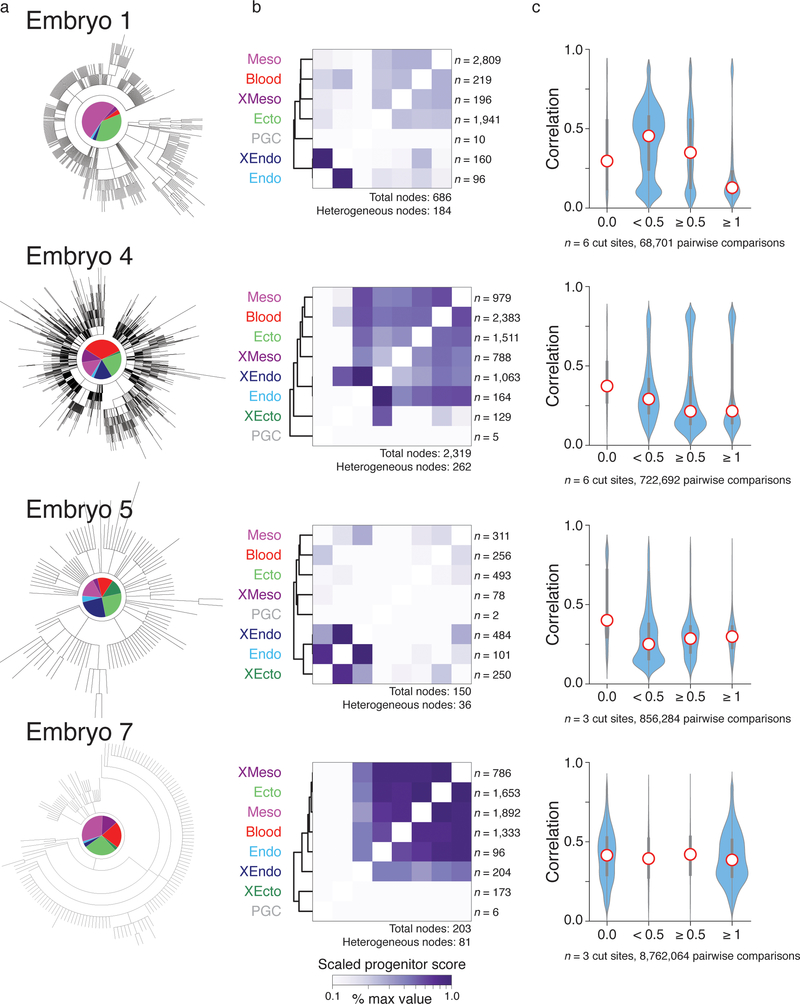
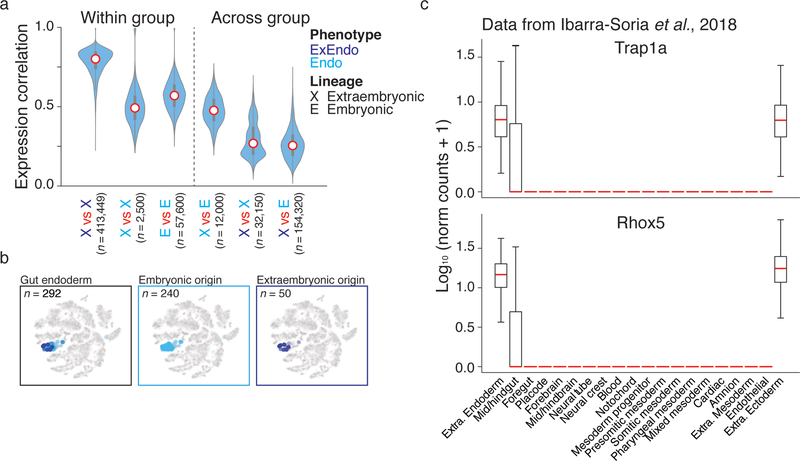
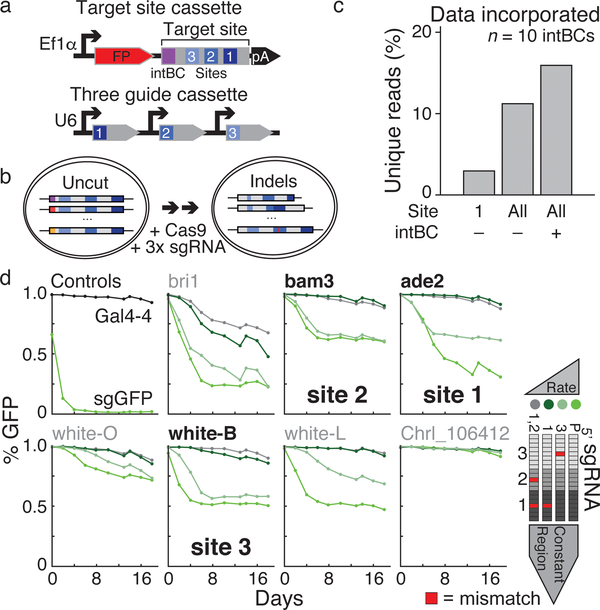
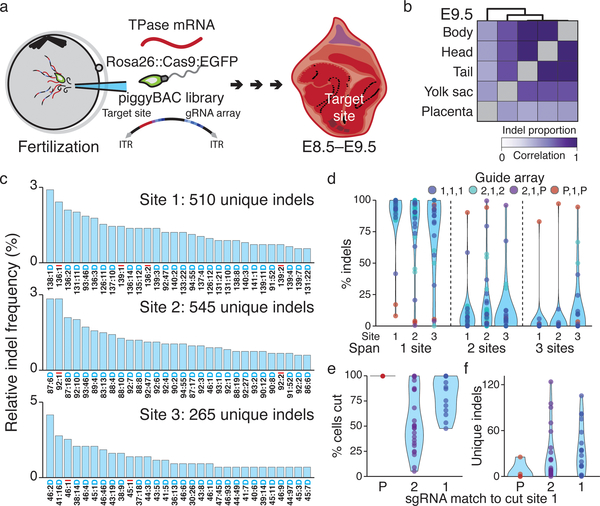
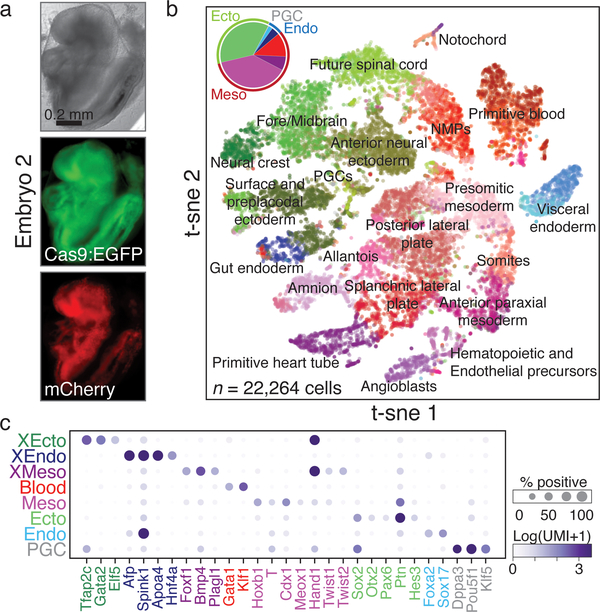
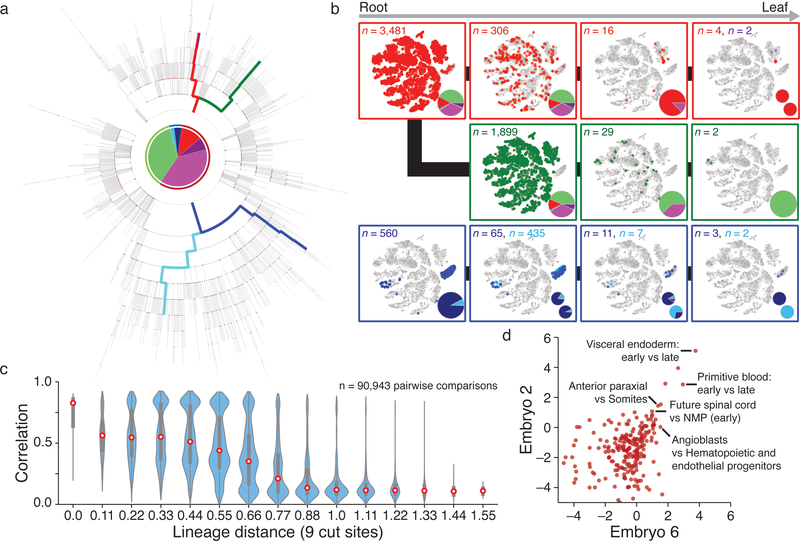
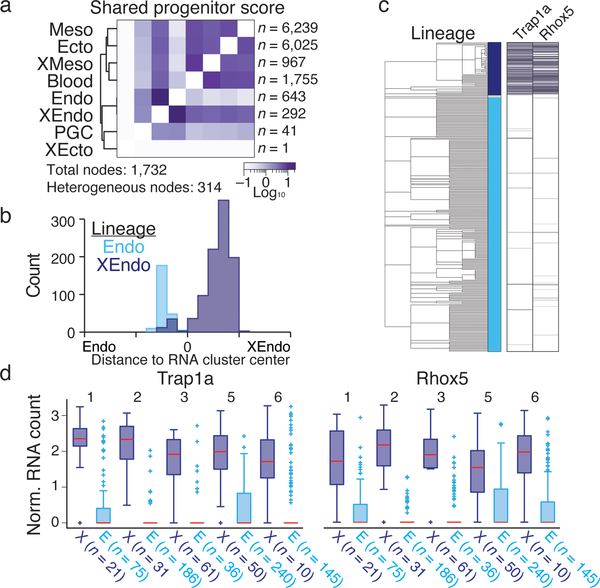
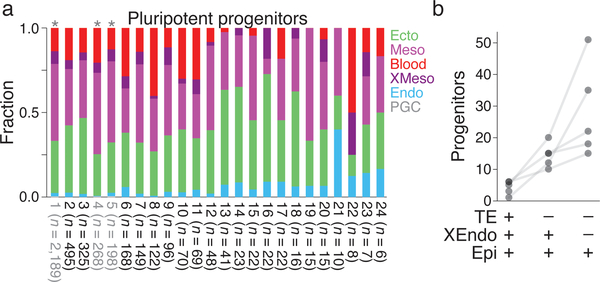
Ontogeny describes the emergence of complex multicellular organisms from single totipotent cells. This field is particularly challenging in mammals, owing to the indeterminate relationship between self-renewal and differentiation, variation in progenitor field sizes, and internal gestation in these animals. Here we present a flexible, high-information, multi-channel molecular recorder with a single-cell readout and apply it as an evolving lineage tracer to assemble mouse cell-fate maps from fertilization through gastrulation. By combining lineage information with single-cell RNA sequencing profiles, we recapitulate canonical developmental relationships between different tissue types and reveal the nearly complete transcriptional convergence of endodermal cells of extra-embryonic and embryonic origins. Finally, we apply our cell-fate maps to estimate the number of embryonic progenitor cells and their degree of asymmetric partitioning during specification. Our approach enables massively parallel, high-resolution recording of lineage and other information in mammalian systems, which will facilitate the construction of a quantitative framework for understanding developmental processes.


Conflict of interest statement

The authors declare no competing interests.

Figures

Extended Data Figure 1:
Extended Data Figure 1:. Target site indel likelihoods from in vitro experiments
a. Histograms for the relative indel frequency for protospacer sites 1, 2, and 2b within the target region. In this experiment, single guide RNA expressing vectors respective to each position were delivered into K562 cells. Repair outcomes and frequencies are different for each site, but every site produces hundreds of discrete outcomes. The top 20 most frequent indels for each site are shown. The indel code along the x-axis is as follows: “Alignment Coordinate: Indel Size Indel type (Insertion or Deletion).” Site 3 was not profiled in this experiment. b. Histograms representing the likelihood that any specific base in the target site is deleted (blue) or has an insertion (red) which begins at that position, for sites 1 and 2, respectively. The position of the integration barcode (intBC) and protospacer sequences (sites) within the target site is represented as a schematic along the bottom, with the PAM for each site proximal to the intBC. Indels, specifically insertions, start at the double strand break point 3-bases upstream of the PAM sequence. c. Simultaneous and continuous molecular recording of multiple clonal populations in K562 cells. We transduced K563 cells with a high complexity library of unique intBCs, sorted them into wells of 10 cells each and propagated them for 18 days. At the end of the experiment, we detected two populations by their intBCs, implying that only two clonal lineages expanded from the initial population of 10, and confirmed generation of target site mutations. (Left) Strategy for partitioning a multi-clonal population into their clonal populations. Target sites are amplified from a single cell barcoded cDNA library and the intBCs in each cell is identified as present or absent. (Middle) Heatmap of the percent overlap of intBCs between all cells. The cells segregate into two populations representing the descendants of two progenitor cells from the beginning of the experiment. (Right) Table summarizing results of the experiment, including the generation of indels over the experiment duration. These data additionally showcase our ability to combine dynamic recording with tracing based on traditional static barcodes.
Extended Data Figure 2:
Extended Data Figure 2:. Capturing early differentiation by pooled sequencing of indels generated within an E9.5 embryo
Scatterplots of indel proportions from dissected, bulk tissue of an E9.5 embryo. Placenta is the most distantly related from embryonic tissues, followed by the yolk sac, with the three embryonic compartments sharing the highest similarity.
Extended Data Figure 3:
Extended Data Figure 3:. Experimental overview
a. Schematic of platform used for generation of single cell RNA-seq libraries and corresponding target site amplicon libraries, adapted from Adamson et al., 2016 (Ref 18). The barcoded and amplified cDNA library is split into two fractions prior to shearing: one fraction is used to generate a global transcription profile and the other is used to specifically amplify the target site. b. Summary table of lineage traced embryos detailing the type of guides used, the sampling proportion, and sequencing results. Embryo 4 was omitted from further analysis due to the absence of cells identified as primitive heart tube.
Extended Data Figure 4:
Extended Data Figure 4:. Target site capture in mouse embryos
a. Percentage of cells with at least one target site captured. b. Scatterplot showing the relationship between the mean number of unique molecular identifiers (UMIs, a proxy for expression level) sequenced per target site and the percentage of cells in which the target site is detected, which we refer to as “target site capture.” Generally, as the mean number of UMIs increases, the percentage of cells also increases. Using a fullx length, intron-containing Ef1a promoter in mouse embryos leads to a higher number of UMIs, which generally results in better target site capture. c. Percent of cells for which a given integration barcode (intBC) is detected across all seven embryos profiled in this study. d. Target site capture and expression level across tissues for Embryo 5, which utilizes a truncated Ef1a promoter to direct transcription of the target site. Each row corresponds to a different intBC, indicated in the top left of the histogram. (Left) The percentage of cells in each tissue for which the target site is captured. (Right) Violin plots represented the distribution of UMIs for the target site in each tissue. Dashed line refers to a 10 UMI threshold. The target site may be expressed at different levels in a tissue-specific manner, leading to higher likelihoods of capture in certain tissues. Examples such as the target sequences carrying the intBCs AGGACAAA and ATTGCTTG may also be explained by mosaic integration after the first cell cycle, as these follow a developmental logic and are preferentially expressed in extraembryonic tissues. White dot indicates the median UMI count for cells from a given germ layer, edges the interquartile range, and whiskers the full range of the data. e. Target site capture and expression level across tissues for embryo 7, which drives the target site expression from a full length Ef1a promoter. Each row corresponds to a different intBC, indicated in the top left of the histogram. (Left) The percentage of cells in each tissue for which the target site is captured. (Right) Violin plots represented the distribution of UMIs for the target site in each tissue as in d. Dashed line is a visual threshold for 10 UMIs. While tissue specific expression may explain some discrepancy in target site capture, high expression (as estimated from number of UMIs) may still correspond to low capture rates, as observed for the intBC TGGCGGGG. One possibility is that certain indels may destabilize the transcript and lead to either poor expression or capture. f. Scatterplots showing the relationship between estimated relative indel frequency and the median number of cells that carry the indel. Since the indel frequency within a mouse is dependent on the timing of the mutation, we cannot calculate the underlying indel frequency distribution using the fraction of cells within embryos that carry a given indel. Instead, we estimate this frequency by the presence or absence of an indel using all of the target site integrations across mice, which reduces biases from cellular expansion but still assumes that any given indel occurs only once in the history of each intBC. Since the number of integrations is small (<50), we might expect our estimates to be poor. Here we see that the number of cells marked with an indel increases with indel frequency, suggesting that our frequency estimates are under-estimated for particularly frequent indels. This is likely due to the fact that we cannot distinguish between identical indels in the same target site that may have resulted from multiple repair outcomes (convergent indels). The most frequent insertions are of a single base and tend to be highly biased towards a single nucleotide (eg. 92:1I is uniformly an “A” in 5 out of 7 embryos and never < 88%).
Extended Data Figure 5:
Extended Data Figure 5:. single cell RNA-seq tissue assignment and wild type comparison
a. Boxplots representing tissue proportions from E8.0 (top) and E8.5 (bottom) wild type embryos (n = 10 each) with lineage-traced embryos mapping to each state overlaid as dots. Wild type embryos display large variance in the proportions of certain tissues and our lineage-traced embryos generally fall within the range of those recovered from wild type. Large circles indicate embryos that were scored as either E8.0 or E8.5, respectively, and the bold red overlay highlights embryo 2, which is used throughout the text. Note that many processes are continuous or ongoing between E8.0 to E8.5, such as somitogenesis and neural development. For example, from E8.0 to E8.5, the embryonic proportions of anterior neural ectoderm and fore/midbrain are inversely correlated as one cell type presumably matures into the other. Many of our embryos scored as E8.0 exhibit intermediate proportions for both tissue types, supporting the possibility that these embryos are somewhat less developed than E8.5 but more developed than E8.0. For boxplots, center line indicates the median, edges the interquartile range, whiskers the Tukey Fences, and crosses the outliers. b. Plots (t-sne) of single cell RNA-seq with corresponding tissue annotations for the six lineage traced embryos used in this study. (Inset) Pie chart of the relative proportions for different germ layers. Mesoderm is further separated to include blood (red). While 36 different states are observed during this developmental interval, only broad classifications of certain groups (eg. “neural ectoderm” or “lateral plate mesoderm”) are overlaid to provide a frame of reference. In general, the relative spacing and coherence of different cell states are consistent across different embryos. c. Boxplots of the Euclidean distance between single cell transcriptomes and the average transcriptional profile of their assigned cluster (cluster center) in comparison to their distance from the average of the next closest possible assignment. Comparison is to the same 712 informative marker genes used to assign cells to states and includes all cells used in this study. Middle bar highlights the median, edges the interquartile range, whiskers the Tukey Fences, and grey dots the outliers. N’s refer to the cumulative number of cells assigned to each state across all 7 embryos for which single cell data was collected, including for embryo 4.
Extended Data Figure 6:
Extended Data Figure 6:. Continuous indel generation by breeding
a. Strategy for generating lineage traced mice through breeding. The target site and guide array cassette are integrated into mouse zygotes as in Figure 2a using C57Bl/6J sperm to generate P0 breeder mice, which are capable of transmitting high copy genomic integrations of the technology. Then, P0 animals are crossed with homozygous, constitutively expressing Cas9 transgenic animals to enable continuous cutting from fertilization onwards in F1 progeny. Shown is Sibling 2 of a cross between a P0 male and a Cas9:EGFP female. b. Bar charts showing the degree of mutation (% cut, red) for a P0 male (top row) and 4 F1 offspring generated by breeding with a Cas9:EGFP female prior to weaning (21 days post partum). Each row represents a mouse and each column represents a target site. Each sibling inherits its own subset of the 23 parental target site integrations, and demonstrates different levels of mutation throughout gestation and maturation. c. Indel frequencies for the 10 most frequent indels from 3 siblings in a common target site integration (column 1 in b). Each mouse shows a large diversity of indels and the different frequencies observed in each animal demonstrates an independent mutational path.
Extended Data Figure 7:
Extended Data Figure 7:. Performance of tree building algorithms used on embryonic data
a. Table summarizing contemporary Cas9-based lineage tracers that have been applied to vertebrate development highlighting attributes that differ between the studies. Refer to Methods for a more detailed overview of key characteristics of our technology. * Study reports the average fraction recovered by tissue for integrations that cannot be distinguished, such that percentages reported here are effectively equivalent to our “≥1 intBC” metric. ** Reports a plate-based DNA-sequencing approach that can be applied to all methods to improve target site recovery. *** Range of cells where at least one intBC is confidently detected and scored. **** Presents a tree reconstruction method, but results predominantly on clonal analysis. b. Table of allele complexity, number of nodes, and log-likelihood scores for embryos. Tree likelihoods are calculated using indel frequencies estimated from all embryo data (see Extended Data Figure 5 and Methods). Bold scores indicate the reconstruction algorithm selected for each embryo (see Figure 4, and Extended Data Figures 8 and 9). c. Log likelihood of trees generated using either the greedy or biased sampling approach as a function of complexity, which is measured as the number of unique alleles. There is near equivalent performance of the two algorithms for low complexity embryos, but the greedy algorithm produces higher likelihood trees for embryos with larger numbers of unique alleles.
Extended Data Figure 8:
Extended Data Figure 8:. Single cell lineage reconstruction of early mouse development for embryo 6
a. Reconstructed lineage tree comprised of 2,690 nodes generated from our most information-dense embryo (embryo 6), which we used to compare shared progenitor scores with embryo 2 in Figure 4d. Each branch represents an independent indel generation event, and each node contains a pie chart of the germ layer proportions for the cells contained within it (colors are as in Figure 3b). b. Example paths from root to leaf from the selected tree (highlighted by color). Cells for each node in the path are overlaid onto the t-sne representation in Extended Data Figure 5, with the tissue proportion at each node in the tree included as a pie chart. In the top most path (pink), the lineage bifurcates into two independently fated progenitors that either generate mesoderm (secondary heart field/splanchnic plate mesoderm and primitive heart tube) or neural ectoderm (anterior neural ectoderm and neural crest). Note that the middle path (green) also represents an earlier bifurcation from the same tree and eventually produces neural ectoderm (neural crest and future spinal cord). These paths begin with a pluripotent node that can generate visceral endoderm but subsequently lose this potential. Alternatively, the bottom path (dark blue) begins in an equivalently pluripotent state but becomes restricted towards the extraembryonic visceral endoderm fate. c. Violin plots representing the relationship between lineage and expression for individual pairs of cells as calculated for embryo 2 in Figure 4c. Expression Pearson correlation decreases with increasing lineage distance, showing that closely related cells are more likely to share function. Red dot highlights the median, edges the interquartile range, and whiskers the full range. d. Comprehensive clustering of shared progenitor scores for Embryo 6, which has the greatest number of unique alleles and samples multiple extraembryonic tissues. Shared progenitor score is calculated as the sum of shared nodes between cells from two tissues normalized by the number of additional tissues that are also produced (a shared progenitor score is calculated as 2−(n−1) where n is the number of clusters present within that node). In general, extraembryonic tissues that are specified before implantation, such as extraembryonic endoderm or ectoderm, co-cluster away from embryonic tissues and within their own groups, while the amnion and allantois of the extraembryonic mesoderm cluster with other mesodermal products of the posterior primitive streak. The co-clustering of anterior paraxial mesoderm and somites may reflect the continuous nature of somitogenesis from presomitic mesoderm during this period, with production of only the most anterior somites by E8.5. Note that the gut endoderm cluster has been further portioned according to embryonic or extra embryonic lineage (see Figure 5).
Extended Data Figure 9:
Extended Data Figure 9:. Summary of results from additional mouse embryos
Representative highest likelihood tree analyses for additional embryos, including: a. Reconstructed trees as shown in Figure 4a. b. Shared progenitor score heatmaps as shown in Figure 5a, normalized to the highest score for each embryo to account for differences in total node numbers. Here, the shared progenitor score is calculated as the number of nodes that are shared between tissues scaled by the number of number of tissues within each node (a shared score is calculated as 2−(n−1) where n is the number of clusters present within that node). In general, clustering of shared progenitors is recapitulated across embryos, with mesoderm and ectoderm sharing the highest relationship and either extra-embryonic ectoderm or extra-embryonic endoderm representing the most deeply rooted and distinct outgroup, though these scores are sensitive to the number of target sites and the rate of cutting. By shared progenitor, PGCs are also frequently distant from other embryonic tissues, but this often reflects the rarity of these cells, which restricts them to only a few branches of the tree in comparison to more represented germ layers. The number of heterogeneous nodes from which scores are derived is included for each heatmap. c. Violin plots representing the pairwise relationship between lineage distance and transcriptional profile as shown for embryo 2 in Figure 4c. Lineage distance is calculated using a modified Hamming distance and transcriptional similarity by Pearson correlation. The exact dynamic range for lineage distance depends on the number of intBCs included and the cutting rate of the three guide array. Here, distances are binned into perfect (0), close (0 > x >0.5), intermediate ( 0.5 ≤ x < 1), and distant (x ≥ 1) relationships for all cells containing either 3 or 6 cut sites, depending on the embryo. As lineage distance increases, transcriptional similarity decreases, consistent with functional restriction over development. Red dot highlights the median, edges the interquartile range, and whiskers the full range.
Extended Data Figure 10:
Extended Data Figure 10:. Expression characteristics of extra-embryonic and embryonic endoderm
a. Violin plots representing the pairwise scRNA-seq Pearson correlation coefficients for within or across group comparisons according to lineage (X, extra-embryonic; E, embryonic) and cluster assignment (light blue, gut endoderm; dark blue, visceral endoderm). Within group comparisons for cells with the same lineage and transcriptional cluster identity are shown on the left, while across group comparisons are presented on the right. Notably, extraembryonic cells with gut endoderm identities show higher pairwise correlations to embryonic cells with gut endoderm identities (column 4) than they do to visceral endoderm cells, with which they share a closer lineage relationship (column 5). Red dot highlights the median, edges the interquartile range, and whiskers the full range. b. Plots (t-sne) of scRNA-seq data for embryo 2, with gut endoderm cells highlighted. Endoderm cells segregate from the rest of the embryo, and cannot be distinguished by embryonic (light blue) or extraembryonic (dark blue) origin. c. Expression boxplots for the extra-embryonic markers Trap1a and Rhox5 from an independent single cell RNA-seq survey of E8.25 embryos (Ibarra-Soria et al., 2018, Ref ). Both genes are heterogeneously present in cells identified as mid/hindgut but uniformly present in canonical extra-embryonic tissues, consistent with a subpopulation of cells of extra-embryonic origin residing within this otherwise embryonic cluster. Red lines highlights the median, edges the interquartile range, and whiskers the Tukey Fence. Outliers were removed for clarity.
Figure 1:
Figure 1:. Optimization of a multi-purpose molecular recorder
a. Target site (top) and three guide (bottom) cassettes. The target site consists of an integration barcode (intBC) and three cut sites for Cas9-based recording. Three different single guide RNAs (sgRNAs) are each controlled by independent promoters (in this study, mU6, hU6, and bU6). b. Molecular recording principle. Each cell contains multiple genomic, intBC-distinguishable target site integrations. sgRNAs direct Cas9 to cognate cut sites to generate insertion (red) or deletion mutations. Here, Cas9 is either ectopically delivered or induced by doxycycline. c. Percentage of uniquely marked reads recovered after recording within a K562 line with 10 intBCs for 6 days using the following information: site 1 only with intBCs masked, sites 1–3 (All) with intBCs masked, and sites 1–3 (All) with intBCs considered. Information content scales with number of sites and presence of the intBC. d. sgRNA mismatches alter mutation rate. Seven protospacers were integrated into the coding sequence of a GFP reporter to infer mutation rate by the fraction of positive cells over a 20 day time course. Single or dual mismatches were made in guides according to proximity to the PAM: region 1 (proximal), region 2, and region 3 (distal). Guides against Gal4–4 and the GFP coding sequence act as negative and positive controls. Bold sequences were incorporated into the target site.
Figure 2:
Figure 2:. Lineage tracing in mouse from fertilization through gastrulation
a. Lineage tracing in mouse experiments. The target site (within mCherry’s 3’UTR) and the three guide cassettes are encoded into a single piggyBac transposon vector (ITRs, inverted terminal repeats). The vector, transposase mRNA, and Rosa26::Cas9:EGFP sperm are injected into oocytes to ensure early integration and tracing in all subsequent cells after zygotic genome activation. Transferred embryos are then recovered after gastrulation. b. Pearson correlation coefficient heatmap of indel proportions recovered from bulk tissue of an E9.5 embryo (see also Extended Data Figure 2). c. Indel frequency distribution estimated from 40 independent target sites from all embryos. Each site produces hundreds of outcomes for high information encoding. See Extended Data Figure 4 and Methods for frequency calculation. The indel code along the x-axis is as follows: “Alignment Coordinate: Indel Size Indel type (Insertion or Deletion).” d. Proportion of indels that span one, two, or three sites, shown per site. Each dot denotes one of 40 independent intBCs and sums to one across site-spanning indels. Colors indicate the guide array: P = no mismatches; 1 = mismatch in region 1; 2 = mismatch in region 2. e. Percentage of cells with mutations according to guide complementarity. Indel proportions within one mouse depend on timing: mutations that happen earlier in development are propagated to more cells. Dots represent site 1 measurements from independent intBCs; N = 4, 24, and 18 for P, 2, and 1 region mismatches. f. Indel diversity is inversely related to cutting efficiency for site 1 as in e. Early mutations due to fast cutting are propagated to more cells, leading to smaller numbers of unique indels.
Figure 3:
Figure 3:. Assigning cellular phenotype by scRNA-seq
a. Images of a lineage-traced E8.5 embryo (embryo 2 of 7 for which single cell data was collected, see Extended Data Figure 3), including for Cas9:EGFP and the mCherry:target site. b. t-sne plot of scRNA-seq from embryo in a. Only large or spatially distinct clusters are labeled. (Inset) Pie chart of germ layers. Lighter and darker shades represent embryonic and extra-embryonic components, respectively. Mesoderm is further separated to include blood (red). See Extended Data Figure 5b for additional embryos. c. Dot plot of canonical tissue-specific markers. Grouping clusters of diverse tissue types into germ layers reduces the fraction of marker positive cells, but the specificity to their respective states remains high, especially when considered combinatorially. Size: fraction of marker-positive cells, color intensity: normalized expression (cluster mean). XEcto, extra-embryonic ectoderm/placenta; XEndo, extra-embryonic endoderm/yolk sac; PGC, primordial germ cell; Endo, embryonic endoderm; Ecto, embryonic ectoderm; Meso, embryonic mesoderm; XMeso, extra-embryonic mesoderm.
Figure 4:
Figure 4:. Single cell lineage reconstruction of mouse embryogenesis
a. Reconstructed lineage tree comprised of 1,732 nodes for embryo 2 with three lineages highlighted. Each branch represents an indel generation event. b. Example paths from tree in a highlighted by color. Cells for each node in the path are overlaid onto the plot from Figure 3b, with tissue proportions as a pie chart. Tissue representation decreases with increased tree depth, indicating functional restriction. Bifurcating sublineages are included for the top and bottom paths. In the top (red) path, this bifurcation occurs within the final branch after primitive blood specification. In the bottom (blue) path, bifurcation happens early within bipotent cells that become either gut or visceral endoderm. c. Violin plots of the pairwise relationship between lineage and expression for single cells. Lineage distance uses a modified Hamming distance normalized to the number of shared cut sites. Pearson correlation decreases with increasing lineage distance, showing that closely related cells are more likely to share function. Red dot highlights the median, edges the interquartile range, and whiskers the full range. d. Comparison of shared progenitor scores (log2-transformed) between our two most information-dense embryos (Embryo 2, n = 1,400 alleles; Embryo 6, n = 2,461 alleles). Cells from closely related transcriptional clusters (ex. primitive blood or visceral endoderm, which have early and late states) derive from common progenitors and score as highly related in both embryos. We also observe a close link between mesoderm and ectoderm that may reflect shared heritage between neuromesodermal progenitors (NMPs) and more posterior neural ectodermal tissues, such as the future spinal cord.
Figure 5:
Figure 5:. Disparities between transcriptional identity and lineage history within the extra-embryonic endoderm
a. Shared progenitor score heatmap for embryo 2 reconstructs expected relationships. The number of nodes that include cells from different lineages is highlighted (Heterogeneous nodes). See Extended Data Figure 9 for additional embryos. b. For cells from embryo 2, the relative distance from the mean expression profile of either the endoderm or the extra-embryonic endoderm cluster according to origin (Endo or XEndo). c. Endoderm cell lineage tree from embryo 2 with expression heatmap for two extra-embryonic marker genes. Middle bar indicates lineage: dark blue, extra-embryonic; light blue, embryonic; grey, ambiguous. d. Expression boxplots for Trap1a and Rhox5 confirms consistent differential expression across lineage-traced embryos according to their embryonic or extra-embryonic ancestry. Red line highlights median, edges the interquartile range, whiskers the Tukey Fence, and crosses outliers. N’s, the number of recovered XEndo origin cells of either embryonic (E) or Extraembryonic (X) function per embryo.
Figure 6:
Figure 6:. Lineage bias and estimated size of progenitor pools
a. Relative tissue distribution of cells descended from reconstructed or profiled pluripotent progenitor cells for embryo 2. “Profiled” is a unique lineage identity of multiple cells directly observed in the data. Pluripotent cells form all germ layers, but show asymmetric propensities towards different cell fates, possibly reflecting positional biases. Nodes highlighted in grey with asterisk overlasy give rise to primordial germ cells (lineages 1, 4, and 5 include 9, 1, and 1 PGCs each). Color assignments as in Figures 3. b. Estimated progenitor field sizes for three types of early developmental potency. Totipotent cells give rise to all cells of the developing embryo, including trophectodermal (TE) lineages. Pluripotent progenitors are partitioned into early and late by generation of extra-embryonic endoderm (XEndo) in addition to epiblast (Epi). Dots represent single embryos; solid grey line connects estimates from the same embryo.

Comment in

  • Recording embryogenesis.
    Wrighton KH. Wrighton KH. Nat Rev Genet. 2019 Jul;20(7):373. doi: 10.1038/s41576-019-0141-3. Nat Rev Genet. 2019. PMID: 31114033 No abstract available.
  • Tracing cell fate.
    Wrighton KH. Wrighton KH. Nat Rev Mol Cell Biol. 2019 Aug;20(8):454-455. doi: 10.1038/s41580-019-0148-9. Nat Rev Mol Cell Biol. 2019. PMID: 31114039 No abstract available.

References

    1. Sulston JE, Schierenberg E, White JG & Thomson JN The embryonic cell lineage of the nematode Caenorhabditis elegans. Developmental Biology 100, 64–119 (1983). - PubMed
    1. Pijuan-Sala B, Guibentif C. & Göttgens B. Single-cell transcriptional profiling: a window into embryonic cell-type specification. Nat. Rev. Mol. Cell Biol 19, 399–412 (2018). - PubMed
    1. Zernicka-Goetz M. Patterning of the embryo: the first spatial decisions in the life of a mouse. Development 129, 815–829 (2002). - PubMed
    1. Fincher CT, Wurtzel O, de Hoog T, Kravarik KM & Reddien PW Cell type transcriptome atlas for the planarian Schmidtea mediterranea. Science 360, eaaq1736 (2018). - PMC - PubMed
    1. Plass M. et al. Cell type atlas and lineage tree of a whole complex animal by single-cell transcriptomics. Science 360, eaaq1723 (2018). - PubMed

MeSH terms