. 2019 Jun;16(6):526-532.
doi: 10.1038/s41592-019-0421-z. Epub 2019 May 13.

Bioluminescent-based imaging and quantification of glucose uptake in vivo

Affiliations

Bioluminescent-based imaging and quantification of glucose uptake in vivo

Tamara Maric et al. Nat Methods. 2019 Jun.

Abstract

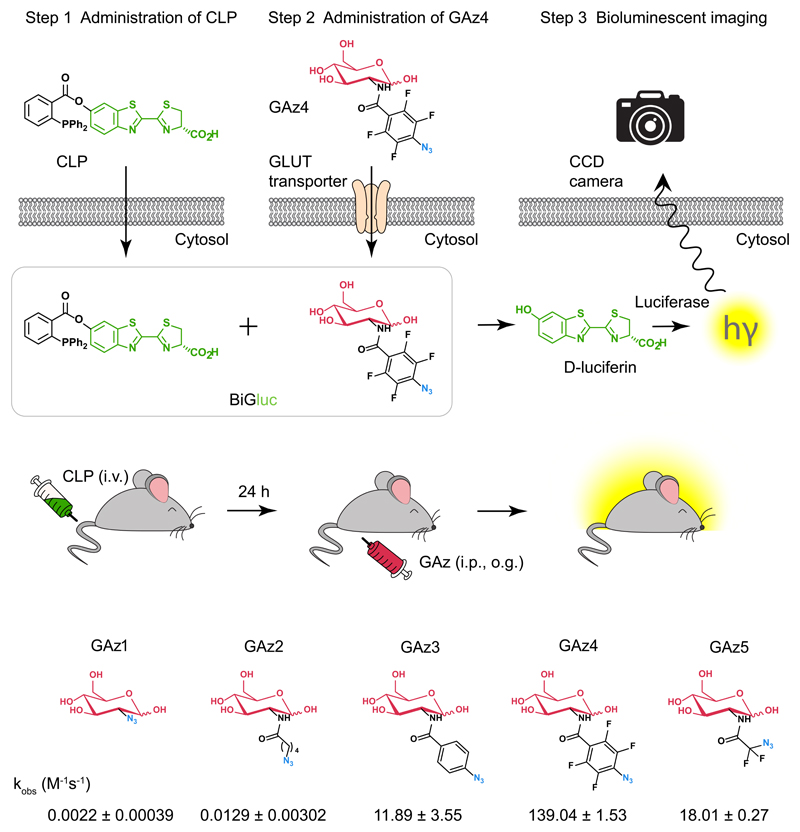
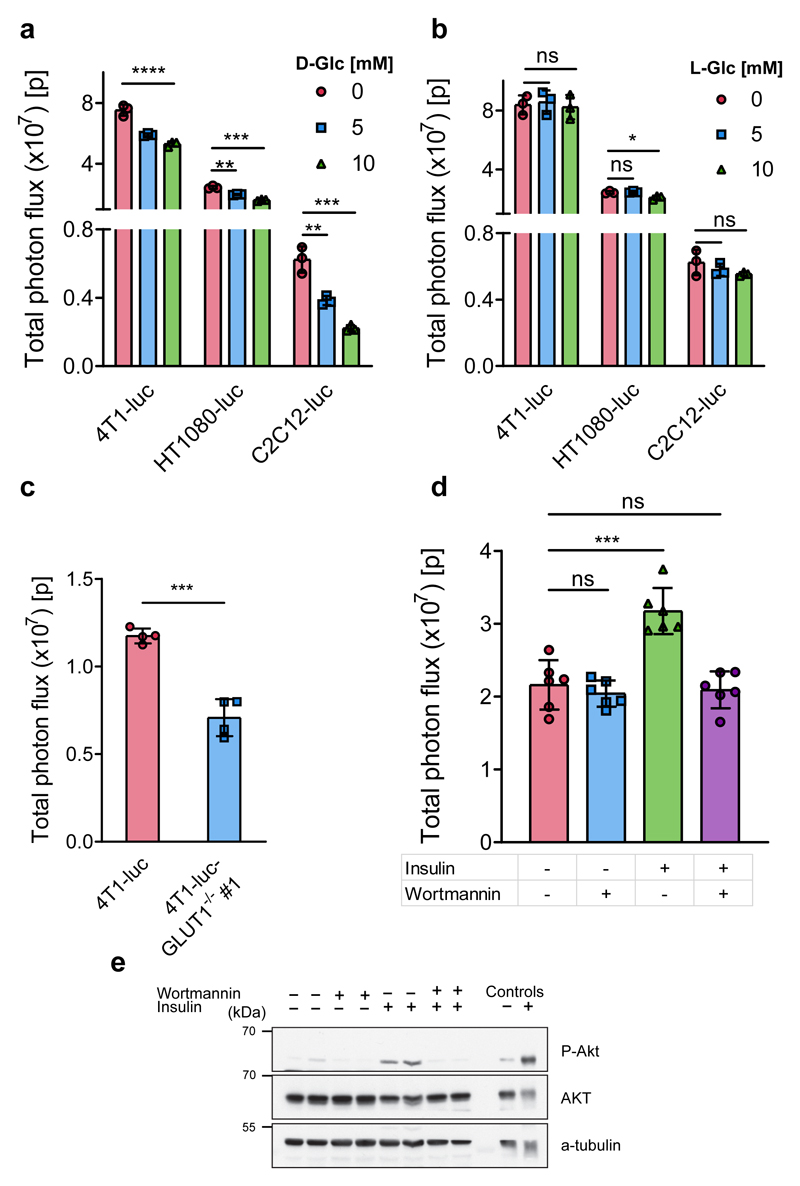
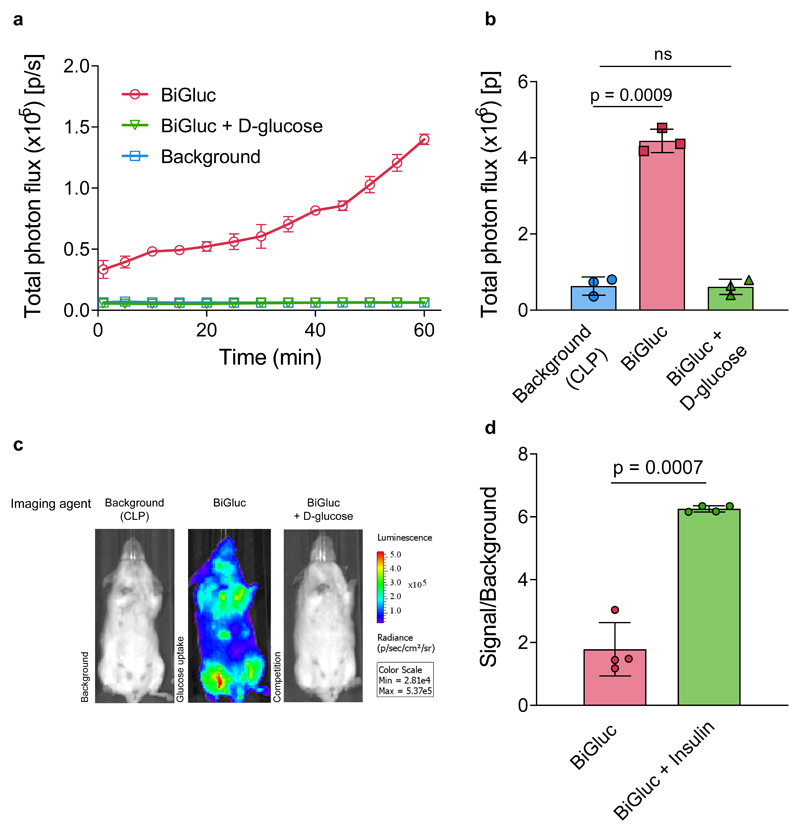
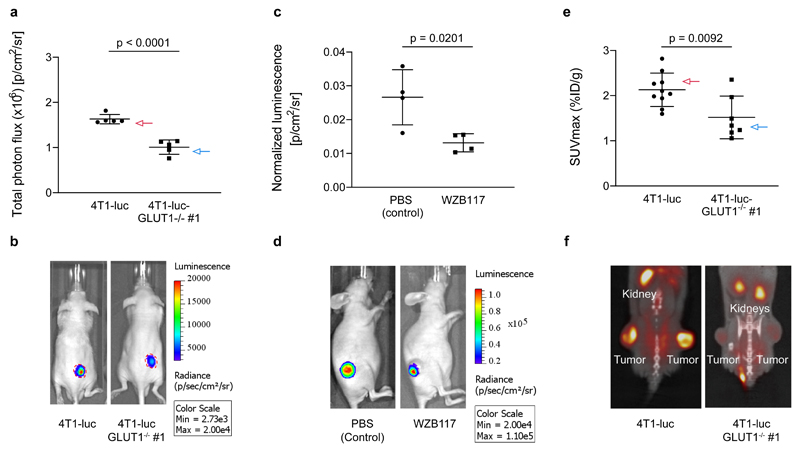
Glucose is a major source of energy for most living organisms, and its aberrant uptake is linked to many pathological conditions. However, our understanding of disease-associated glucose flux is limited owing to the lack of robust tools. To date, positron-emission tomography imaging remains the gold standard for measuring glucose uptake, and no optical tools exist for non-invasive longitudinal imaging of this important metabolite in in vivo settings. Here, we report the development of a bioluminescent glucose-uptake probe for real-time, non-invasive longitudinal imaging of glucose absorption both in vitro and in vivo. In addition, we demonstrate that the sensitivity of our method is comparable with that of commonly used 18F-FDG-positron-emission-tomography tracers and validate the bioluminescent glucose-uptake probe as a tool for the identification of new glucose transport inhibitors. The new imaging reagent enables a wide range of applications in the fields of metabolism and drug development.


Conflict of interest statement

Competing interests

Authors declare no competing interest.

Figures

Figure 1
Figure 1. Design strategy for D-glucose bioluminescent probe (BiGluc).
(a) Schematic representation of the in vitro application of BiGluc technology. The technology is based on the biorthogonal reaction (Staudinger ligation). Two reagents, "caged luciferin phosphine" (CLP) and "glucose azide" (GAz), undergo a reaction inside the cell resulting in the release of free luciferin, which is subsequently processed by luciferase to produce flux of light. Hence, the light output is proportional to the amount of GAz4 reagent taken up inside the cells and is quantified using a CCD camera or plate reader. (b) BiGluc method is suitable for in vivo application. Animals expressing luciferase are first injected with CLP and after 24 h they are administered with GAz4. Immediately after GAz4 administration, animals are monitored using camera imaging system to quantify light produced upon reaction of BiGluc components inside cells. (c) Structures of the synthesized azido-glucoses (GAz1-GAz5) investigated for the best reactivity with CLP reagent in the Staudinger ligation reaction. Reaction rate constants are presented as Mean ± SEM (n = 3, independent experiments).
Figure 2
Figure 2. Imaging and quantification of D-glucose uptake in living cells using the BiGluc probe.
(a) Total photon flux obtained from BiGluc probe in 3 different cell lines stably transfected with luciferase construct (4T1-luc, HT1080-luc, and C2C12-luc). The cells were first incubated for one hour with CLP, washed with PBS, and then treated with GAz4 in the presence or absence of the natural competitor D-glucose (0, 5, and 10 mM) followed by signal acquisition. Bars represent area under the curve (total photon flux) over 20 minutes (n = 3). (b) same as (a), but D-glucose was replaced with L-glucose in identical concentrations (0, 5, and 10 mM) (n = 3). (c) Comparison of light production using BiGluc probe in 4T1-luc and GLUT1 knockout 4T1-luc cells (4T1-luc and 4T1-luc- GLUT1-/- #1 respectively, n = 4). The experiment was performed as described in (a). (d) Total photon flux from C2C12-luc myotubes treated with 10 μM wortmannin for 30 minutes and 100 nM insulin for 30 minutes as outlined in the table, followed by the addition of BiGluc probe as described in (a) and signal acquisition (n = 6). (e) Western blot analysis of the phosphorylation status of Akt in C2C12-luc cells using the treatment described in the table. The total photon flux from cells was normalized to the appropriate luciferin control in cases where the experimental conditions influenced the signal of luciferin production. Data in a-d are presented as mean ± SD, each n represents a biologically independent sample. Experiments in a-e were performed independently at least twice. *P < 0.05, **P < 0.01, ***P < 0.001, ****P < 0.0001, ns – non-significant by two-tailed t test. For blot source images, see Supplementary Figure 15. For individual P values, see Source Data.
Figure 3
Figure 3. Imaging and quantification of D-glucose uptake in transgenic reporter mice (FVB-luc+/+) using the BiGluc probe
(a) Non-invasive quantification of the whole-body bioluminescent signal over time in three different groups of FVB-luc+/+ mice (Background, BiGluc, BiGluc plus D-glucose). Mice were first injected i.v. with CLP solution, 24 h later mice received an oral gavage of either GAz4 (BiGluc group), or GAz4 + D-glucose (BiGluc+D-glucose group), or PBS (Background group). Bioluminescent signal acquisition started immediately after the oral gavage to mice (n = 3). (b) Integration of the kinetic curves (AUC) shown in (a) over 60 minutes (n = 3). Signal to background ratio was 7.5-fold. (c) Representative images from the three groups of mice. (d) Effect of insulin treatment on glucose uptake measured with BiGluc. FVB-luc+/+ mice were intravenously injected CLP. After 24 h they were intraperitoneally (i.p.) injected with either GAz4, or GAz4 plus insulin, followed by 1h of imaging. Signal to background ratio was calculated for each group. Data are presented as mean ± SD (n = 4 per group) Each n represents a biologically independent sample. Experiments in a-d were performed independently at least twice.
Figure 4
Figure 4. Imaging and quantification of D-glucose uptake in tumor xenograft models using the BiGluc and 18F-FDG probes
(a) Comparison of glucose uptake by subcutaneous tumors formed by 4T1-luc and 4T1-luc-GLUT1-/- #1 cells. The cells were injected into Swiss nu/nu mice subcutaneously and allowed to grow.. When tumors reached 65 mm2 size, mice received intravenous injections of CLP 24 h prior to i.p. injection of GAz4. A decrease of signal on 38% was observed in the 4T1-luc GLUT1-deficient tumors compared to 4T1-luc controls. Graph represents total photon flux over 10 minutes from xenografts (n = 5). (b) Representative images of mice bearing 4T1-luc or 4T1-luc-GLUT1-/- #1 tumors are shown. The red line represents the margin of the tumors indicating similar tumor size in both groups. (c) Investigation of BiGluc light output upon treatment with GLUT1 transporter specific inhibitor (WZB-117). Swiss nu/nu mice were injected with 4T1-luc cells. When tumors reached the size of 65 mm3, the mice were divided in 2 groups (4 animals in each) and were i.v. injected with CLP. 24 h later they received i.p. injection of GAz4 or combination of GAz4 and WZB-117. Graph represents areas under the kinetic curves over 60 minutes normalized to photon flux resulting from equimolar injection of luciferin (n = 4). (d) Representative images of mice with and without of inhibitor WZB-117 treatment. (e) Glucose uptake by 4T1-luc and 4T1-luc-GLUT1-/- #1 tumors measured by PET. Maximum standard uptake values (SUVmax) were calculated by measuring the percent injected dose (%ID/g) of 18F-FDG in tumors (n = 10, 4T1-luc tumors and n = 7, 4T1-luc-GLUT1-/- #1 tumors). (f) Representative images of 18F-FDG PET/CT scans of mice bearing 4T1-luc or 4T1-luc-GLUT1-/- #1 tumors. Data are presented as mean ± SD. p values were calculated using two-tailed t-test. Each n represents a biologically independent sample. All experiments were repeated independently at least twice.

Comment in

  • Elena Goun.
    Marx V. Marx V. Nat Methods. 2019 Jun;16(6):449. doi: 10.1038/s41592-019-0429-4. Nat Methods. 2019. PMID: 31086340 No abstract available.

References

    1. Hay N. Reprogramming glucose metabolism in cancer: can it be exploited for cancer therapy? Nature reviews. Cancer. 2016;16:635–649. - PMC - PubMed
    1. Kaur J. A Comprehensive Review on Metabolic Syndrome. Cardiology Research and Practice. 2014;2014:21. - PMC - PubMed
    1. Chang C-H, Pearce EL. Emerging concepts in immunotherapy – T cell metabolism as a therapeutic target. Nature immunology. 2016;17:364–368. - PMC - PubMed
    1. Momcilovic M, Shackelford DB. Imaging Cancer Metabolism. Biomolecules & therapeutics. 2018;26:81–92. - PMC - PubMed
    1. Cox BL, Mackie TR, Eliceiri KW. The sweet spot: FDG and other 2-carbon glucose analogs for multi-modal metabolic imaging of tumor metabolism. American journal of nuclear medicine and molecular imaging. 2015;5:1–13. - PMC - PubMed

Publication types