. 2019 Jun;16(6):545-552.
doi: 10.1038/s41592-019-0398-7. Epub 2019 May 13.

Light-sheet microscopy in the near-infrared II window

Affiliations

Light-sheet microscopy in the near-infrared II window

Feifei Wang et al. Nat Methods. 2019 Jun.

Abstract

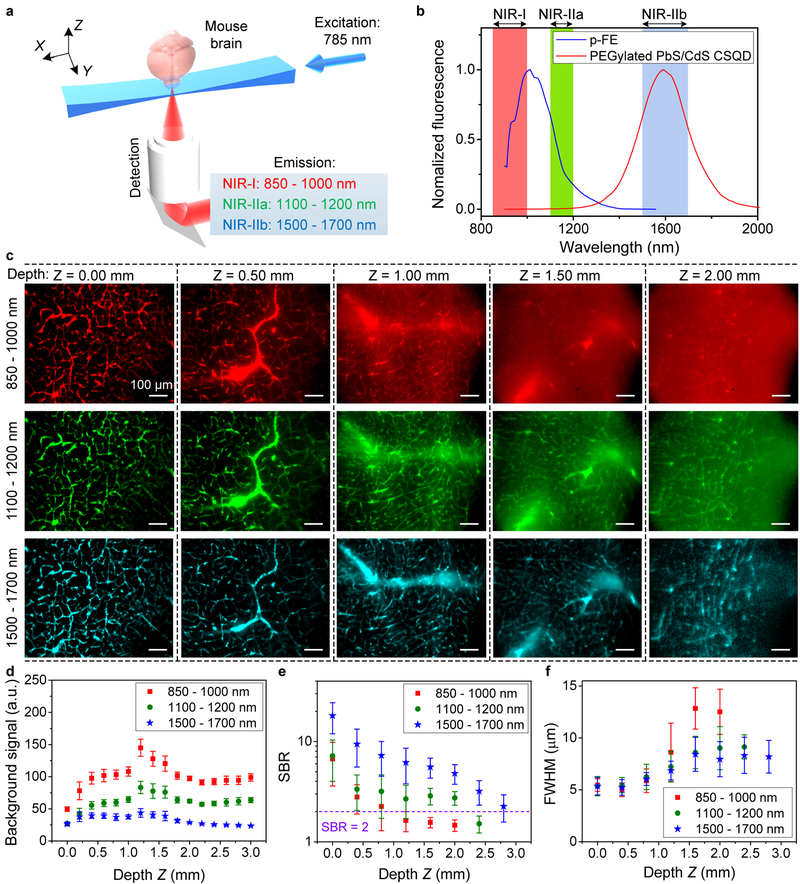
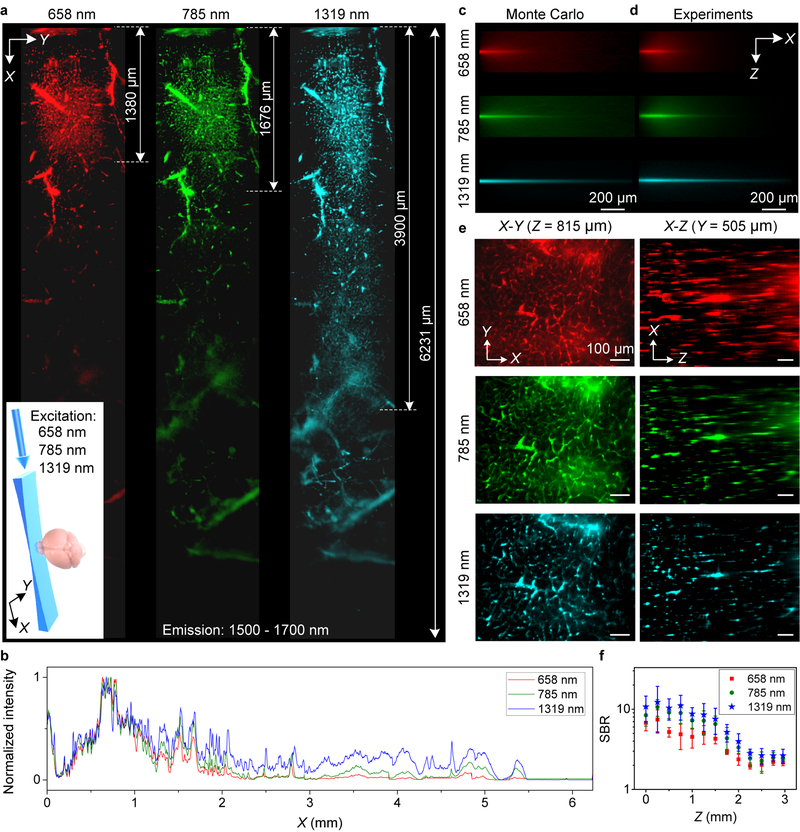
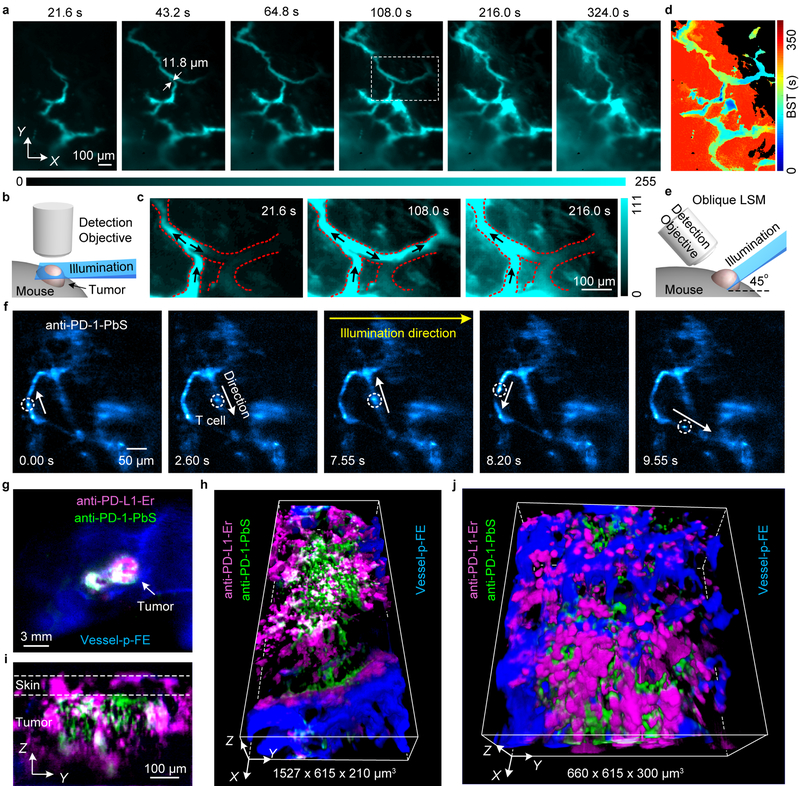
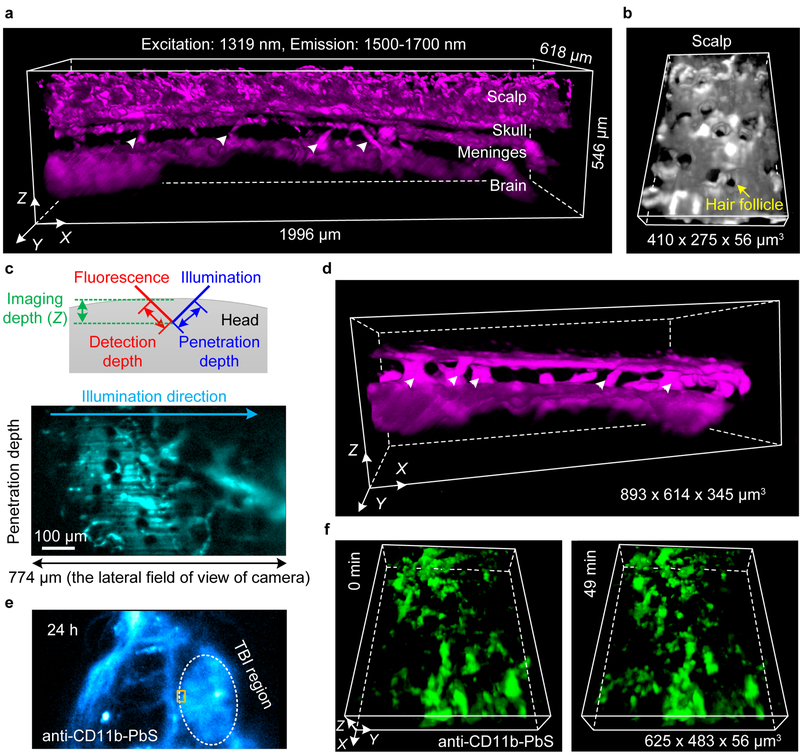
Non-invasive deep-tissue three-dimensional optical imaging of live mammals with high spatiotemporal resolution is challenging owing to light scattering. We developed near-infrared II (1,000-1,700 nm) light-sheet microscopy with excitation and emission of up to approximately 1,320 nm and 1,700 nm, respectively, for optical sectioning at a penetration depth of approximately 750 μm through live tissues without invasive surgery and at a depth of approximately 2 mm in glycerol-cleared brain tissues. Near-infrared II light-sheet microscopy in normal and oblique configurations enabled in vivo imaging of live mice through intact tissue, revealing abnormal blood flow and T-cell motion in tumor microcirculation and mapping out programmed-death ligand 1 and programmed cell death protein 1 in tumors with cellular resolution. Three-dimensional imaging through the intact mouse head resolved vascular channels between the skull and brain cortex, and allowed monitoring of recruitment of macrophages and microglia to the traumatic brain injury site.


Conflict of interest statement

Competing Financial Interests Statement

Authors declare no competing interests.

Figures

Figure 1 |
Figure 1 |. Light sheet microscopy in various NIR 850–1700 nm emission sub-regions in glycerol-cleared brain tissues.
(a) A simplified schematic of the NIR-II LSM. (b) Fluorescence emission spectra of p-FE and PEGylated PbS/CdS core/shell quantum dots (see Supplementary Fig. 2 for excitation spectra). Similar results for n = 5 independent experiments. (c) Light-sheet optical sectioning mouse brain vasculatures at various depths in NIR-I, NIR-IIa and NIR-IIb emission regions using the same 785 nm light sheet illumination kept constant power (0.33 mW) at different depths (also see Supplementary Video 1). Similar results for n = 3 (C57BL/6, female, 6 weeks old). The color bar range for each image is shown in Supplementary Fig. 3. Comparison of (d) background signal, (e) signal-to-background ratio (SBR) and (f) FWHM of smallest vessels at various depths. Background was measured from randomly selected area without vasculatures. SBR is the ratio of fluorescence signals in randomly selected vasculatures over the background. (d-f) The centre values are mean and error bars representing standard deviation were derived from analyzing ~ 10 target data at every depth. A 10X (NA = 0.25) imaging objective and a 5X illumination objective (effective NA = 0.039, light sheet waist w = ~15.2 μm and Rayleigh length b = ~ 1258.2 μm for 785-nm excitation, see Methods for light sheet shape analysis) were used in these experiments. Scale bars are 100 μm for all images in (c).
Figure 2 |
Figure 2 |. Propagation of light sheet excitation with progressively longer wavelength up to 1319 nm in glycerol-cleared brain tissues.
(a) X-Y images of 1500–1700 nm quantum dot fluorescence in the vasculatures of a fixed brain tissue at a depth Z = ~ 200 μm under 658 nm (0.22 mW), 785 nm (0.33 mW) and 1319 nm (1.4 mW) light sheet illumination as shown in the inset. 6 images were taken along X and stitched together for each light sheet. (b) Normalized sum intensity along Y direction of images in (a) as a function of propagation distance (X). Similar results for n = 2 (C57BL/6, female, 6 weeks old). (c) Monte Carlo simulations and (d) experimental results showing the X-Z propagations of different wavelengths light sheets in 2.5% intralipid tissue phantom (mimicking the brain) containing PEGylated PbS/CdS CSQD. Similar results for n = 3 independent experiments. Scattering coefficients were summarized in Supplementary Table 1. (e) Left: X-Y images of quantum dot 1500–1700 nm fluorescence in brain vasculatures taken at Z = 925 m under excitations by 658 nm, 785 nm and 1319 nm light sheets respectively (Supplementary Video 2). Right: images along the X-Z plane at a fixed Y, reconstructed from X-Y images at various depth Z (Supplementary Video 3). A 10X, 0.25-NA detection objective was used and LS excitation was generated by a 5X illumination objective with an effective NA of ~ 0.039. Similar results for n = 3 (C57BL/6, female, 6 weeks old). (f) Comparison of SBR for X-Y images recorded at different depth for 658 nm, 785 nm and 1319 nm excitation. About 10 randomly selected vasculatures and 10 areas without vasculatures were analyzed to calculate SBR at each depth. The centre values are mean and error bars represent standard deviation. Scale bars, 200 μm (c,d) and 100 μm (e).
Figure 3 |
Figure 3 |. Non-invasive in vivo NIR-II light sheet microscopy of tumors on mice.
(a) Time-course (Supplementary Video 5) LSM of tumor vasculatures at a fixed illumination plane below the top of a xenograft MC38 tumor on mouse ear at Z ~ 300 μm after intravenous injection of p-FE (excitation: 785 nm, emission: 1000–1200 nm). A 4X detection objective and a 5X illumination objective in a normal, non-oblique configuration of (b) were used. (c) Abnormal blood flows in tumor vessels, showing on-off intermittency and direction reversal in the rectangular highlighted region in (a) and gradual extravasation into tumor space (Supplementary Video 5). Similar results for n = 3 (C57BL/6, female, 6 weeks old). Black arrows represent flow direction. (d) A BST map showing highly heterogeneous blood perfusion in tumor vessels and slow, inhomogeneous extravasation behavior into tumor space (C57BL/6, female, 6 weeks old; similar results for n = 2). (e) Schematic illustration of in vivo oblique NIR-II LSM with illumination and detection at 45° to mouse body (Supplementary Fig.1b). (f) Time-course (Supplementary Video 6) recording of PD-1+ cells (white circles) in a CT26 tumor labeled by anti-PD-1-CSQDs 2 h after intravenous injection of anti-PD-1-CSQDs at 20 fps by oblique LSM (Supplementary Video 6). (g) Wide-field imaging of anti-PD-L1-Er (magenta), anti-PD-1-PEGylated PbS/CdS CSQD (green) labeled cells and p-FE filling vessels (blue) in a CT26 tumor. (h) Non-invasive in vivo three-plex 3D light sheet microscopy of anti-PD-L1-Er, anti-PD-1-PEGylated PbS/CdS CSQD and vasculatures (p-FE), which is ~ 120 μm beneath the surface in a CT26 tumor. (i) A Y-Z cross section of tumor in (g). (j) A local zoom three-plex 3D LSM of the tumor in (g) (Supplementary Video 7). (f-j) Similar results for n = 2 (BALB/c, female, 6 weeks old). (a,c) were imaged by NIR-II LSM shown in (b). (f,h-j) were obtained using oblique NIR-II LSM (e).
Figure 4 |
Figure 4 |. Non-invasive in vivo light sheet imaging of mouse head by oblique NIR-II LSM.
(a) A 3D reconstructed image of blood vessels in an intact mouse through the scalp, skull, meninges and brain cortex obtained 2 h after intravenous injection of PEGylated PbS/CdS CSQD by an oblique NIR-II LSM shown in Fig. 3e. The white triangles point to the vascular channels connecting the brain cortex and skull in the meninges. (b) A zoomed-in 3D view of the scalp layer showing follicle structures. (c) Top: a schematic diagram showing the definitions of penetration depth, detection depth and imaging depth in oblique NIR-II LSM. The illumination direction was ~ 45° to mouse head. Bottom: an original image recording a cross section along the illumination direction in (a) crossing the full field of field (FOV) of camera when a 10X imaging objective was used. (a-c) Similar imaging were performed at 3 positions of mouse head in each of 2 mice (BALB/c, female, 4 weeks old), for a total n = 6. (d) A 3D reconstructed image of vascular channels (triangles marks) in the meninges obtained at a later time point 12 h after injection of PEGylated PbS/CdS CSQD with 4-μm scan increment along X axis and 10-ms exposure (BALB/c, female, 4 weeks old; similar results for n = 2). (e) Wide-field traumatic brain injury (TBI) imaging of mouse head 26 h after injury and 24 h after intravenous injection of anti-CD11b-PEGylated PbS/CdS CSQD. (f) 3D time-course light sheet imaging/monitoring of meningeal macrophages/ microglia dynamics following brain injury 24 h after injection of anti-CD11b-PEGylated PbS/CdS CSQD at the boundary of TBI region (rectangular marked area in (e)). CD11b+ macrophages/ microglia labeled recruited to the injury was monitored (BALB/c, female, 4 weeks old; similar results for n = 2; Supplementary Video 8).

References

    1. Jain RK Antiangiogenesis strategies revisited: From starving tumors to alleviating hypoxia. Cancer Cell 26, 605–622 (2014). - PMC - PubMed
    1. Liu T-L, Upadhyayula S, Milkie DE et al. Observing the cell in its native state: Imaging subcellular dynamics in multicellular organisms. Science 360, eaaq1392 (2018). - PMC - PubMed
    1. Helmchen F & Denk W Deep tissue two-photon microscopy. Nat. Methods 2, 932–940 (2005). - PubMed
    1. Lapadula G, Bourdolle A, Allouche F et al. Near-IR two photon microscopy imaging of silica nanoparticles functionalized with isolated sensitized Yb(III) centers. Chem. Mater 26, 1062–1073 (2014).
    1. Alifu N, Yan LL, Zhang HQ et al. Organic dye doped nanoparticles with NIR emission and biocompatibility for ultra-deep in vivo two-photon microscopy under 1040 nm femtosecond excitation. Dyes Pigments 143, 76–85 (2017).

Publication types

MeSH terms

Substances