Review
. 2019 Jun;16(6):471-477.
doi: 10.1038/s41592-019-0396-9. Epub 2019 May 13.

Software tools for automated transmission electron microscopy

Affiliations
Review

Software tools for automated transmission electron microscopy

Martin Schorb et al. Nat Methods. 2019 Jun.

Abstract

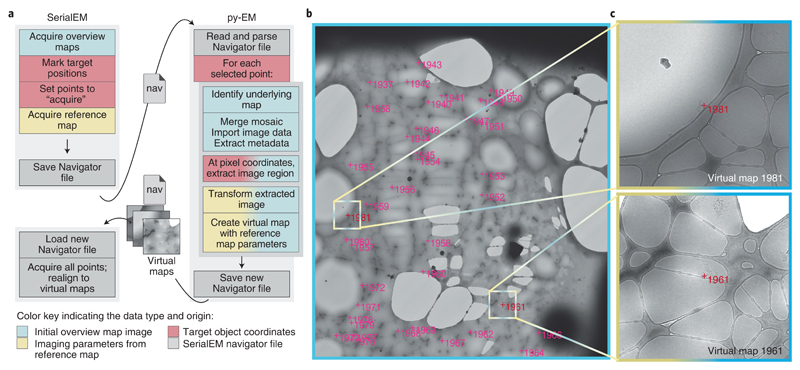
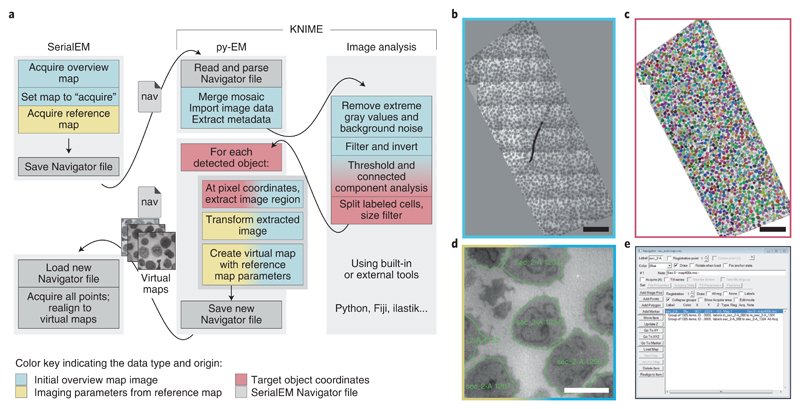
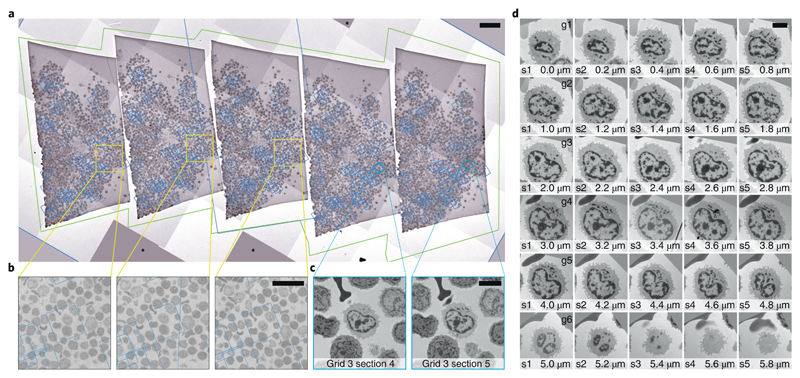
The demand for high-throughput data collection in electron microscopy is increasing for applications in structural and cellular biology. Here we present a combination of software tools that enable automated acquisition guided by image analysis for a variety of transmission electron microscopy acquisition schemes. SerialEM controls microscopes and detectors and can trigger automated tasks at multiple positions with high flexibility. Py-EM interfaces with SerialEM to enact specimen-specific image-analysis pipelines that enable feedback microscopy. As example applications, we demonstrate dose reduction in cryo-electron microscopy experiments, fully automated acquisition of every cell in a plastic section and automated targeting on serial sections for 3D volume imaging across multiple grids.


Conflict of interest statement

Competing interest statement

The authors declare no competing interests.

Figures

Figure 1
Figure 1
Example application of the automatic generation of Virtual Maps to acquire TORC1 filamentous particles with cryo-EM. The color scheme illustrates the data type and origin as indicated in the bottom legend. a – The application workflow depicting the individual steps in the procedure and the communication and data transfer between SerialEM and py-EM using Navigator files and Virtual Map images. b – Overview map covering a single grid square. The magenta crosses indicate the target positions that were manually clicked within this map. Colored boxes and marks indicate the example regions where the corresponding Virtual Maps were extracted. c – Two example Virtual Maps that the script extracted from the map shown in c. The image data is extracted from the overview map while the microscope parameters are copied from the reference map. Scale: FOV of b: 47 μm; colored boxes in b, FOV of c: 3.8 μm. The presented experiment comprised 2500 points from 125 maps on one grid. The identical procedure was so far successfully applied in 9 experiments on different specimens.
Figure 2
Figure 2
Illustration of the workflow to automatically acquire all cells on a resin section. The color scheme illustrates the data type and origin as indicated in the bottom legend. a – The application workflow depicting the individual steps in the procedure and the communication and data transfer using Navigator files and Virtual Map images. The KNIME platform embeds py-EM functionality and the image analysis procedure. Interaction with SerialEM happens by exchanging Navigator files and Virtual Maps. b – Overview map, a montage of the entire section. The image limits are defined manually during the merging procedure. c – The result of the automated cell detection. Each cell is represented by a distinct label value, displayed as different colors. d – An example Virtual Map that has been extracted from the overview map for a single cell. The green outline depicts the polygon that determines the acquisition area. e – The resulting Navigator file contains a Virtual Map and the polygon outline for each of the 1325 detected cells. Scale bars: 50 μm (overviews), 5 μm (Virtual Map). The automated identification of cells presented in this figure has been successfully applied to 26 sections with about 1000 cells each for this experiment and with modified image analysis pipelines for two different specimens.
Figure 3
Figure 3
Automated acquisition of cells on serial sections. a – Overview of a ribbon of sections placed on a slot grid. The green outline marks the polygon used to acquire this Montage map. The blue boxes denote the location of the maps used to realign to each cell. b – Magnified regions in a showing the location of one cell of interest. The fact that the blue box that denotes the location of the corresponding maps is not precisely centered on the cell is not crucial for repositioning. The image information used for realigning is taken from the map itself. c – Two maps of a single cell on neighboring sections. These images are used during Realign to Item. d – Gallery of images of an individual cell across 30 sections (thickness: 200 nm) spread across 6 grids. The images were automatically aligned using TrakEM2. Another cell that spans cross 9 sections is shown in Supplementary Video 3. Scales: a: 50 μm, b: 20 μm, C/D: 5 μm. For the presented experiment we have followed a total of 120 cells across 100 sections on 20 grids for 3 different specimens.

References

    1. Winey M, Meehl JB, O’Toole ET, Giddings TH. Conventional transmission electron microscopy. Mol Biol Cell. 2014;25:319–323. - PMC - PubMed
    1. McMullan G, Faruqi AR, Henderson R. Direct Electron Detectors. Methods Enzymol. 2016;579:1–17. - PubMed
    1. Frank J. Advances in the field of single-particle cryo-electron microscopy over the last decade. Nat Protoc. 2017;12:209–212. - PMC - PubMed
    1. Meijering E, Carpenter AE, Peng H, Hamprecht FA, Olivo-Marin J-C. Imagining the future of bioimage analysis. Nat Biotechnol. 2016;34:1250–1255. - PubMed
    1. Kreshuk A, Koethe U, Pax E, Bock DD, Hamprecht FA. Automated detection of synapses in serial section transmission electron microscopy image stacks. PloS One. 2014;9:e87351. - PMC - PubMed

Publication types

MeSH terms