. 2019 Jun;25(6):988-1000.
doi: 10.1038/s41591-019-0440-4. Epub 2019 May 13.

Aged blood impairs hippocampal neural precursor activity and activates microglia via brain endothelial cell VCAM1

Affiliations

Aged blood impairs hippocampal neural precursor activity and activates microglia via brain endothelial cell VCAM1

Hanadie Yousef et al. Nat Med. 2019 Jun.

Abstract

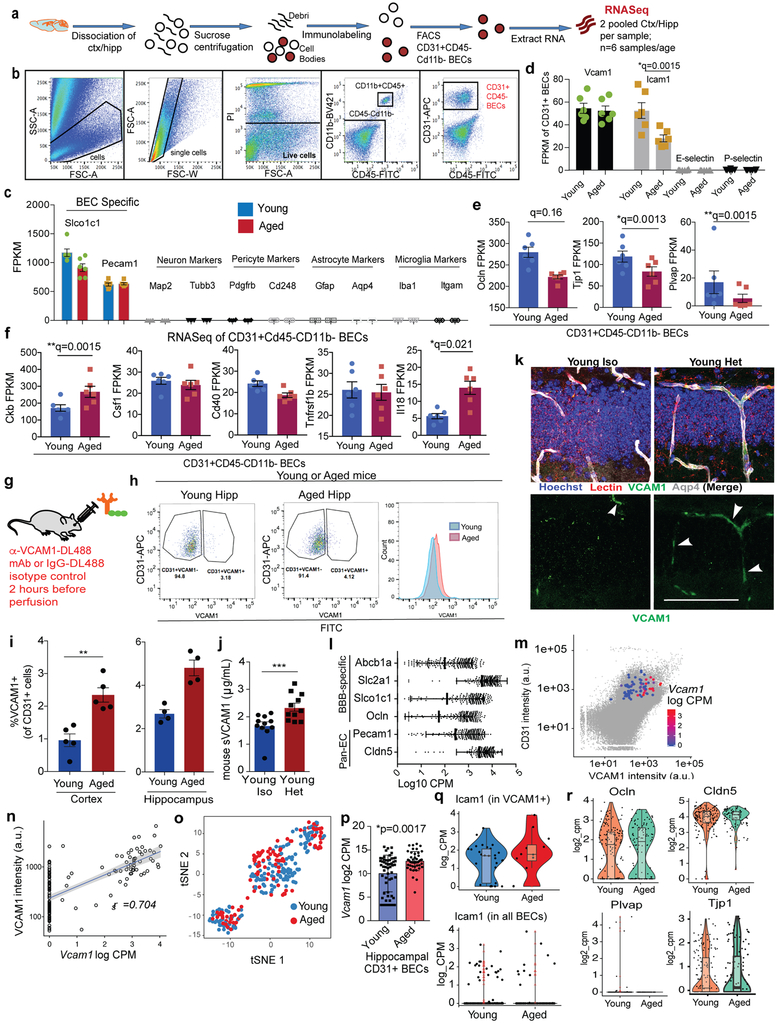
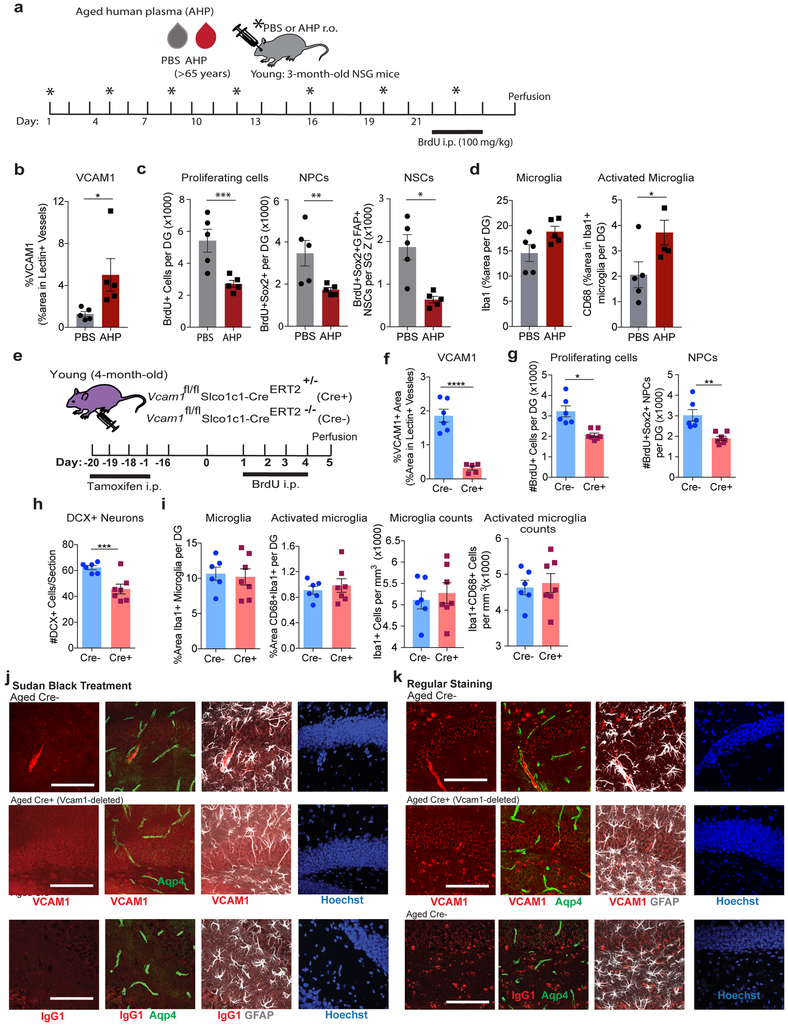
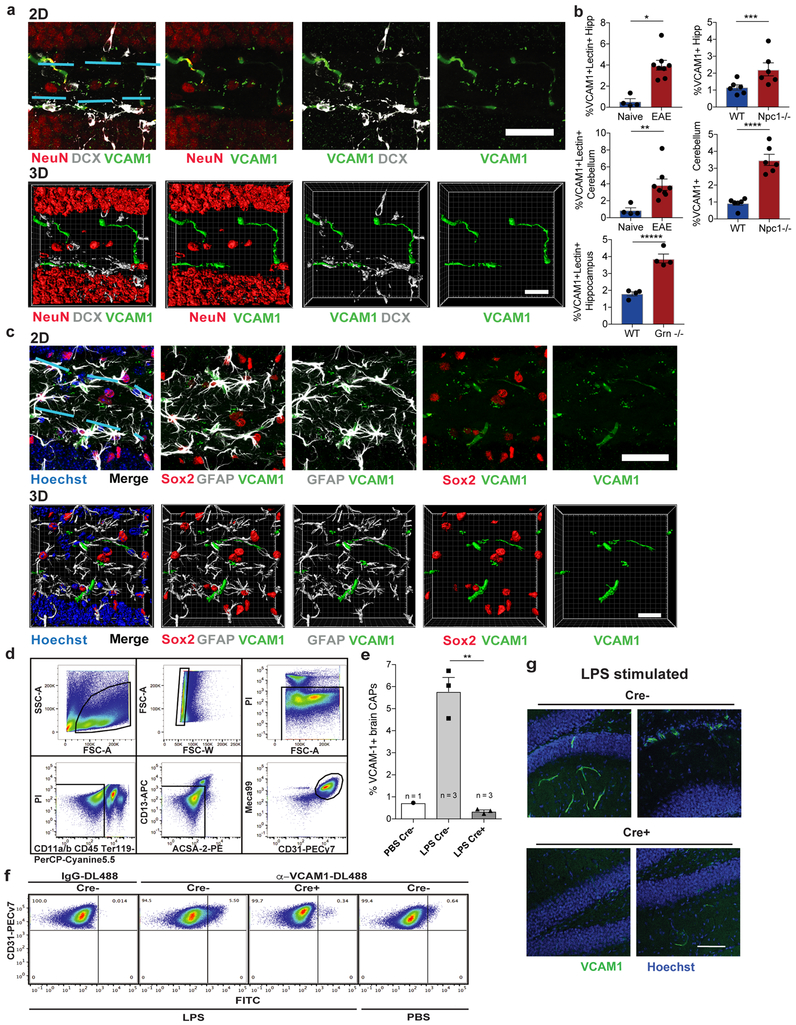
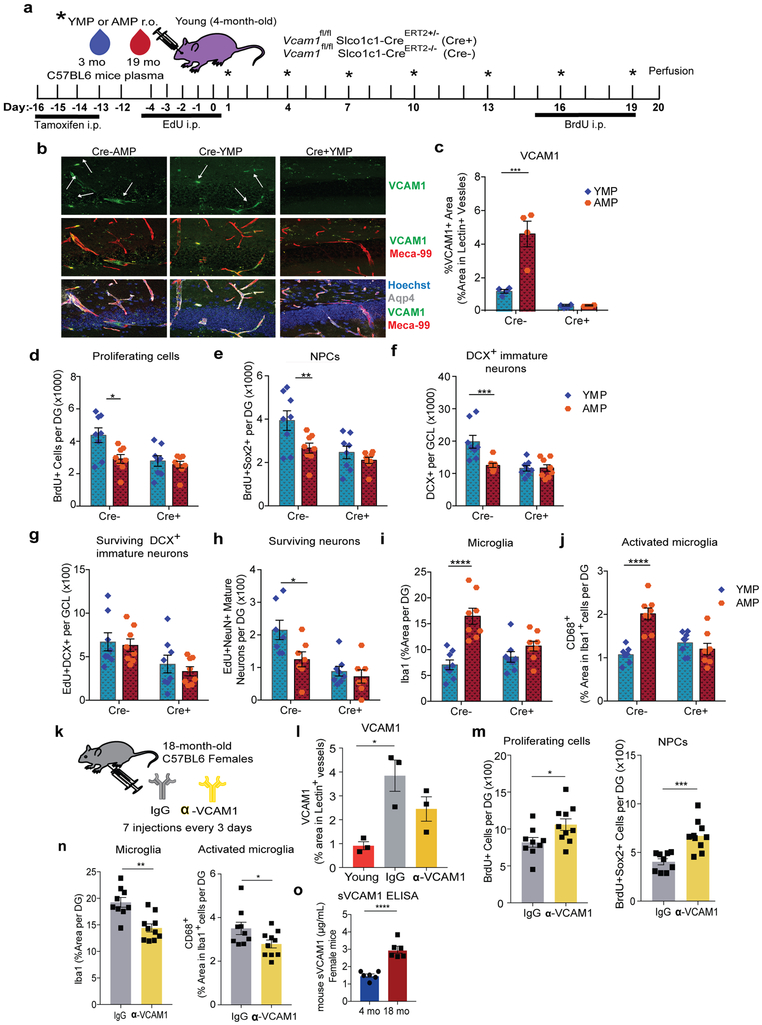
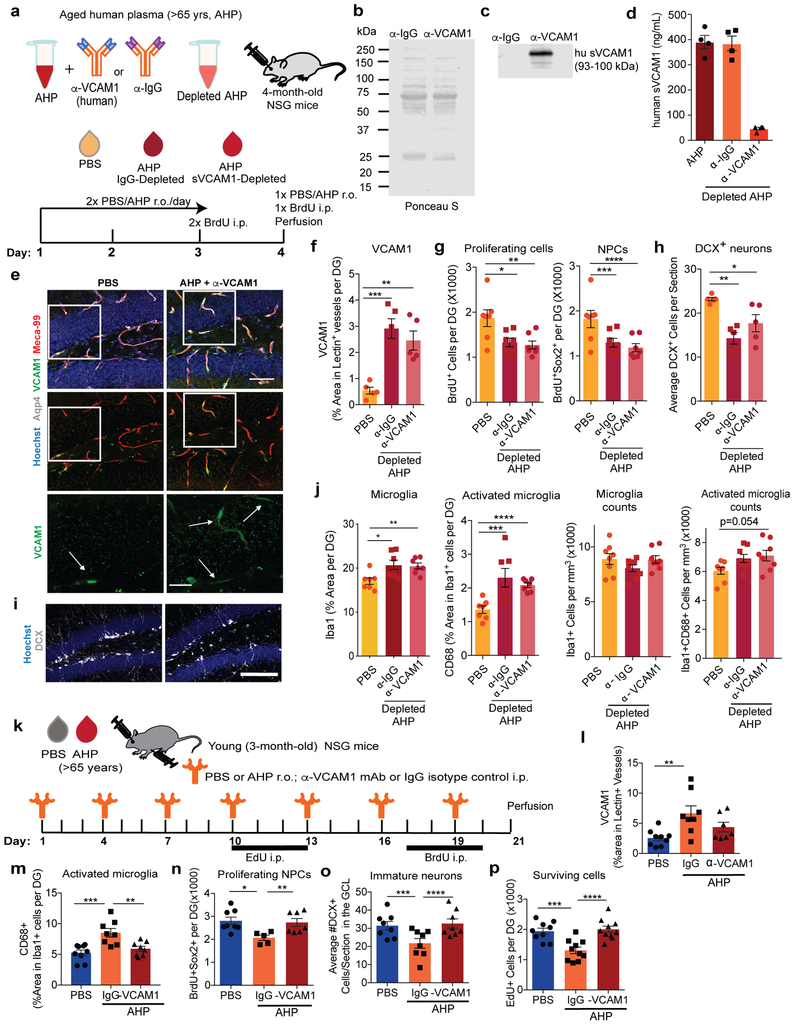
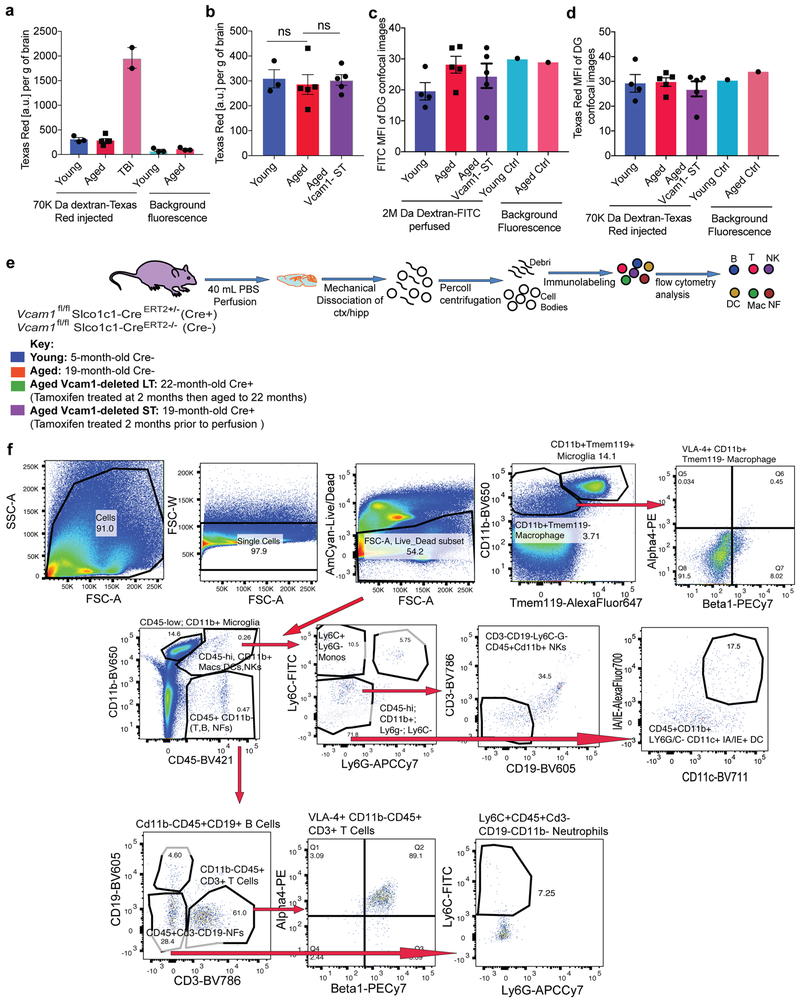
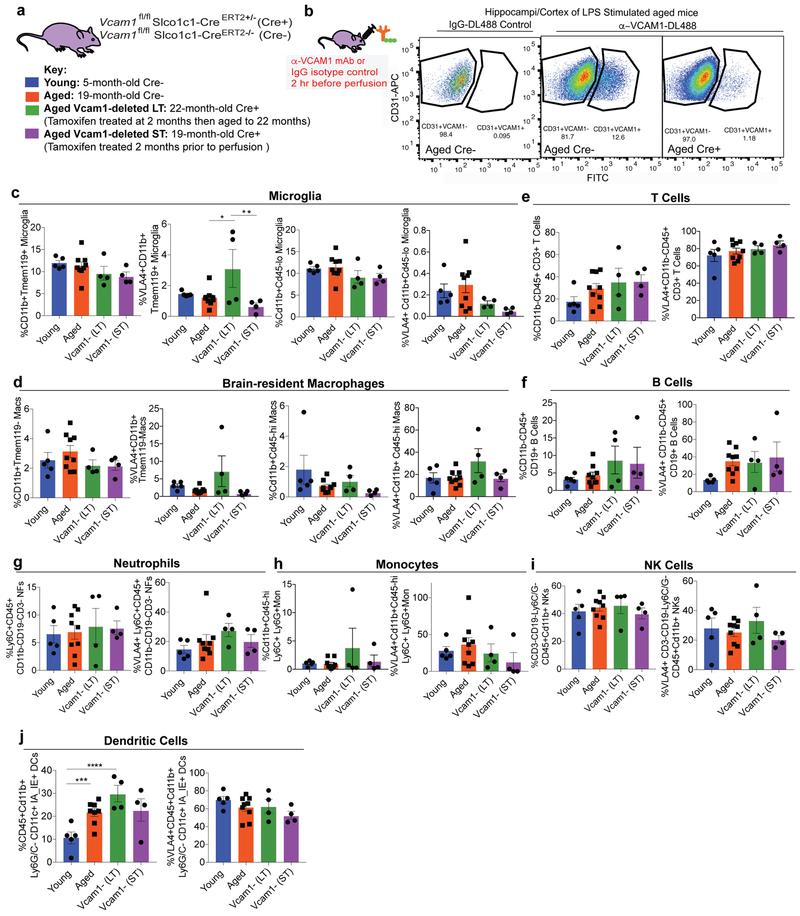
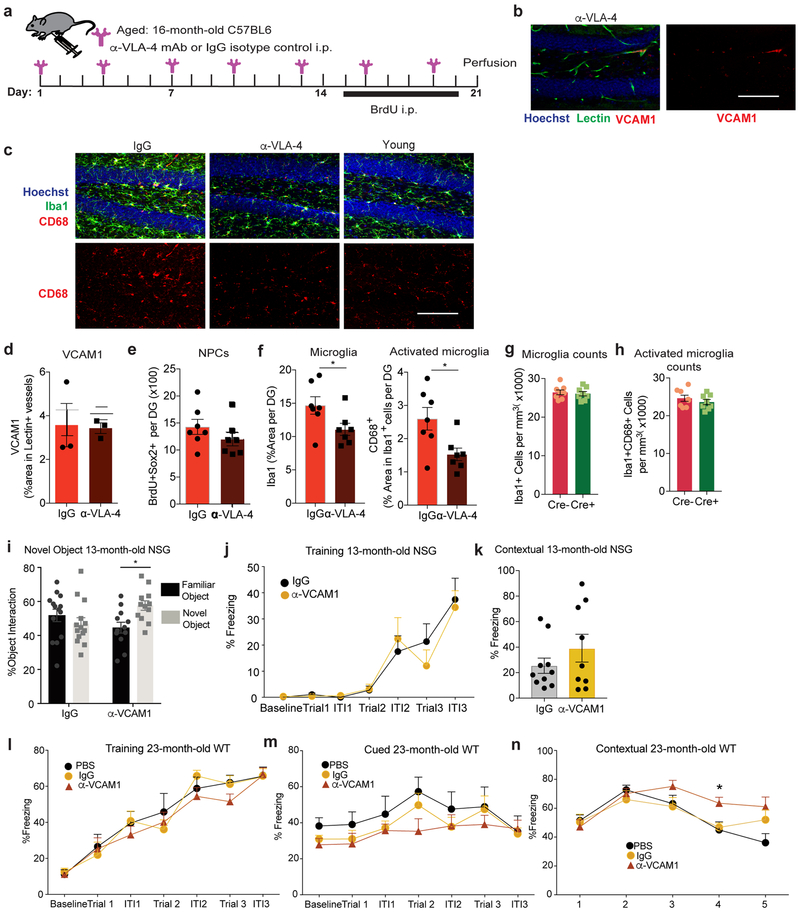
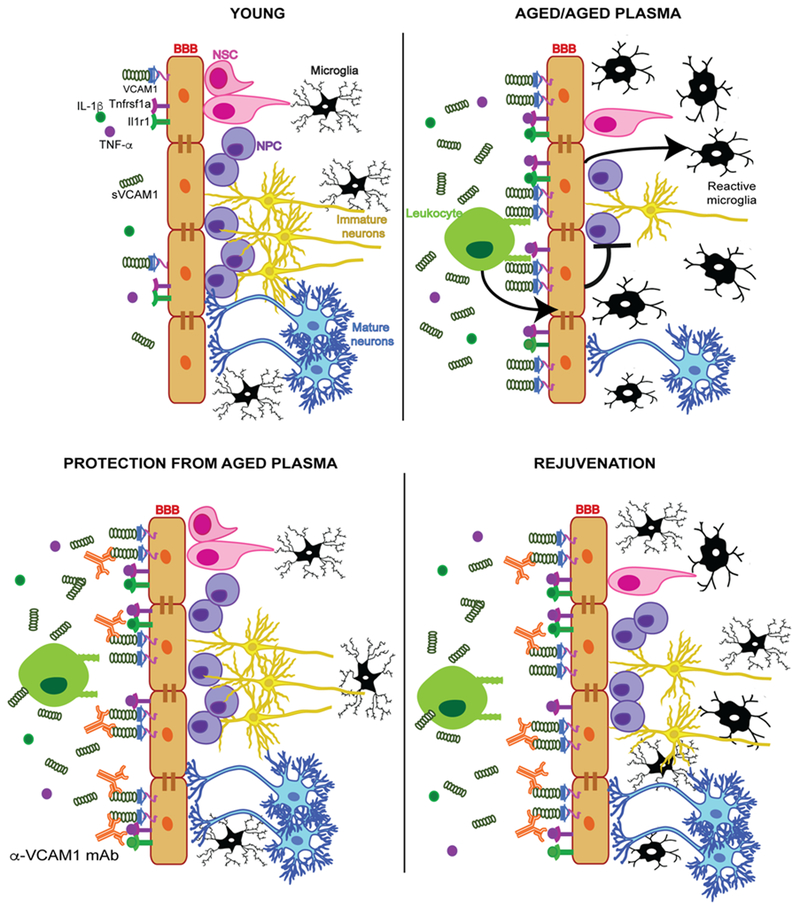
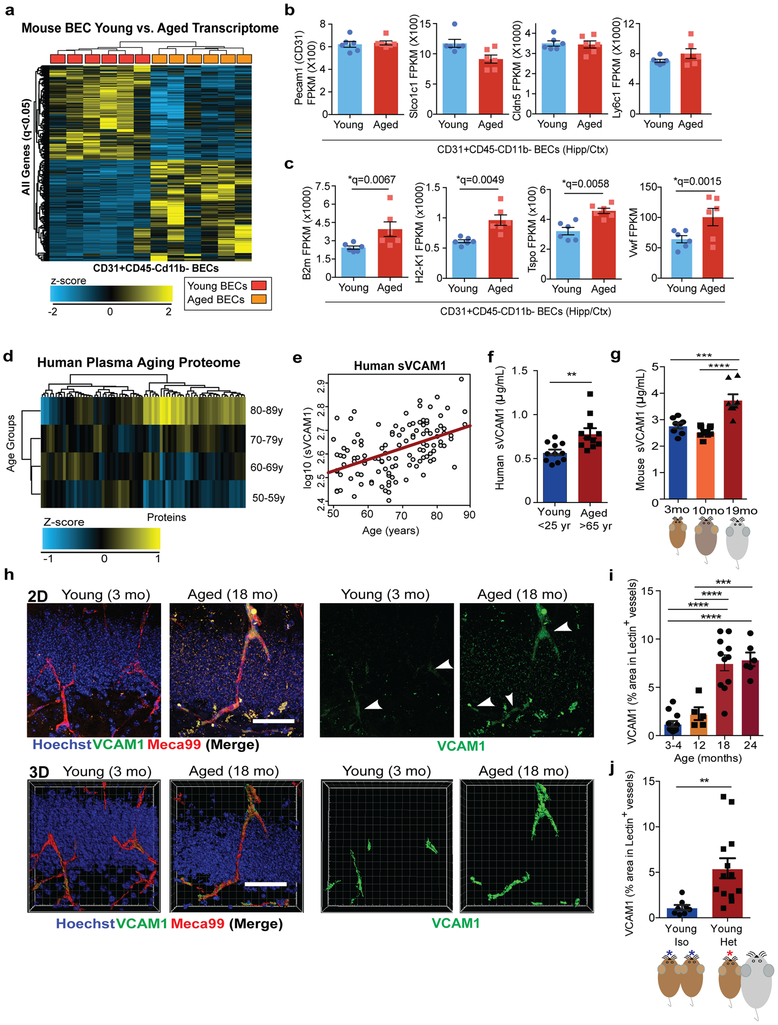
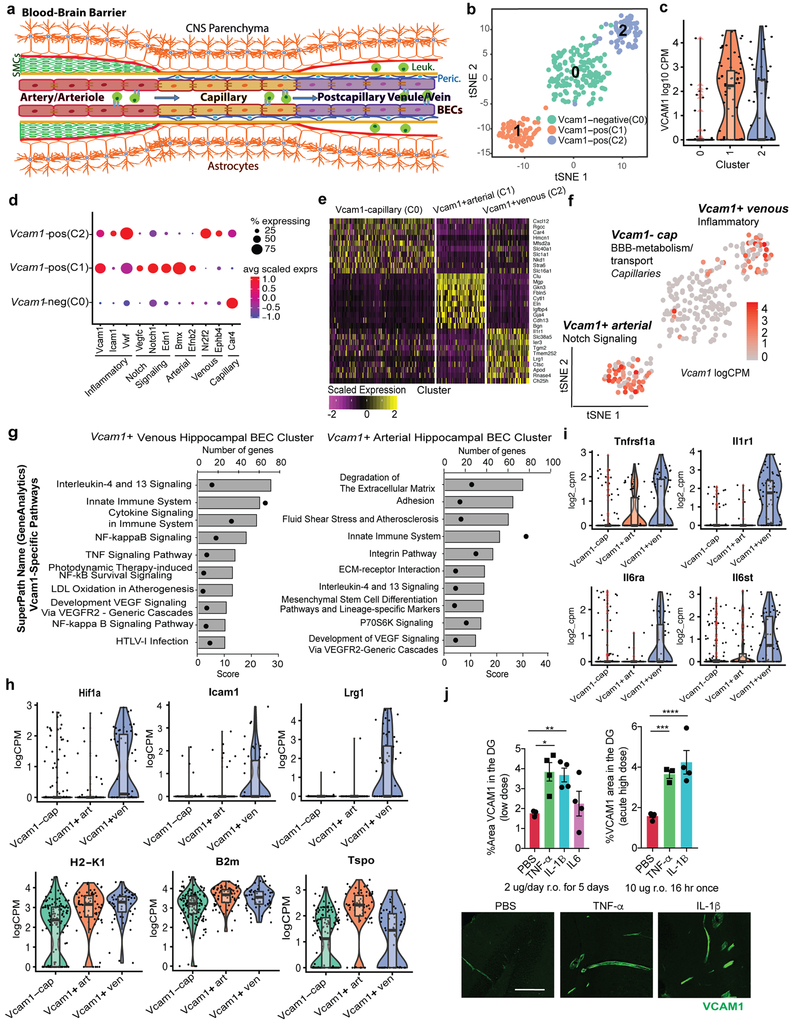
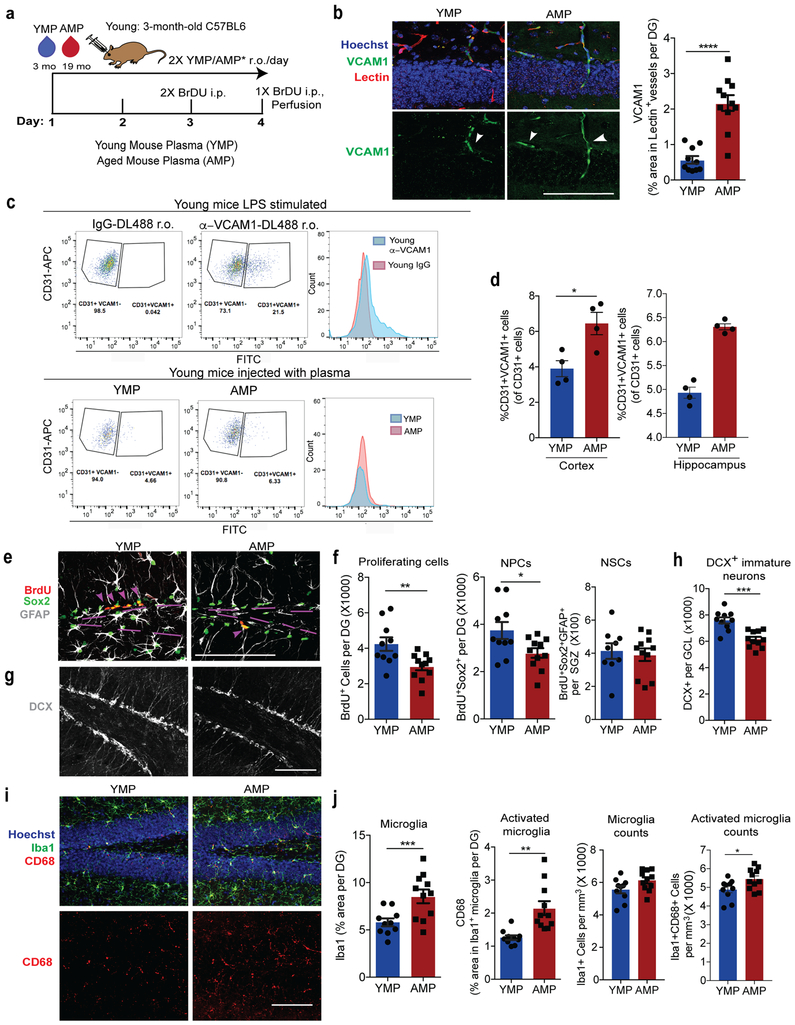
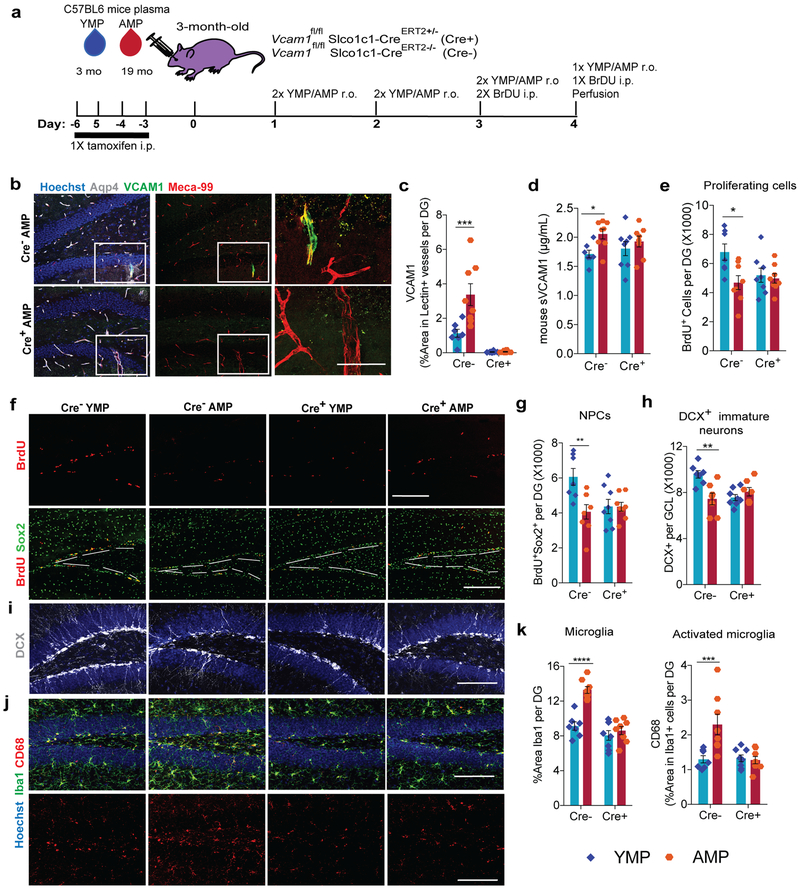
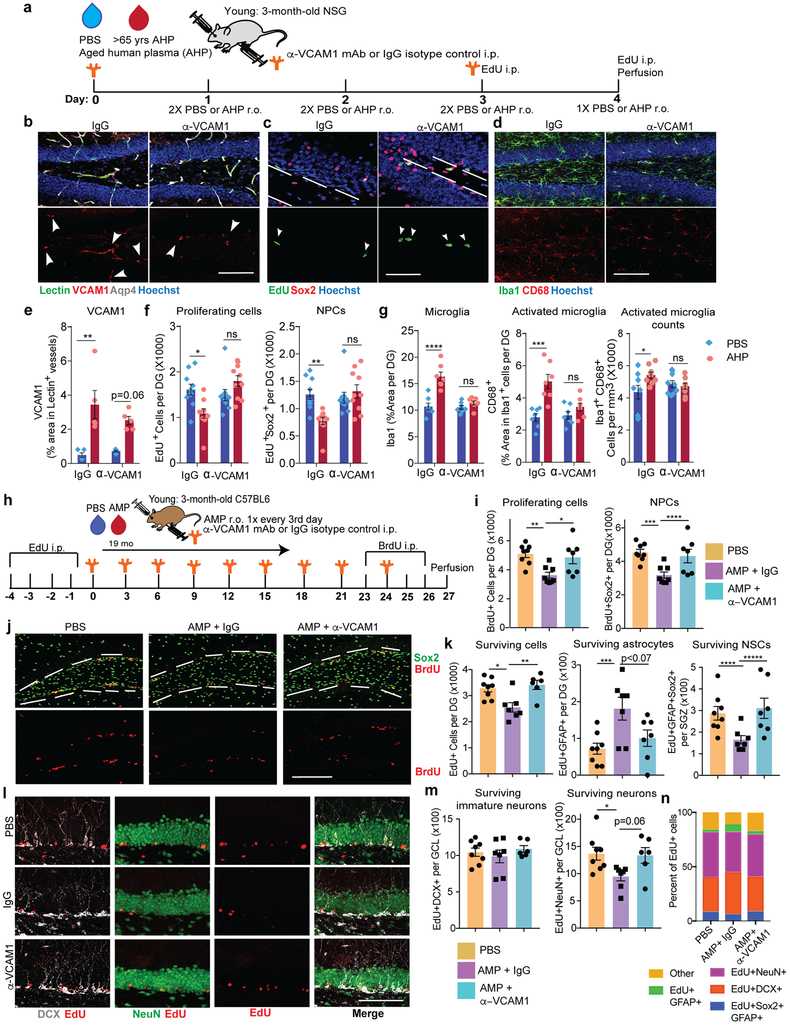
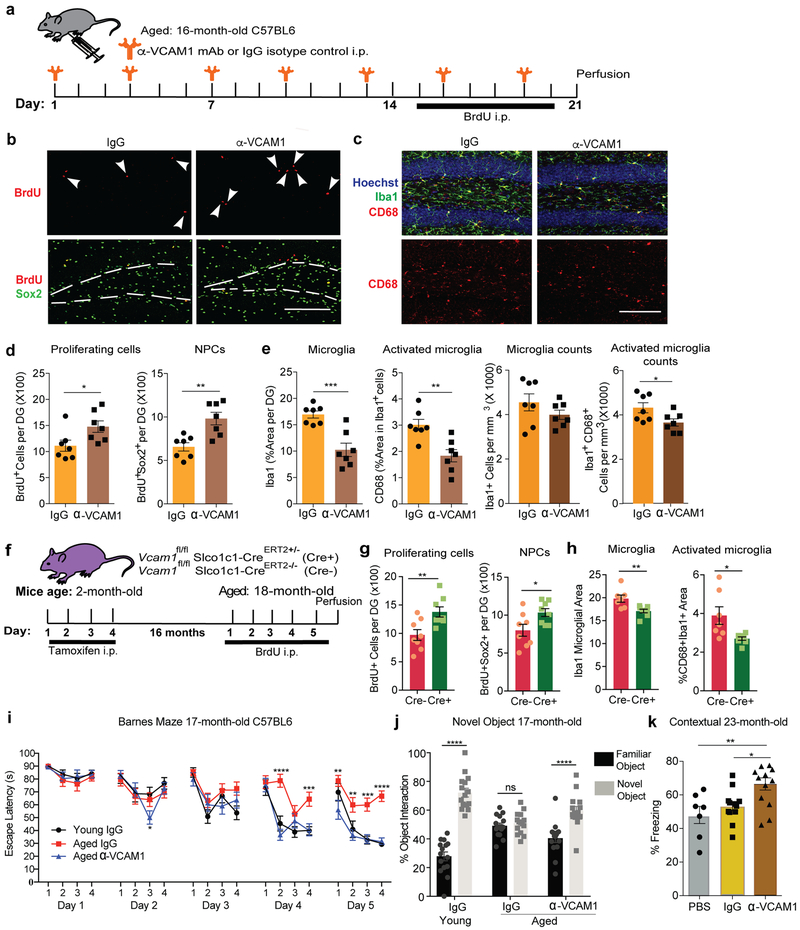
An aged circulatory environment can activate microglia, reduce neural precursor cell activity and impair cognition in mice. We hypothesized that brain endothelial cells (BECs) mediate at least some of these effects. We observe that BECs in the aged mouse hippocampus express an inflammatory transcriptional profile with focal upregulation of vascular cell adhesion molecule 1 (VCAM1), a protein that facilitates vascular-immune cell interactions. Concomitantly, levels of the shed, soluble form of VCAM1 are prominently increased in the plasma of aged humans and mice, and their plasma is sufficient to increase VCAM1 expression in cultured BECs and the hippocampi of young mice. Systemic administration of anti-VCAM1 antibody or genetic ablation of Vcam1 in BECs counteracts the detrimental effects of plasma from aged individuals on young brains and reverses aging aspects, including microglial reactivity and cognitive deficits, in the brains of aged mice. Together, these findings establish brain endothelial VCAM1 at the blood-brain barrier as a possible target to treat age-related neurodegeneration.


Figures

Extended Data Figure 1
Extended Data Figure 1. Bulk and single cell transcriptome and proteome profiling of young and aged BECs reveal increased inflammatory signature with aging.
(a) Schematic of flow sorting of CD31+CD45− BECs from mouse cortex and hippocampi. n=6 young and 6 aged biologically independent samples; each sample= 2 biologically independent mice cortex/hippocampi pooled as one sample. There were 1006 significant differentially expressed genes (*q<0.05, Cuffdiff Statistical Package61). (b) FACS gating strategy to isolate single BECs. PI+ dead cells were excluded. CD11b+ and CD45+ cells were gated to exclude monocytes/macrophages and microglia. CD31+Cd11b−CD45− cells were defined as the BEC population. (c) Fragments Per Kilobase of transcript per Million mapped reads (FPKM) of CNS cell-type specific markers. n=6 young and 6 aged biologically independent samples. Mean +/− SEM. (d) FPKM values of leukocyte binding adhesion molecules including Vcam1. n=6 young and 6 aged biologically independent samples. Bars represent mean. Error bars derived from SEM. Specific q values shown are derived from Cuffdiff Statistical Package (*q=0.0015). See Methods and Source Data for details. (e) FPKM values of tight junction genes. n=6 young and 6 aged biologically independent samples. Mean +/− SEM. q=0.16, *q=0.0013, **q=0.0015, Cuffdiff Statistical Package. See Methods and Source Data for details. (f) FPKM values of the gene transcripts in murine young and aged CD31+BECs of human plasma proteins that change with age (see Supplementary Table 2 for list of human plasma proteins expressed in murine BECs). n=6 young and 6 aged biologically independent samples. Mean +/− SEM. *q=0.0015, **q=0.021, Cuffdiff Statistical Package. See Methods and Source Data for details. (g) C57BL6 mice were injected with anti-VCAM1-DL488 or IgG-DL488 isotype control (r.o.) 2 hours before perfusion to label BECs in vivo prior to brain dissociation, staining and FACS. (h) Flow gating and histogram plots of pooled (n=4 mice/ age group), young or aged hippocampi isolated from healthy mice injected with fluorescently tagged DL488 anti-VCAM1 mAb or IgG-DL488 conjugated isotype control as depicted in (g). (i) Quantification of CD31+VCAM1+cells isolated from (left) healthy cortex (n=4 mice per age group, individually measured) and (right) 4 technical replicates of hippocampi that are pooled from 4 mice per age group. Mean +/− SEM. *p=0.0015. Two-tailed Student’s t-test. (j) sVCAM1 ELISA in plasma from young isochronic or heterochronic parabionts following 5 weeks of parabiosis. n=11 mice/group pooled from two independent experiments. **p=0.0031,Two-tailed Student’s t-test. Mean +/− SEM. (k) Confocal images in the DG of VCAM1, lectin, and Aqp4 of young isochronic or heterochronic parabionts 5 weeks after surgery. Quantification shown in Fig. 1j. Hoechst labels cell nuclei. Scale bar = 100 μm. n= 8 mice in the Young isochronic group and 13 mice in Young heterochronic group from two independent experiments; representative images are shown. (l) Boxplot of expression levels of classical pan-endothelial and BBB-specific transcripts (n=272 BECs total). Minima, maxima, median, and percentiles are listed in Supplementary Table 3. (n=146 Capillary BECs, n=59 Venous BECs, n=67 Arterial BECs pooled from 8 mice hippocampi). (m) Overlay of Vcam1 mRNA levels on corresponding coordinate on the Cd31 vs Vcam1 fluorescent intensity plots obtained during FACs sorting. (n) Validation of the correlation (Spearman’s rho = 0.704) between protein and mRNA levels of 77 single BECs sorted from both Vcam1+ and Vcam1− gates. Scatterplot of Vcam1 fluorescence intensity as measured by FACs and corresponding transcript counts (per million). (o) tSNE visualization colored by cell identity (aged vs. young) (n=160 young BECs, n=112 aged BECs pooled from 4 mice hippocampi per age group). (p) Comparison of Vcam1 expression levels in young and aged hippocampal CD31+ BECs collected from the VCAM1+ gate during FACs sorting (bars represent mean and error bars = SD). (n=160 young BECs, n=112 aged BECs pooled from 4 mice hippocampi per age group). *p=0.017. Two-tailed Mann-Whitney test. (q) Violin plots of mRNA expression levels of Icam1 in all isolated BECs (bottom) and specifically in VCAM1+ enriched BECs (top). Other adhesion molecules, namely Psele and Sele were not found to be expressed in isolated CD31+ BECs. (All BECs: n=160 young BECs, n=112 aged BECs pooled from 4 mice hippocampi per age group; VCAM1+ enriched BECs: n=56 Vcam1+ young BECs, n=44 Vcam1+ Aged BECs pooled from 4 mice hippocampi per age group). Minima, maxima, median, and percentiles are listed in Supplementary Table 3. (r) Violin plots of tight junction markers in all isolated young and aged BECs. (n=160 young BECs, n=112 aged BECs pooled from 4 mice hippocampi per age group). Minima, maxima, median, and percentiles are listed in Supplementary Table 3.
Extended Data Figure 2
Extended Data Figure 2. Single Cell Transcriptome profiling of Vcam1-enriched BECs reveal specialized subclusters and aged plasma upregulates VCAM1 on cultivated BECs.
(a) Violin plots of classical arterial (top) or venous (bottom) markers in each cluster. Putative neurogenic secreted factors include Jag1 and Efnb2. Minima, maxima, median, and percentiles are listed in Supplementary Table 3. (n=146 Capillary BECs, n=59 Venous BECs, n=67 Arterial BECs pooled from 8 mice hippocampi). (b) Violin plots of various angiogenesis and Notch-signaling related genes in each of the 3 distinct clusters. Putative neurogenic secreted factors include Vegfc. Minima, maxima, median, and percentiles are listed in Supplementary Table 3. (n=146 Capillary BECs, n=59 Venous BECs, n=67 Arterial BECs pooled from 8 mice hippocampi). (c) Representative images of Bend.3 cells immunostained for BBB specific markers of adherens junctions (AJ) and tight junctions (TJ), specifically ß-catenin, Claudin-5, and VE-Cadherin. All Bend.3 cells and primary BECs are validated with these markers prior to experimentation; confirmed independently >10 experiments. Hoechst labels cell nuclei. Scale bar = 100 μm. (d) Dose response graph depicting cultured Bend.3 cells stimulated overnight with increasing concentrations of recombinant mouse TNF-α followed by flow cytometry to quantify %CD31+ VCAM1+ cells. n=2 pooled samples per condition. (e) CD31+VCAM1+ Quantification (left) and histogram (right) of Bend.3 cells stimulated overnight with recombinant mouse TNF-α, IL-1β, or IL-6 followed by flow cytometry to measure VCAM1. n=3 biologically independent samples per condition. ****p<0.0001, One-way ANOVA with Tukey’s post hoc test for group comparisons; Mean +/− SEM; experiment repeated four times independently with similar results. (f) Primary BECs and Bend.3 cells cultured in 10% young or aged mouse plasma (YMP: 3-month old; AMP: 18-month-old) or young or aged human plasma (<25 years or >65 years, YHP/AHP) for 16 hours then stained for VCAM1 to label cell nuclei. Representative images are shown. Scale bar = 100 μm. Each plasma treatment experiment in Primary BECs or Bend.3 cells with mouse or human plasma repeated at least three times independently with similar results. (g) Quantification of VCAM1 %area staining. Primary BECs treated with YMP or AMP: n=7 YMP, 9 AMP biologically independent replicates pooled from two experiments. *p=0.0343. Bend.3 cells with YMP or AMP: n=4 biologically independent replicates per group derived from different cell flasks. ***p=0.0003. Bend.3 cells with YHP or AHP: n=6 biologically independent replicates derived from different cell flasks per group. ****p<0.0001. Two-tailed Student’s t-test. Mean +/− SEM. Mean +/− SEM. (h) Bend.3 cells cultured in 10% young or aged mouse plasma (YMP/AMP) for 16 hours followed by flow cytometry of CD31 and VCAM1. n=5 biologically independent replicates per group. Graph of %CD31+VCAM1+ quantification shown with histogram of Bend.3 cells. **p= 0.0082. Two-tailed Student’s t-test. Mean +/− SEM. (i) Quantification of %CD31+ Bend.3 cells treated with young or aged mouse plasma and co-stained with CD31 and ICAM1, E-Selectin, or P-Selectin. n=5 biologically independent replicates per group for ICAM1; n=6 biologically independent replicates per group for E- and P- selectin. Mean +/− SEM. Histogram plots shown to the right of quantifications. Two-tailed Student’s t-test. Not significant; p=0.2355 (ICAM1), p=0.1959 (E-Selectin), p=0.0825 (P-Selectin). (j) Representative images of ICAM1, Meca99, lectin, and Hoechst to label cell nuclei of young (3-month-old) mice which received 7 r.o. injections of young (3 month) or aged (18 month) pooled plasma over 4 days as described in Fig. 3A schematic. n=10 mice treated with YMP,11 mice treated with AMP. Scale bar = 100 μm. Quantification (k) on the right using n=4 mice per group. Mean +/− SEM. Two-tailed Student’s t-test. Not significant; p=0.5222. (l-m) Quantification in the DG of total BrdU+Sox2+ neural progenitor cells in young (3-month-old) mice injected r.o. daily over 5 days (2 μg per injection) with TNF-α (n=4 mice/group) or with 3 LPS injections (0.5 mg/kg i.p.) at 28 hours, 22 hours, and 2 hours prior to perfusion (n= 8 mice per group). In each experiment, mice were pulsed with BrdU every 8 hours for 3 injections prior to perfusion. *p=0.0194 (TNF-α *p= 0.0122 (LPS). Mean +/− SEM. Two-tailed Student’s t-test.
Extended Data Figure 3
Extended Data Figure 3. Assessment of Vcam1fl/flSlco1c1-CreERT2+/− young mice and Sudan Black B treatment quenches autofluorescent staining caused by lipofuscin revealing VCAM1 cerebrovascular specificity, and immunodeficient mice exposed to aged human plasma over 3 weeks have increased brain aging hallmarks.
(a) Schematic. n= 5 mice/group. (b) Quantification in the DG of VCAM1 from immunostained confocal images. n= 5 mice/group. Unpaired two-tailed Student’s t-test. Mean +/− SEM. *p=0.0451. (c) Quantification in the DG of BrdU+ and Sox2+ NPCs and triple labeled GFAP+ neural stem cells from confocal images of immunostained sections. Scale bar = 100 μm. n= 5 mice/group. Unpaired two-tailed Student’s t-test. Mean +/− SEM. ***p=0.007, **p=0.0227, *p=0.0038. (d) Quantification in the DG of Iba1 and CD68 from confocal images of immunostained sections. n= 5 mice/group. Unpaired two-tailed Student’s t-test. Mean +/− SEM. *p= 0.0454. (e) Experimental Design. n= 6 Cre− and 7 Cre+ mice per group. (f) Quantification of VCAM1+ percent area in lectin+ vasculature of immunostained sections from 6 Cre− and 5 Cre+ mice/group. ****p<0.0001. Unpaired two-tailed Student’s t-test. Mean +/− SEM. (g) Quantification of the total number of BrdU+ cells, BrdU+Sox2+ co-labeled neural progenitor cells, and (h) average # DCX+ imature neurons per section in the DG of immunostained sections. n=6 Cre− and 7 Cre+ mice per group. *p=0.0012, **p=0021, ***p=0.0028. Unpaired two-tailed Student’s t-test. Mean +/− SEM. (i) Quantification of Iba1 and CD68 in the DG of immunostained sections. n=6 Cre− and 7 Cre+ mice per group. Bars represent mean. Error bar represents SEM. Stain experiment repeated twice with similar results; Similar mouse experiments using these validated transgenic mice repeated 4 times with similar results (see Supplementary Table 4). (j) Confocal images of brain sections of Cre+ or Cre− aged Slco1c1-CreERT2-Vcam1fl/fl mice treated with tamoxifen in young adulthood (age 2 months) and aged to 18 months stained for anti-VCAM1 or IgG isotype control, Aqp4, and GFAP. Hoechst labels cell nuclei. Aged (18-month-old) brain sections were treated with Sudan Black B to remove lipofuscin background in the granular and hilus layers of the DG. SBB treatment removes the majority of lipid-based artifacts typically seen in aged tissues without suppressing immunofluorescent labeling. Scale bar = 100 μm. Experiment repeated three times with similar results. (k) Aged (18-month-old) Cre+ and Cre− brain sections were immunostained using the regular protocol, without Sudan Black B treatment. Heavy lipofuscin background is present in the Cy3 fluorescence channel. Experiment repeated three times with similar results.
Extended Data Figure 4
Extended Data Figure 4. VCAM1 is not expressed in CNS cell types other than BECs in the hippocampus, is increased during neurodegeneration, and deleted in brain endothelium using Vcam1fl/flSlco1c1-CreERT2+/− transgenic mice.
(a) Representative 2D and 3D Z-stacked high magnification confocal images (51 slices with an interval of 0.4 um) of VCAM1 in the granular layer of the DG of the hippocampus of a young (3-month-old) NSG mouse acutely treated with Aged Human Plasma (AHP). Brain sections were co-stained with DCX and NeuN to label immature and mature granule neurons, respectively. VCAM1 is not expressed in these cell types. Light blue lines outline the granule layer. Experiment repeated 3 times independently with similar results. 2D Scale bar = 50 μm. Two 3D renderings of the 2D images are displayed. 3D Scale bar = 20 μm. (b) Quantification of VCAM1, Aqp4, Lectin, with Hoechst labeling cell nuclei in the hippocampus and cerebellum of EAE (multiple sclerosis), Npc1−/− (Niemann Pick Disease Type C), and Grn−/− (Frontotemporal Dementia) disease models. EAE: n=4 naïve, 8 EAE induced, *p=0.006, **p=0.0125; Npc1: n=6 mice per group, ***p=0.0274, ****p<0.0001; Grn: n=4 mice per group, *****p=0.0004. Unpaired two-tailed Student’s t-test. Mean +/− SEM. (c) Representative 2D and 3D Z-stacked high magnification confocal images (51 slices with an interval of 0.4 um) of VCAM1 in te granular layer of the DG of the hippocampus co-stained with Sox2 and GFAP to label neural stem and progenitor cells (Sox2+GFAP+) and hilus GFAP+ astrocytes. VCAM1 is not expressed in these cell types in the DG. Light blue lines outline the granule layer. Experiment repeated 3 times independently with similar results. 2D Scale bar = 50 μm. Two 3D renderings of the 2D images are displayed. 3D Scale bar = 20 μm. (d) Vcam1fl/flSlco1c1-CreERT2+/− (Cre+) or CreERT2−/− (Cre−) littermates (3-month-old) were treated daily with tamoxifen (i.p. 150 mg/kg) for 5 days followed by 4 days of rest. Mice received 3 LPS injections (0.5 mg/kg i.p.) at 28, 22, and 2 hours prior to perfusion. Mice also received a retro-orbital injection of fluorescently conjugated mouse anti-VCAM1 mAb (100μg) 2 hours prior to perfusion. FACS gating strategy to analyze single BECs. PI+ dead cells were excluded. CD11a/b, CD45, and Ter-119 negative cells were gated to exclude erythrocytes, monocytes/macrophages and microglia. CD13 and ACSA-2 staining was applied to exclude pericytes and astrocytes, respectively. CD31+MECA99+ cells were defined the BEC population. (e) Quantification of (f) flow cytometry that was performed on primary BECs isolated from Cre+ or Cre− mice treated as described in (d). n=3 Cre+ or Cre− mice received LPS, while one Cre− mouse was given PBS vehicle control instead. The VCAM1 gate was set based on a Cre− mice injected with fluorescently conjugated IgG. **p=0.0011; Unpaired two-tailed Student’s t-test; Mean +/− SEM. (g) Representative confocal images of cortex and DG for VCAM1 and Hoechst to label cell nuclei in LPS stimulated mice as descrbed in (d). Loss of Vcam1 in Cre+ mice, but not Cre−, in BBB endothelium, but not in meninges is shown. Experiment repeated 3 times independently with similar results. Scale bar = 100 μm.
Extended Data Figure 5
Extended Data Figure 5. Brain endothelial and epithelial-specific Vcam1 deletion in young mice mitigates the negative effects of aged plasma administration and anti-VCAM1 antibody reduces hallmarks of brain aging in female mice.
(a) Experimental Design. n=8 mice per group. (b) Representative confocal images and (c) quantification in the DG of VCAM1, MECA-99, and Aqp4. Hoechst labels cell nuclei. Scale bar = 100 μm. Arrows point to VCAM1+ vessels. (n=4 mice/group analyzed). 2-way ANOVA with Tukey’s multiple comparisons test. Mean +/− SEM.***p=0.0002. (d-f) Quantification of the total number of BrdU+ cells, BrdU+Sox2+ neural progenitor cells, and DCX+ immature neurons in the DG of immunostained sections. n=8 mice per group. 2-way ANOVA with Tukey’s multiple comparisons test. Mean +/− SEM. *p=0.0193, **p=0.0283, ***p=0.0015. (g-h) Quantification of the total number of surviving EdU+DCX+ immature neurons and EdU+NeuN+ neurons in the DG of immunostained sections. n=8 mice per group. 2-way ANOVA with Tukey’s multiple comparisons test. Mean +/− SEM. *p=0.0181. (i-j) Quantification of Iba1 and CD68 in the DG of immunostained sections. n=8 mice per group. 2-way ANOVA with Tukey’s post-hoc test. Mean +/− SEM.****p<0.0001 for both. (k) Schematic. Aged (18-month-old) C57BL6/J female mice received i.p. injections of a mouse specific anti-VCAM1 mAb or IgG isotype control (9 mg/kg) every 3 days for a total of 7 injections. Mice also received BrdU daily (100 mg/kg i.p.) for 6 consecutive days followed by perfusion 2 days after the last injection. n=9 IgG- treated and 10 anti-VCAM1 mAb-treated mice per group. (l) Quantification of VCAM1+Lectin+ staining from confocal images in the DG. n=3 mice brain sections stained and quantified per group. Mean +/− SEM. *p=0.0128, 1-way ANOVA with Tukey’s multiple comparisons post-hoc test. (m) Quantification of BrdU+ and BrdU+Sox2+ staining from confocal images in the DG. n=9 IgG- treated and 10 anti-VCAM1 mAb-treated mice per group. Unpaired two-tailed Student’s t-test. Mean +/− SEM. *p=0.0325, ***p=0.0003. (n) Quantification of Iba1 and CD68 staining from confocal images in the DG. n=9 IgG- treated and 10 anti-VCAM1 mAb-treated mice per group. **p=0.0008, *p= 0.0427. Unpaired two-tailed Student’s t-test. Mean +/− SEM. (o) sVCAM1 ELISA of the plasma of young (4-month-old) and aged (18-month-old) female mice. n=6 mice/group. ****p<0.0001. Unpaird two-tailed Student’s t-test. Mean +/− SEM.
Extended Data Figure 6
Extended Data Figure 6. Circulating sVCAM1 does not contribute to inhibitory effects of aged plasma administration while anti-VCAM1 antibody prevents inhibitory effects of aged human plasma.
(a) Experimental design. n=7 mice/group. (b) Ponceau S stain showing total protein pull-down from plasma by both IgG and anti-VCAM1 mAb conjugated beads. Experiment repeated 3 times with similar results. (c) Western blot showing human sVCAM1 (93 kDa) pulled down during immunodepletion by anti-human VCAM1 antibody but not IgG. Experiment repeated 3 times with similar results. Full blots shown in Source Data. (d) Human sVCAM1 ELISA of depleted plasma. n=4 mice per group. Mean +/− SEM. (e) Representative confocal images and quantification (f) in the DG of VCAM1, MECA-99, and Aqp4. Hoechst labels cell nuclei. Scale bar = 50 μm for merged images and scale bar= 20 μm for the 4x zoomed single channel VCAM1 images outlined with white squares. Arrows indicate VCAM1+ vessels. n=5 mice/group analyzed. Mean +/− SEM. 1-way ANOVA with Tukey’s multiple comparisons post-hoc test. ***p=0.0004, **p= 0.0025. (g) Quantification of the total number of BrdU+ and BrdU+Sox2+ co-labeled neural progenitor cells in the DG of immunostained sections. n=7 mice/group. Mean +/− SEM. 1-way ANOVA with Tukey’s multiple comparisons post-hoc test. *p=0.0237, **p= 0.0123, ***p=0.0320, ****p=0.0094. (h) Quantification and representative confocal images (i) of the DG for DCX and Hoechst to label cell nuclei. Scale bar = 100 μm. n= 5 mice/group analyzed. Mean +/− SEM. 1-way ANOVA with Tukey’s multiple comparisons post-hoc test. **p=0.0017, *p=0.0385. (j) Quantification of the Iba1+ and CD68+ staining from confocal images in the DG. n=7 mice/group. *p= 0.0156, **p=0.0242, ***p=0.0034, ****p= 0.0237, p=0.0546 PBS compared to anti-VCAM1 activated microglia counts. 1-way ANOVA with Tukey’s multiple comparisons post-hoc test. Mean +/− SEM. (k) Experiment schematic. n=9 PBS-treated, 8 AHP + IgG-treated, and 8 AHP + anti-VCAM1 mAb-treated mice. (l) Quantification in the DG of VCAM1 in lectin+ blood vessels using immunostained confocal images. n=9 PBS-treated, 8 AHP + IgG-treated, and 7 AHP + anti-VCAM1 mAb-treated mice analyzed. 1-way ANOVA with Tukey’s multiple comparisons post-hoc test. Mean +/− SEM. **p=0.006. (m) Quantification in the DG of CD68 in Iba1+ stained microglia using immunostained confocal images. n=9 PBS-treated, 8 AHP + IgG-treated, and 8 AHP + anti-VCAM1 mAb-treated mice. 1-way ANOVA with Tukey’s multiple comparisons post-hoc test. Mean +/− SEM. ***p=0.0006, **p=0.0067. (n) Quantification of BrdU+Sox2+ progenitor cells and DCX+ immature neurons (o) from confocal images. n=9 PBS-treated, 8 AHP + IgG-treated, and 8 AHP + anti-VCAM1 mAb-treated mice. 1-way ANOVA with Tukey’s multiple comparisons post-hoc test. Mean +/− SEM. *p=0.018, **p=0.0386, ***p=0.0344, ****p=0.0167. (p) Quantification of the total numbers of EdU+ surviving cells in the DG of immunostained sections. n=9 PBS-treated, 8 AHP + IgG-treated, and 8 AHP + anti-VCAM1 mAb-treated mice. 1-way ANOVA with Tukey’s multiple comparisons post-hoc test. Mean +/− SEM. ***p=0.0009, ****p=0.0002.
Extended Data Figure 7
Extended Data Figure 7. BBB integrity is not compromised with aging or Vcam1 conditional deletion.
(a) Quantification of fluorescent signal measured with a microplate reader from homogenized brain tissues samples from mice that were injected with Texas Red labeled 70kDa dextran r.o. and perfused with FITC labeled 2MDa dextran 3 hours after injection. Vcam1-fl/fl Slco1c1-CreERT2−/− (Cre−) or Vcam1-;fl/fl Slco1c1-CreERT2−/+ (Cre+) mice were used. n= 3 Young Cre− (5-month-old), 5 aged Cre− (19-month-old), 2 young Cre− mice that underwent TBI as a positive control, 3 young Cre− control mice not injected with dextran, and 3 aged Cre− control mice not injected with dextran. Mean +/− SEM. (b) Quantification of fluorescent signal from homogenized brain tissues samples measured with a microplate reader. Cre− or Cre+ mice were used as described in (a). n= 3 Young Cre−, 5 aged Cre−, or 5 “Aged Vcam1-ST” (19-month-old), which are Cre+ mice that were tamoxifen treated for 4 days, 2 months prior to sacrifice, and that were infused with dextran prior to sacrifice as described in (a). Mean +/− SEM. (c-d) Quantification of Mean Fluorescence Intensity from confocal images of tissue sections from mice injected as in (a-b). Cre− or Cre+ mice were used as described in (a). n= 4 Young Cre−, 5 aged Cre−, 5 “Aged Vcam1-ST” Cre+ mice that were tamoxifen treated and that were infused with dextran as described in (a-b), 1 young and 1 aged Cre− control mice not infused with dextran. Mean +/− SEM. 1-way ANOVA with Tukey’s multiple comparisons post-hoc test. p=0.895 (Young vs. Aged), 0.9097 (Aged vs. Aged Vcam1-ST). (e) Schematic of flow cytometric analysis of various immune cell populations from mouse cortex and hippocampi. (f) Flow cytometry gating strategy of individual hippocampal immune cell populations labeled with various immune cell markers, anti-alpha4 and anti-beta1 integrins (VLA-4). n-1 was used to gate fir VLA-4+ cell populations.
Extended Data Figure 8
Extended Data Figure 8. Brain-resident leukocyte composition does not change with aging or Vcam1 conditional deletion.
(a) Mouse model and experimental groups. n= 5 Young Cre− mice, 9 Aged Cre− mice, 4 “Vcam1− (LT)” mice, and 4 “Vcam1-(ST)” mice. Vcam1-fl/fl Slco1c1-CreERT2−/− (Cre−) or Vcam1-fl/fl Slco1c1-CreERT2−/+ (Cre+) mice were used. Tamoxifen treatment paradigm described in schematic. (b) Gating plots of CD31+VCAM1+ hippocampal and cortex cells isolated from 1 LPS stimulated aged (19-month-old) Cre+ (Vcam1−deletion ST) mouse and 1 Cre− mouse injected with fluorescently tagged DL488 anti-VCAM1 mAb (r.o.) 2 hours before sacrifice to confirm VCAM1 on BECs was reduced. 1 additional Cre− mouse was treated with LPS and injected with IgG-DL488 isotype control prior to sacrifice to serve as a control for VCAM1 gating. (c-j) Quantification of various cell populations present in Young Cre− (n=5), Aged Cre− (n=9), Aged Vcam1-deleted LT (n=4), and Aged Vcam1-deleted ST (n=4) mice per group. Mean +/− SEM. *p=0.0413, **p=0.0245, ***p=0.0429, ****p=0.0023. Mean +/− SEM. 1-way ANOVA with Tukey’s multiple comparisons post-hoc test.
Extended Data Figure 9
Extended Data Figure 9. VCAM1 and VLA4 perturbations reduce hallmarks of brain aging.
(a) Experimental design for anti-VLA-4. n=7 mice/group. (b) Representative confocal images and quantification (d) of VCAM1, Lectin, and Hoechst to label cell nuclei. Scale bar = 100 μm. n=3 mice/group analyzed. Mean +/−SEM. (c) Representative confocal images and quantification (f) in the DG of CD68, Iba1, and Hoechst. Scale bar = 100 μm. n=7 mice/group. Mean +/−SEM. Two-tailed Student’s t-test. *p=0.0436, **p=0.0175. (e) Quantification of confocal images of the DG of NPCs co-labeled with BrdU and Sox2. n=7 mice/group. Mean +/−SEM. (g-h) Quantification of Iba1+ and Iba1+CD68+ Microglia in the DG from the experiment described in Figure 6f. n=8 mice/group. Mean +/−SEM. (i-k) 13-month-old NSG mice were injected with anti-VCAM1 mAb or IgG every 3 days for one month and underwent novel object recognition or fear conditioning during the last week (n=11 mice per group). Quantification of percent time spent exploring objects in novel object placement task is shown in (i) while %Freezing observed during the Training (j) phase is shown. The average of Trials 3-5 for Contextual are quantified in (k). Mean +/−SEM. 2-way Anova with Sidak’s multiple comparisons test. *p=0.0485. There were no significant differences between groups for contextual freezing (Two-tailed Student’s t-test; p=0.2722). (l-n) 23-month-old C57BL6 mice were injected with anti-VCAM1 or IgG every 3 days for one month and underwent fear conditioning during the last week (n=7 PBS, 12 IgG, and 13 anti-Vcam1-treated mice per group). %Freezing observed during the Training (l), Cued (m), and Contextual (n) tests are shown. Mean +/− SEM. 2-way Anova with Tukey’s multiple comparisons test between groups at each timepoint. *p=0.0493. Individual data point distribution shown in Source Data.
Extended Data Figure 10
Extended Data Figure 10. Aged blood inhibits hippocampal NPC activity and activates microglia through VCAM1 at the blood-brain barrier (BBB).
In young healthy mice, neurovascular homeostasis is maintained with low expression levels of systemic soluble VCAM1 (sVCAM1) and BBB-specific VCAM1, active neurogenesis with neural stem cells (NSCs) differentiating into NPCs (NPCs), immature neurons and mature neurons, and nonreactive microglia in a low inflammation environment. During aging or exposure to aged plasma, we propose: 1) Inflammatory factors in aged plasma (IL-1β, TNF-α, among others) induce arterial and venous BEC activation and upregulation of VCAM1 through their cytokine receptors Tnfrsf1a and Il1r1. 2) Venous VCAM1 facilitates tethering, but not transmigration, of leukocytes which sustain BEC inflammation. 3) Inflamed and activated venous and arterial VCAM1+ brain endothelium relay (unknown) signals to the parenchyma leading to a loss of homeostasis, decline in NPC activity and chronic activation of microglia. 4) anti-VCAM1 mAb protects young brains from the detrimental effects of aged plasma by reducing BEC-mediated inflammation. 5) anti-VCAM1 mAb rejuvenates aged brains by reducing BEC-mediated inflammation and VCAM1+ BEC-mediated reduction in NPC proliferation.
Fig. 1.
Fig. 1.. BECs are activated with age. Systemic and cerebrovascular VCAM1 increases with aging and heterochronic parabiosis.
(a) Heat map displaying up or down-regulated genes in young versus aged BECs based on bulk RNAseq (n=6 young and 6 aged biologically independent samples; each sample= 2 biologically independent mice cortex/hippocampi pooled as one sample). There were 1006 significant differentially expressed genes (*q<0.05, Cuffdiff Statistical Package). (b) Fragments Per Kilobase of transcript per Million mapped reads (FPKM) of BEC cell-type specific markers. n=6 young and 6 aged biologically independent samples. Mean +/− SEM. (c) FPKM values of inflammation and activation related genes. n=6 young and 6 aged biologically independent samples. Mean +/− SEM. Specific q values shown are derived from Cuffdiff Statistical Package. See Methods and Source Data for details. (d) Heat map showing changes in 31 out of 74 human plasma factors with aging (p<0.05, Spearman’s correlation coefficient). Multiplex assay used (n=118 healthy humans). (e) Spearman correlation of VCAM1 levels and age (Spearman’s correlation coefficient = 0.47; p=7.7e-08; q=5.72 × 10⁻⁶). (f) Human sVCAM1 ELISAs in 11 young (<25 years old) or 11 aged (>65 years old) plasma from individual healthy donors. **p=0.0033, Student’s t-test. Two-tailed. Mean +/− SEM. (g) ELISA for mouse sVCAM1 in plasma from young (3-month-old; n=8), middle-aged (8–10-month-old; n=10), and aged (19-month-old; n=8) mice. Mean +/− SEM. ***p=0.0001 ****p<0.0001, 1-way ANOVA with Tukey’s multiple comparisons test. (h) Representative confocal images in the DG of young (3-month-old) or aged (18-month-old) mice given retro-orbital (r.o.) injections of fluorescently conjugated anti-VCAM1 and anti-Meca99 2 hours before perfusion. Hoechst labels cell nuclei. Scale bar = 50 µm. 3D rendering of the 2D images are displayed. 3D Scale bar = 50 µm. VCAM1 quantified in 4 separate cohorts of mice spaced 6 months or more apart. (i) Quantification of VCAM1+Lectin+ stained brain vasculature in young, middle, and aged hippocampi. n=12 young (3-4-month-old), 5 middle (12-month-old), 11 aged (18-month-old), and 6 very aged (24-month-old) mice. VCAM1 quantified in 4 separate cohorts of mice spaced 6 months or more apart. Mean +/− SEM. ***p=0.0002, ****p<0.0001, 1-way ANOVA with Tukey’s multiple comparisons test. (j) Quantification in the DG of VCAM1+Lectin+ stained brain vasculature of young isochronic or heterochronic parabionts 5 weeks after surgery. Representative images shown in Extended Data Figure 1k. **p=0.0071, Student’s t-test. Two-tailed. Mean +/− SEM. n= 8 mice in the Young Isochronic group and 13 mice in Young heterochronic group from two independent experiments.
Fig. 2.
Fig. 2.. Single cell RNASeq of VCAM1 enriched young and aged BECs.
(a) Schematic of the Blood-brain barrier (BBB). Nutrient-rich, oxygenated blood is pumped into the brain through cerebral arterial BECs (arteries and arterioles), which are protected and supported by smooth muscle cells (SMCs) that cover the endothelium and form a basement membrane layered by astrocytic end-feet of the brain parenchyma. The blood is transferred to highly specialized capillaries, which are comprised of BECs that form unique tight junctions and are wrapped by pericytes (Peric.) within the endothelial basement membrane, which is then covered by astrocytic end-feet. BBB capillaries are the site of controlled transport of fluids and solutes into the CNS. Immuno-surveillance and occasional extravasation of leukocytes (Leuk.) into the CNS parenchyma occurs at the level of postcapillary venous cells (venules and veins) the vascular segments into which blood flows after passing through the capillaries. Postcapillary Venules contain enlarged perivascular space between the endothelial and astrocytic basement membranes where occasional immune cells can reside., (b) Unbiased clustering of 112 aged and 160 young hippocampal BECs using whole transcriptome and visualization with tSNE reveals 3 molecularly distinct BEC populations. (c) Violin plots of Vcam1 reveal differing levels of the transcript in each of the cell clusters. Minima, maxima, median, and percentiles are listed in Supplementary Table 4. (n=146 Capillary BECs, n=59 Venous BECs, n=67 Arterial BECs pooled from 8 mice hippocampi). (d) Dotplot comparing the expression (scaled transcript counts and percent of population expressing) of various classical inflammatory, Notch signaling, arteriolar, venular and capillary markers between the three clusters (Cluster 0: Vcam1-negative, Cluster 1: Vcam1-pos, Cluster 2: Vcam1-pos). (e) Heatmap of the scaled expression of the top 10 enriched genes (differentially expressed with p<0.05, Mann-Whitney test, two-sided) in each cluster. Genes are ranked by highest log-fold change when compared to all other cells. (f) tSNE visualization colored by Vcam1 expression levels. Clusters are further annotated by their putative functional-phenotype and vessel segmental identity. (n=146 Capillary BECs, n=59 Venous BECs, n=67 Arterial BECs pooled from 8 mice hippocampi). (g) GeneAnalytics (GSEA Package)- Brain Endothelial Cell Pathway analysis of the Vcam1−positive venous and arteriolar hippocampal BEC clusters. The top 10 pathways containing Vcam1 are highlighted here, along with the number of genes in each pathway enriched and the score assigned to each pathway. (h) Violin plots of various inflammation-related genes in each of the 3 distinct clusters. To note, age-related chemokine Ccl11 and its receptor, Ccr3, were not found to be expressed in isolated CD31+ BECs. Minima, maxima, median, and percentiles are listed in Supplementary Table 4. (n=146 Capillary BECs, n=59 Venous BECs, n=67 Arterial BECs pooled from 8 mice hippocampi). (i) Violin plots of cytokine receptors enriched in the Vcam1−positive venous cluster. Minima, maxima, median, and percentiles are listed in Supplementary Table 4. (n=146 Capillary BECs, n=59 Venous BECs, n=67 Arterial BECs pooled from 8 mice hippocampi). (j) Young (2.5-month-old) mice were injected with PBS control (n=5 mice high dose, 3 mice low dose), TNF-α (n=3 mice at high dose, 4 mice at low dose), IL-1β (n=4 mice low dose, 4 mice high dose), or IL-6 r.o. (n=4 mice low dose) daily over 5 days (2 µg per injection; low dose) or acutely (10 µg; high dose). Representative confocal images (bottom) and quantification (top) of VCAM1+ staining in the DG. Scale bar = 100 µm. Mean +/− SEM. *p=0.027, **p=0.041, ***p=0.028, ***p=0.006. 1-way ANOVA with Dunnett’s multiple comparison’s test.
Fig. 3.
Fig. 3.. Aged blood administration into young mice activates brain vasculature and microglia and reduces hippocampal NPC activity.
(a) Schematic of experimental design. n=10 mice treated with YMP,11 mice treated with AMP. (b) Representative confocal images (left) and quantification (right) of VCAM1+lectin+ in the DG. Hoechst labels cell nuclei. Arrows indicate VCAM1+ vessels. Scale bar = 100 µm. ****p=0.0001. Two-tailed Student’s t-test. Mean +/− SEM. n=10 mice treated with YMP,11 mice treated with AMP. (c) Top: Histogram plots of CD31+VCAM1+ cells isolated from LPS stimulated young (3-month-old) wildtype mice injected (r.o.) with fluorescently tagged DL488 anti-VCAM1 mAb or IgG-DL488 isotype control 2 hours before sacrifice. This was done to set the gating for VCAM1+CD31+BECs. Bottom: Flow gating and histogram plots of pooled (n=4 mice/plasma treatment), young hippocampi isolated from plasma-injected young mice. To label VCAM1+BECs, mice were injected (r.o.) with fluorescently tagged DL488 anti-VCAM1 mAb 2 hours before sacrifice. (d) Quantification of CD31+VCAM1+cells isolated from (left) healthy cortex (n=4 mice per plasma treatment, individually measured) and (right) 4 technical replicates of hippocampi that are pooled from 4 mice per plasma treatment group. Mean +/− SEM. *p=0.017. Two-tailed Student’s t-test. (e) Representative confocal images and quantification (f) in the DG and SGZ of BrdU+, Sox2+, and GFAP. Scale bar = 100 µm. Purple lines outline the SGZ and arrows indicate proliferating NPCs. **p=0.009, *p=0.028. Two-tailed Student’s t-test. Mean +/− SEM. n=10 mice treated with YMP,11 mice treated with AMP. (g) Representative confocal images and quantification (h) in the GCL of DCX (white). Scale bar = 100 µm. ***p=0.0001. Two-tailed Student’s t-test. Mean +/− SEM. n=10 mice treated with YMP,11 mice treated with AMP. (i) Representative confocal images and quantification (j) in the DG of CD68, Iba1, and Hoechst. Scale bar = 100 µm. ***p=0.0047, **p=0.0011, *p=0.031. Two-tailed Student’s t-test. Mean +/− SEM. n=10 mice treated with YMP,11 mice treated with AMP.
Fig. 4.
Fig. 4.. Brain endothelial and epithelial-specific Vcam1 deletion in young mice mitigates the effects of aged plasma administration.
(a) Experimental design. n=7 Cre− mice administered YMP, 8 Cre+ mice administered YMP, 8 Cre− mice administered AMP, 8 Cre+ mice administered AMP. Plasma administration in these transgenic mice was performed 1 additional time in a long-term paradigm with similar results (Extended Data Figure 5). Plasma administration was performed in 8 independent experiments with similar results (Supplementary Table 4). (b) Representative confocal images in the DG of VCAM1, MECA-99, and Aqp4. Hoechst labels cell nuclei. Scale bar = 200 µm for merged images and scale bar= 50 µm for the zoomed VCAM1 and MECA-99 merged images outlined with white squares. Tissue was stained and VCAM1 was measured in all 31 mice in this study. (c) Quantification of VCAM1+ lectin+ vasculature ***p=0.0031. 2-way ANOVA with Tukey’s multiple comparisons test. Mean +/− SEM. n=7 Cre− mice administered YMP, 8 Cre+ mice administered YMP, 8 Cre− mice administered AMP, 8 Cre+ mice administered AMP. (d) Mouse sVCAsM1 ELISA of plasma samples. *p=0.022. 2-way ANOVA with Tukey’s multiple comparisons test. Mean +/− SEM. n=7 Cre− mice administered YMP, 8 Cre+ mice administered YMP, 8 Cre− mice administered AMP, 8 Cre+ mice administered AMP. (e) BrdU quantification and representative confocal images (f) and BrdU+Sox2+ quantification (g) in the DG of brain sections immunostained for BrdU and Sox2. White dotted lines outline the SGZ; Scale bar = 200 µm. *p=0.02, **p=0.017. 2-way ANOVA with Tukey’s multiple comparisons test. Mean +/− SEM. n=7 Cre− mice administered YMP, 8 Cre+ mice administered YMP, 8 Cre− mice administered AMP, 8 Cre+ mice administered AMP. (h) DCX+ quantification and representative confocal images (i) in the GCL. Hoechst labels cell nuclei. Scale bar = 100 µm. **p=0.0015. 2-way ANOVA with Tukey’s multiple comparisons test. Mean +/− SEM. n=7 Cre− mice administered YMP, 8 Cre+ mice administered YMP, 8 Cre− mice administered AMP, 8 Cre+ mice administered AMP. (j) Representative confocal images and quantification (k) from the DG of CD68 and Iba1. Hoechst labels cell nuclei. Scale bar = 100 µm. ****p=0.0008, ***p=0.0061, 2-way ANOVA with Tukey’s multiple comparisons test. Mean +/− SEM. n=7 Cre− mice administered YMP, 8 Cre+ mice administered YMP, 8 Cre− mice administered AMP, 8 Cre+ mice administered AMP.
Fig. 5.
Fig. 5.. Anti-VCAM1 antibody prevents inhibitory effects of aged plasma administration in young mice.
(a) Experimental design. n=10 mice per group. (b) Representative confocal images and quantification (e) (n= 5 mice/group) in the DG of VCAM1, lectin, and Aqp4. Hoechst labels cell nuclei. White arrows point to VCAM1+ vessels. Scale bar = 100 µm. Mean +/− SEM. 2-way ANOVA with Tukey’s multiple comparisons test. ****p=0.0013, p=0.06 (PBS vs. AHP in mice treated with anti-VCAM1 mAb). (c) Representative confocal images and quantification (f) in the DG of EdU and Sox2. Hoechst labels cell nuclei. Arrows indicate proliferating NPCs. The SGZ is outlined with white lines. Scale bar = 50 µm. n=10 mice/group. Mean +/− SEM. 2-way ANOVA with Tukey’s multiple comparisons test. *p=0.0154. (d) Representative confocal images and quantification (g) in the DG of CD68 and Iba1. Hoechst labels cell nuclei. Scale bar = 100 µm. n=10 mice/group. Mean +/− SEM. 2-way ANOVA with Tukey’s multiple comparisons test. ****p<0.0001, ***p=0.0001, *p=0.0407. (h) Experimental design. n=8 mice injected with PBS (r.o.), 8 mice injected with AHP (r.o.) and IgG (i.p.), and 7 mice injected with AHP (r.o.) and anti-VCAM1 mAb (i.p.) (i) Quantification and (j) representative confocal images in the DG of BrdU+ and BrdU+Sox2+ precursor cells. The SGZ is outlined with white lines. Scale bar = 100 µm. n=8 mice injected with PBS, 8 mice injected with AHP and IgG, and 7 mice injected with AHP and anti-VCAM1 mAb. Mean +/− SEM. One-way ANOVA with Tukey’s post hoc test for group comparisons. **p=0.0056, *p=0.0253, ***p=0.0041, ****p=0.019. (k) Quantification in the DG of total number of surviving EdU+ cells, EdU+GFAP+ astrocytes, and EdU+Sox2+GFAP+ radial glia-like NSCs in the SGZ based on confocal images of immunostained brain sections for EdU, Sox2, and GFAP. n=8 mice injected with PBS, 8 mice injected with AHP and IgG, and 7 mice injected with AHP and anti-VCAM1 mAb. Mean +/− SEM. One-way ANOVA with Tukey’s post hoc test for group comparisons. **p=0.011, **p=0.0057, ***p=0.0083, ****p=0.049, *****p=0.022. (l) Representative confocal images and quantification (m) in the GCL of EdU, DCX, and NeuN. Scale bar = 100 µm. n=8 mice injected with PBS, 8 mice injected with AHP and IgG, and 7 mice injected with AHP and anti-VCAM1 mAb. Mean +/− SEM. One-way ANOVA with Tukey’s post hoc test for group comparisons. *p=0.0399 and p=0.0643(AMP+IgG vs. AMP+ anti-VCAM1 mAb). (n) Cell fate based on co-labeling of surviving EdU+ cells 4 weeks after EdU labeling of mice. Each bar represents 100% of EdU+ cells.
Fig. 6.
Fig. 6.. VCAM1 perturbation reverses age-related impairments and improves hippocampal-dependent learning and memory.
(a) Experimental design for anti-VCAM1. n=7 mice/group. (b) Representative confocal images of BrdU and Sox2 from the experiment described in Figure 6a. Arrows indicate proliferating NPCs. The white lines outline the SGZ. Scale bar = 100 µm. n=7 mice/group. (c) Representative confocal images of CD68, Iba1, and Hoechst from the experiment described in Figure 6a. Scale bar = 100 µm. n=7 mice/group. (d) Quantification in the DG of BrdU and Sox2. n=7 mice/group. Two-tailed Student’s t-test. Mean +/− SEM. *p=0.0341, **p=0.0027. (e) Quantification in the DG of CD68 and Iba1 from confocal images. n=7 mice/group. Mean +/− SEM. Two-tailed Student’s t-test. ***p=0.0005, **p=0.0026, *p=0.0354. (f) Experimental design for conditional deletion of Vcam1 in young (2-month-old) mice followed by aging them to 18 months. n=8 mice/group. (g) Quantification of total BrdU+ proliferating cells, and BrdU+Sox2+ neural progenitor cells in the DG of immunostained sections. n=8 mice/group. Mean +/−SEM. Two-tailed Student’s t-test. **p=0.0075, *p=0.0263. (h) Quantification in the DG of CD68 and Iba1. Hoechst labels cell nuclei. n=8 mice/group. Mean +/−SEM. Two-tailed Student’s t-test. **p=0.0068, *p=0.0169. (i) Days 1–5 escape latency from Barnes Maze and (j) percent time spent exploring objects in novel object placement task of IgG treated young adult C57BL6 mice (5-month-old; n=15) and IgG-treated aged mice (17-month-old; n=15) or anti-VCAM1 mAb treated aged mice (17-month-old; n=15). All mice received intraperitoneal injections every 3 days for 3 weeks prior to initiating behavior studies and throughout the duration of the studies; two-way repeated-measures ANOVA with Bonferroni’s post hoc test for time × group comparisons; One-way ANOVA with Tukey’s post hoc test for group comparisons; *p=0.0217, **p<0.01, ***p<0.001; ****p<0.0001; Mean +/− SEM. (k) Quantification of freezing behavior in Fear Conditioning Contextual trial with 23-month-old C57BL6 mice injected with anti-VCAM1 mAb or IgG every 3 days for one month. Average of trials 3–5 shown. n=7 PBS, n=12 IgG, n= 13 anti-Vcam1−treated mice per group. **p=0.0075, *p=0.0265. One-way ANOVA with Tukey’s post hoc test for group comparisons; Mean +/− SEM.

Comment in

References

References (Main Text)

    1. Wyss-Coray T Ageing, neurodegeneration and brain rejuvenation. Nature 539, 180–186 (2016). - PMC - PubMed
    1. Harry GJ Microglia during development and aging. Pharmacol Ther 139, 313–326 (2013). - PMC - PubMed
    1. Mosher KI & Wyss-Coray T Microglial dysfunction in brain aging and Alzheimer’s disease. Biochem. Pharmacol 88, 594–604 (2014). - PMC - PubMed
    1. Safaiyan S et al. Age-related myelin degradation burdens the clearance function of microglia during aging. Nat. Neurosci. 19, 995–998 (2016). - PMC - PubMed
    1. Ming GL & Song H Adult Neurogenesis in the Mammalian Brain: Significant Answers and Significant Questions. Neuron 70, 687–702 (2011). - PMC - PubMed

REFERENCES (Methods-only)

    1. Trapnell C et al. Differential analysis of gene regulation at transcript resolution with RNA-seq. Nat. Biotechnol 31, 46–53 (2013). - PMC - PubMed
    1. Engelhardt B, Vajkoczy P & Weller RO The movers and shapers in immune privilege of the CNS. Nat. Immunol 18, 123–131 (2017). - PubMed
    1. Banks WA From blood-brain barrier to blood-brain interface: New opportunities for CNS drug delivery. Nat. Rev. Drug Discov 15, 275–292 (2016). - PubMed
    1. Muggeo VMR Estimating regression models with unknown break-points. Stat. Med 22, 3055–71 (2003). - PubMed
    1. Muggeo VMR segmented: An R package to Fit Regression Models with Broken-Line Relationships. R News 8, 20–25 (2008).

Publication types

MeSH terms

Substances