. 2019 May 14;17(5):e3000245.
doi: 10.1371/journal.pbio.3000245. eCollection 2019 May.

Simple nutrients bypass the requirement for HLH-30 in coupling lysosomal nutrient sensing to survival

Affiliations

Simple nutrients bypass the requirement for HLH-30 in coupling lysosomal nutrient sensing to survival

John T Murphy et al. PLoS Biol. .

Abstract

Lysosomes are ubiquitous acidified organelles that degrade intracellular and extracellular material trafficked via multiple pathways. Lysosomes also sense cellular nutrient levels to regulate target of rapamycin (TOR) kinase, a signaling enzyme that drives growth and suppresses activity of the MiT/TFE family of transcription factors that control biogenesis of lysosomes. In this study, we subjected worms lacking basic helix-loop-helix transcription factor 30 (hlh-30), the Caenorhabditis elegans MiT/TFE ortholog, to starvation followed by refeeding to understand how this pathway regulates survival with variable nutrient supply. Loss of HLH-30 markedly impaired survival in starved larval worms and recovery upon refeeding bacteria. Remarkably, provision of simple nutrients in a completely defined medium (C. elegans maintenance medium [CeMM]), specifically glucose and linoleic acid, restored lysosomal acidification, TOR activation, and survival with refeeding despite the absence of HLH-30. Worms deficient in lysosomal lipase 2 (lipl-2), a lysosomal enzyme that is transcriptionally up-regulated in starvation in an HLH-30-dependent manner, also demonstrated increased mortality with starvation-refeeding that was partially rescued with glucose, suggesting a critical role for LIPL-2 in lipid metabolism under starvation. CeMM induced transcription of vacuolar proton pump subunits in hlh-30 mutant worms, and knockdown of vacuolar H+-ATPase 12 (vha-12) and its upstream regulator, nuclear hormone receptor 31 (nhr-31), abolished the rescue with CeMM. Loss of Ras-related GTP binding protein C homolog 1 RAGC-1, the ortholog for mammalian RagC/D GTPases, conferred starvation-refeeding lethality, and RAGC-1 overexpression was sufficient to rescue starved hlh-30 mutant worms, demonstrating a critical need for TOR activation with refeeding. These results show that HLH-30 activation is critical for sustaining survival during starvation-refeeding stress via regulating TOR. Glucose and linoleic acid bypass the requirement for HLH-30 in coupling lysosome nutrient sensing to survival.


Conflict of interest statement

None

Figures
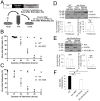
Fig 1
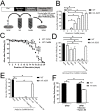
Fig 1. hlh-30 was necessary for survival during starvation and upon refeeding, and starvation promotes HLH-30 nuclear localization.
(A) Schematic depicting starvation and refeeding assay. Gravid adults were bleached with alkaline hypochlorite to obtain eggs, which were transferred to buffered salt solution (M9). Upon hatching, larvae arrest development at the L1 stage. Aliquots of starved L1 worms were placed on NGM dishes seeded with E. coli (OP50), and worms were immediately scored as alive or dead based on spontaneous movement; the fraction alive were defined as “Alive After Starvation.” After two days, worms were again scored as alive or dead based on spontaneous movement; the fraction alive compared to two days previously were defined as “Alive After Refeeding.” Because “Alive After Starvation” and “Alive After Refeeding” are calculated using different denominators, either value may be higher. (B, C) WT and hlh-30(lf) worms were analyzed after variable periods of starvation (N = 4 biological replicates with 50 worms/time point; values indicate mean ± SEM). *P < 0.05 by post hoc test for comparison between the two genotypes at the indicated time points following two-way ANOVA. (D, E) Animals that overexpress RFP fused to WT hlh-30(oe) or to hlh-30(mNLS)(oe) were analyzed at the L1 stage in the fed state or after 33 hours of starvation. Protein extracts were separated to obtain cyto and nuc fractions. Representative immunoblots (above) illustrate protein levels, and quantification of HLH-30 levels in the cytosol (normalized to GAPDH levels, fed state set equal to 1.0) and nucleus (normalized to Histone H3 levels, fed state set equal to 1.0) are shown below. N = 3 biological replicates/group. Bars indicate mean ± SEM. *P < 0.05 by t test. Lanes 1 and 2 of the immunoblot in panel D contain extracts from WT worms lacking RFP expression and document the specificity of RFP detection. (F) WT, hlh-30(lf), hlh-30(oe), and hlh-30(mNLS)(oe) worms were analyzed after 33 hours of starvation for “Alive after Refeeding.” N = 3 biological replicates/group of approximately 50 worms. Bars indicate mean ± SEM. *P < 0.05 by post hoc test after one-way ANOVA. Raw data for B–F are in S1 Data. cyto, cytoplasmic; GAPDH, glyceraldehyde 3-phosphase dehydrogenase; hlh-30, basic helix–loop–helix transcription factor 30; hlh-30(mNLS)(oe), overexpressed HLH-30 with a mutant nuclear localization signal; hlh-30(lf), loss-of-function tm1978 mutation hlh-30; hlh-30(oe), overexpressed HLH-30; L1, first larval stage; NGM, nematode growth medium; nuc, nuclear; RFP, red fluorescent protein; SEM, standard error of the mean; WT, wild type.
Fig 2
Fig 2. CeMM rescued impaired survival in starved hlh-30(lf) worms.
(A) Schematic depicting the starvation/refeeding protocol with the addition of a variable period of CeMM exposure after starvation in M9 and before transfer to NGM dishes with E. coli OP50 (see Fig 1A legend for details). (B) WT and hlh-30(lf) worms were analyzed after 33 hours of starvation and variable periods of CeMM exposure followed by 48 hours on E. coli OP50 as “Alive after Refeeding.” N = 3 biological replicates with 50 worms/time point for all experiments. Bars indicate mean ± SEM. *P < 0.05 compared to the WT by post hoc test after one-way ANOVA. (C) WT worms were starved for the indicated duration of time (on the y-axis) and refed with E. coli OP50 or CeMM and analyzed for “Alive after Refeeding,” as described in in the legend for Fig 1A. N = 3 biological replicates with approximately 50 worms/time. Values indicate mean ± SEM. *P < 0.05 by post hoc test after two-way ANOVA. (D, E) WT and hlh-30(lf) worms were analyzed after 33 hours of starvation and 15 hours of exposure to modified formulations of CeMM followed by 48 hours on E. coli OP50 as “Alive after Refeeding.” For removal experiments (panel D), otherwise complete CeMM was prepared lacking heme, AAs, β-sito in Tween 80, Glu, or NAs. For addition experiments (panel E), CeMM minimal solution lacking Glu, β-sito in Tween 80, AAs, and NAs was supplemented with individual nutrients. N = 3 biological replicates with 50 worms/time point for all experiments. Bars indicate mean ± SEM. *P < 0.05 compared to WT by post hoc test after one-way ANOVA. (F) WT and hlh-30(lf) worms were analyzed for “Alive after Refeeding” after 33 hours of starvation and 48 hours of refeeding with standard E. coli OP50 or E. coli OP50 supplemented with glucose and Tween 80. Bars indicate mean ± SEM. N = 3 biological replicates/group with approximately 50 worms/condition. *P < 0.05 by post hoc test after two-way ANOVA. Raw data for B–F are in S1 Data. AA, amino acid; CeMM, C. elegans maintenance medium; Glu, glucose; hlh-30, basic helix–loop–helix transcription factor 30; hlh-30(lf), loss-of-function tm1978 mutation hlh-30; NA, nucleic acid; NGM, nematode growth medium; SEM, standard error of the mean; WT, wild type; β-sito, β-sitosterol.
Fig 3
Fig 3. Metabolomic profiling reveals linoleic acid, a CeMM component, as essential for rescue of starved hlh-30(lf) worms.
(A) hlh-30(lf) worms were analyzed after 33 hours of starvation and 15 hours of exposure to modified formulations of CeMM, followed by 48 hours on E. coli OP50 (as in Fig 2A). CeMM minimal solution lacking glucose, β-sitosterol in Tween 80, amino acids, and nucleic acids was supplemented with glucose and individual nutrients shown below. N = 3 replicates of 50 worms each. A mixture of BSA and ethanol was used to solubilize fatty acids and tested as a control (labeled as diluent). Bars indicate mean ± SEM. *P < 0.05 versus none and #P < 0.05 versus diluent by post hoc test after one-way ANOVA. (B–K) WT and hlh-30(lf) worms were subjected to 33 hours of starvation (St.) or worms were refed with CeMM for 15 hours following the 33 hours of starvation (CeMM). Abundance of 1-linoleoyl-GPC (B), linolenate (C, both α- and γ-linolenic acid, ALA or GLA), glucose (D), glucose-6-phosphate (E), maltose (F), and maltotriose (G) and tricarboxylic cycle metabolites, namely citrate (H), α-ketoglutarate (I), fumarate (J), and malate (K) was assessed as scaled intensity (please see Methods for details). N = 6 biological replicates/group. Bar and whisker indicate mean ± SEM. *P < 0.05 by post hoc test after two-way ANOVA. Raw data for A–K are in S1 Data. BSA, bovine serum albumin; CeMM, C. elegans maintenance medium; hlh-30, basic helix–loop–helix transcription factor 30; hlh-30(lf), loss-of-function tm1978 mutation hlh-30; linoleoyl-GPC, linoleoyl glycerolphosphocholine; SEM, standard error of the mean; WT, wild type.
Fig 4
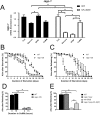
Fig 4. Worms deficient in lipl-2, an HLH-30 target gene, displayed starvation–refeeding mortality that was rescued by CeMM.
(A) lipl-2 mRNA abundance in au with values normalized to the control gene ama-1 determined by qPCR in L1 stage WT and hlh-30(lf) animals in the fed state (fed), after starvation for 33 hours (starved), and after starvation for 33 hours followed by refeeding on E. coli OP50 for 15 hours (OP50). N = 3 biological replicates/group. *P < 0.05 by post hoc test after two-way ANOVA. (B, C) “Alive after Starvation” (B) and “Alive after Refeeding” (C) as described in Fig 1A for lipl-2(lf) mutant animals and WT controls. *P < 0.05 versus WT by post hoc test after two-way ANOVA. (D) WT and lipl-2(lf) worms were analyzed after 10 days of starvation and 0 or 15 hours of complete CeMM exposure, followed by 48 hours on E. coli OP50. *P < 0.05 by post hoc test after two-way ANOVA. (E) Survival of hlh-30(lf) worms with lipl-2 overexpression (lipl-2(oe);hlh-30(lf)) and hlh-30(lf) (as controls) analyzed after 33 hours of starvation followed by exposure for 15 hours to CeMM minimal solution (lacking glucose, β-sitosterol in Tween 80, amino acids, and nucleic acids) supplemented with β-sitosterol in Tween 80 (lipids) or glucose, followed by 48 hours on E. coli OP50. Similarly modeled worms without exposure to CeMM are shown as control. *P < 0.05 by post hoc test after two-way ANOVA. N = 3 biological replicates/group with 50 worms/time point for panels B–D. Bars and values indicate mean ± SEM. Raw data for A–E are in S1 Data. ama-1, amanitin-binding subunit of RNA polymerase II; au, arbitrary unit; CeMM, C. elegans maintenance medium; hlh-30, basic helix–loop–helix transcription factor 30; hlh-30(lf), loss-of-function tm1978 mutation hlh-30; lipl-2, lysosomal lipase 2; lipl-2(lf), loss-of-function mutation lipl-2; lipl-2(oe);hlh-30(lf), hlh-30(lf) with overexpressed lipl-2; L1, first larval stage; qPCR, quantitative PCR; SEM, standard error of the mean; WT, wild type.
Fig 5
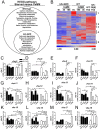
Fig 5. CeMM restored expression of vha genes in starved hlh-30(lf) mutants.
(A) Venn diagram depicting significantly regulated KEGG pathways (both up-regulated as well as down-regulated; see S5 Table for details) by RNAseq analysis in WT and hlh-30(lf) L1 worms starved for 33 hours followed by incubation in CeMM for 0 or 15 hours versus starved worms in respective groups. N = 2 biological replicates/group. (B) Unsupervised hierarchical clustering of significantly altered transcripts in WT and hlh-30(lf) L1 worms starved for 33 hours followed by incubation in CeMM for 0, 3, or 15 hours or their fed counterparts. N = 2/group. Lists of genes in rows marked as 1–5 are presented in S5 Table. (C–N) mRNA abundance in au with values normalized to the control gene ama-1 determined by qPCR for genes encoding for proton pump subunits (as named) in L1 stage WT and hlh-30(lf) animals in the fed state (fed), after starvation for 33 hours (starved), and after starvation for 33 hours followed by refeeding on E. coli OP50 or CeMM for 15 hours. N = 3–8 biological replicates/group. Bars indicate mean ± SEM. *P < 0.05 by post hoc test after two-way ANOVA. Raw data for C–N are in S1 Data. ama-1, amanitin-binding subunit of RNA polymerase II; au, arbitrary unit; CeMM, C. elegans maintenance medium; hlh-30, basic helix–loop–helix transcription factor 30; hlh-30(lf), loss-of-function tm1978 mutation hlh-30; KEGG, Kyoto Encyclopedia of Genes and Genomes; L1, first larval stage; qPCR, quantitative PCR; RNAseq, RNA sequencing; SEM, standard error of the mean; vha, vacuolar H+-ATPase; WT, wild type.
Fig 6
Fig 6. CeMM bypasses hlh-30 to restore lysosome acidification and TOR activation and confer survival in hlh-30(lf) worms.
(A, B) Representative fluorescence images (A) with quantification of fluorescence intensity (B) of LysoTracker Red staining. WT and hlh-30(lf) L1 worms were analyzed in the fed state (Fed) or after 33 hours of starvation (Starved) followed by 15 hours on E. coli OP50-seeded NGM dishes (OP50) or 15 hours of incubation in CeMM (CeMM). Scale bar is 20 μm. For panel B, WT fed value was set equal to 1.0, and other values were normalized to this value. N = 8–23 worms/condition. *P < 0.05 for comparisons as indicated by post hoc test after one-way ANOVA. #P < 0.05 versus respective fed state by post hoc test after two-way ANOVA. (C) Representative immunoblot (top) and quantification (bottom) of LMP-1 protein abundance (normalized to β-ACTIN as a loading control) in WT and hlh-30(lf) L1 worms cultured as described in A. WT fed value was set = 1.0. N = 5–7 biological replicates/group. *P < 0.05 for comparisons as indicated by post hoc test after two-way ANOVA. #P < 0.05 versus the respective fed state by post hoc test after one-way ANOVA. (D) Measurement of “Alive after Refeeding” as in Fig 1A in WT and hlh-30(lf) worms starved as L1 stage larvae for 33 hours, then transferred to CeMM for 15 hours in the presence of Con A or Baf-A1 with DMSO as control (depicted as “–”), and transferred to E. coli OP50 dishes. DMSO concentrations employed to dissolve Con A and Baf-A1 were 0.34% and 1.2%, respectively. N = 4–5 biological replicates/group. *P < 0.05 by post hoc test after two-way ANOVA. (E) Assessment of “Alive after Refeeding” in WT and hlh-30(lf) worms starved as L1 stage larvae for 33 hours, transferred to CeMM containing dsRNA targeting nhr-31, vha-12, or L4440 as control for 15 hours, and transferred to E. coli OP50 dishes for 48 hours. N = 4–9 biological replicates/group. *P < 0.05 by post hoc test after two-way ANOVA. (F) “Alive after Refeeding” measured as described in Fig 1A in WT and hlh-30(lf) worms starved as L1 stage larvae for 33 hours, then transferred to CeMM for 15 hours in the presence of rapamycin with DMSO (100%, employed as diluent; indicated as “–”) followed by transfer to E. coli OP50 dishes containing rapamycin. N = 6 biological replicates/group. *P < 0.05 by post hoc test after two-way ANOVA. In all cases, bars indicate mean ± SEM. Raw data for B–F are in S1 Data. Baf-A1, bafilomycin A1; CeMM, C. elegans maintenance medium; Con A, concanamycin A; dsRNA, double-stranded RNA; hlh-30, basic helix–loop–helix transcription factor 30; hlh-30(lf), loss-of-function tm1978 mutation hlh-30; LMP-1, lysosome membrane protein 1; L1, first larval stage; NGM, nematode growth medium; nhr-31, nuclear hormone receptor 31; RNAi, RNA interference; SEM, standard error of the mean; TOR, target of rapamycin; vha, vacuolar H+-ATPase; WT, wild type.
Fig 7
Fig 7. ragc-1–deficient worms were sensitive to starvation–refeeding stress, and ragc-1 overexpression rescued hlh-30(lf).
(A) ragc-1 mRNA abundance in au with values normalized to the control gene ama-1 determined by qPCR in L1 stage WT and hlh-30(lf) animals in the fed state (fed), after starvation for 33 hours (starved), and after starvation for 33 hours followed by refeeding on E. coli OP50 or CeMM for 15 hours. N = 6 biological replicates/group. *P < 0.05 by post hoc test after two-way ANOVA. (B, C) WT and ragc-1(lf) worms were analyzed for “Alive after Starvation” (B) and “Alive after Refeeding” (C) as described in the legend for Fig 1A. N = 3 biological replicates with approximately 50 worms/time point. *P < 0.05 by post hoc test after two-way ANOVA. (D) WT and ragc-1(lf) L1 stage worms were starved for 11 days and transferred to CeMM for 0 or 15 hours, followed by transfer to E. coli OP50-seeded NGM dishes for 48 hours. “Alive after Refeeding” was determined as described in the Fig 1 legend. N = 3 biological replicates/group with approximately 50 worms/time point. *P < 0.05 by post hoc test after two-way ANOVA. (E) “Alive after Refeeding” was measured as described in Fig 1A. A homogenous population of WT, hlh-30(lf), and hlh-30(lf);amEx324 (ragc-1(oe);hlh-30(lf)) worms that overexpress ragc-1 from an extrachromosomal array were starved in M9 for 36 hours as L4 stage larvae, transferred to E. coli OP50-seeded NGM dishes, and scored for survival after 72 hours. N = 4 biological replicates. *P < 0.05 by post hoc test after two-way ANOVA. Bars and values indicate mean ± SEM. Raw data for A–E are in S1 Data. ama-1, amanitin-binding subunit of RNA polymerase II; au, arbitrary unit; CeMM, C. elegans maintenance medium; hlh-30, basic helix–loop–helix transcription factor 30; hlh-30(lf), loss-of-function tm1978 mutation hlh-30; ragc-1(oe);hlh-30(lf), hlh-30(lf) worms that overexpress ragc-1 from an extrachromosomal array; L1, first larval stage; L4, fourth larval stage; NGM, nematode growth medium; qPCR, quantitative PCR; ragc-1, the ortholog for mammalian RagC/D GTPases; ragc-1(lf), loss-of-function mutation ragc-1; SEM, standard error of the mean; WT, wild type.
Fig 8
Fig 8. Schematic depicting pathways whereby simple nutrients bypass hlh-30 to promote survival under starvation conditions.
Under starvation stress, wild-type worms activate hlh-30–dependent expression of target genes such as lipl-2 (a lysosomal lipase) via inducing cytosol to nuclear translocation of HLH-30 (top panel). lipl-2 induction plays a critical role in starvation survival. Refeeding with E. coli OP50 triggers increased ragc-1 transcript levels, which couple nutrient sensing on acidified lysosomes and TOR activation to survival (top panel). In starved hlh-30–deficient worms, lack of HLH-30–induced transcription impairs lipl-2 up-regulation and is accompanied by reduced ragc-1 levels upon refeeding (middle panel). Starved hlh-30–deficient worms demonstrate marked energy deficiency with decreased lysosome abundance, leading to death despite refeeding with E. coli OP50 (middle panel). Refeeding starved hlh-30–deficient worms with CeMM provides simple nutrients, namely glucose and linoleic acid, which restore ATP levels and induce nhr-31–mediated vha gene transcription (bottom panel). CeMM refeeding also restores ragc-1 expression and lysosome acidification and abundance and sustains survival with subsequent E. coli OP50 feeding (bottom panel). Impaired TOR activation with rapamycin treatment and loss of ragc-1 prevent nutrient sensing to TOR upon refeeding following starvation, and rapamycin prevents CeMM rescue in starved hlh-30–deficient worms. Horizontal black arrows indicate causal relation. Horizontal dotted arrows indicate transition from starvation to refeeding. Upward arrows indicate increased levels. Red cross marks indicate absence of the indicated event. CeMM, C. elegans maintenance medium; hlh-30, basic helix–loop–helix transcription factor 30; hlh-30(lf), loss-of-function tm1978 mutation hlh-30; lipl-2, lysosomal lipase 2; nhr-31, nuclear hormone receptor 31; ragc-1, the ortholog for mammalian RagC/D GTPases; TOR, target of rapamycin.

Comment in

  • Surviving starvation simply without TFEB.
    Soukas AA, Zhou B. Soukas AA, et al. PLoS Biol. 2019 May 28;17(5):e3000285. doi: 10.1371/journal.pbio.3000285. eCollection 2019 May. PLoS Biol. 2019. PMID: 31136567 Free PMC article.

References

    1. Sardiello M, Palmieri M, di RA, Medina DL, Valenza M, Gennarino VA, et al. A gene network regulating lysosomal biogenesis and function. Science. 2009;325(5939):473–7. 10.1126/science.1174447 - DOI - PubMed
    1. Martina JA, Diab HI, Lishu L, Jeong AL, Patange S, Raben N, et al. The nutrient-responsive transcription factor TFE3 promotes autophagy, lysosomal biogenesis, and clearance of cellular debris. Science signaling. 2014;7(309):ra9 10.1126/scisignal.2004754 . - DOI - PMC - PubMed
    1. Settembre C, De CR, Mansueto G, Saha PK, Vetrini F, Visvikis O, et al. TFEB controls cellular lipid metabolism through a starvation-induced autoregulatory loop. NatCell Biol. 2013;15(6):647–658. 10.1038/ncb2718 Epub 2013 Apr 21. - DOI - PMC - PubMed
    1. Settembre C, Di MC, Polito VA, Garcia AM, Vetrini F, Erdin S, et al. TFEB links autophagy to lysosomal biogenesis. Science. 2011;332(6036):1429–33. 10.1126/science.1204592 - DOI - PMC - PubMed
    1. Saxton RA, Sabatini DM. mTOR Signaling in Growth, Metabolism, and Disease. Cell. 2017;168(6):960–76. 10.1016/j.cell.2017.02.004 . - DOI - PMC - PubMed

Publication types

MeSH terms