. 2019 May 14;14(5):e0216600.
doi: 10.1371/journal.pone.0216600. eCollection 2019.

Facilitating public and patient involvement in basic and preclinical health research

Affiliations

Facilitating public and patient involvement in basic and preclinical health research

James Maccarthy et al. PLoS One. .

Abstract

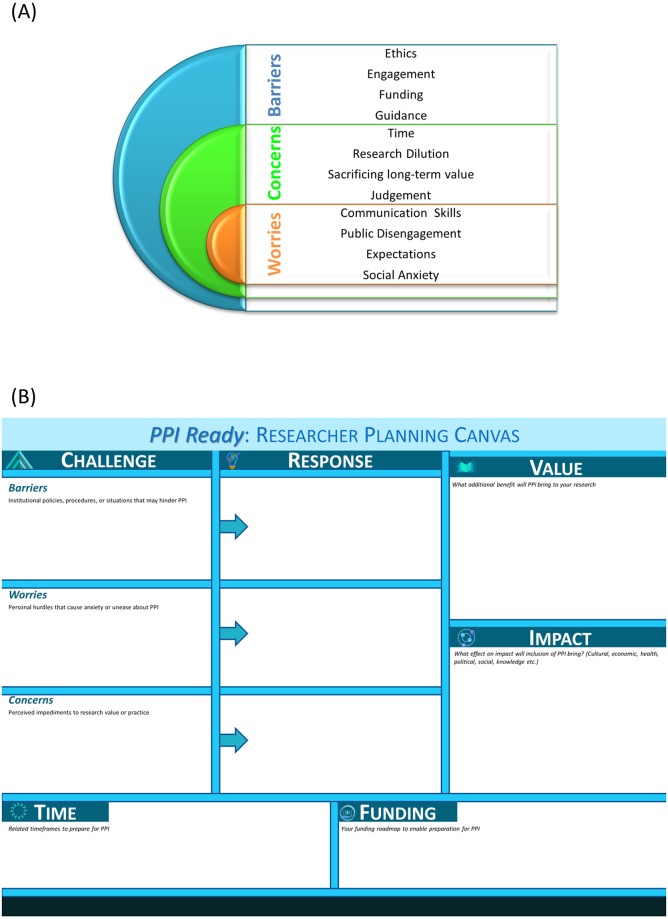
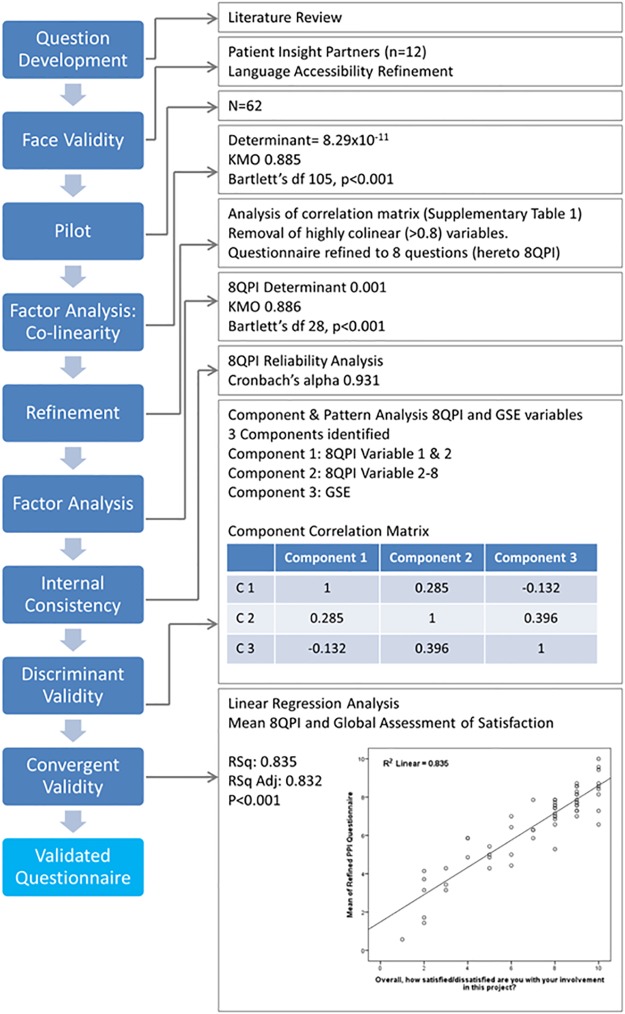
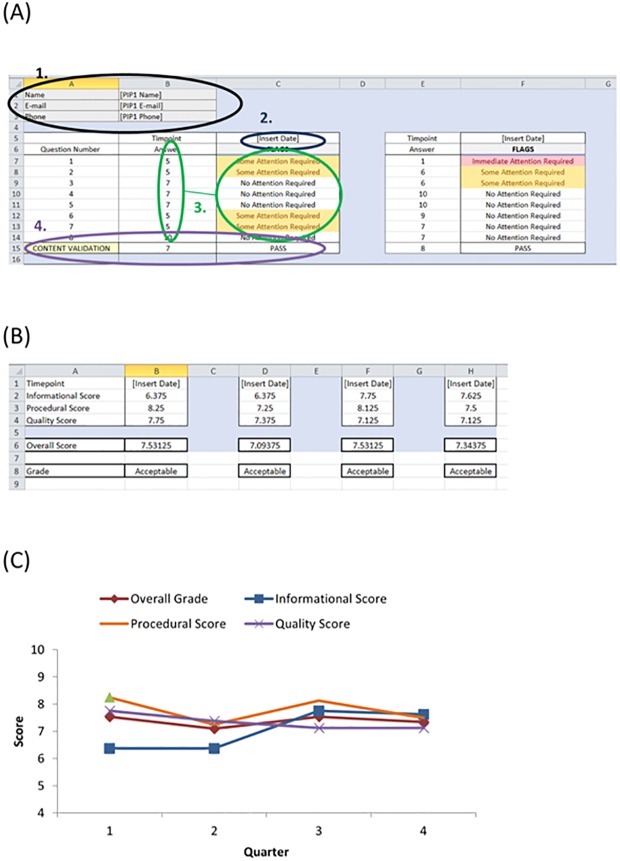
Involving patients in research broadens a researcher's field of influence and may generate novel ideas. Preclinical research is integral to the progression of innovative healthcare. These are not patient-facing disciplines and implementing meaningful public and patient involvement (PPI) can be a challenge. A discussion forum and thematic analysis identified key challenges of implementing public and patient involvement for preclinical researchers. In response we developed a "PPI Ready" planning canvas. For contemporaneous evaluation of public and patient involvement, a psychometric questionnaire and an open source tool for its evaluation were developed. The questionnaire measures information, procedural and quality assessment. Combined with the open source evaluation tool, researchers are notified if public and patient involvement is unsatisfactory in any of these areas. The tool is easy to use and adapts a psychometric test into a format familiar to preclinical scientists. Designed to be used iteratively across a research project, it provides a simple reporting grade to document satisfaction trend over the research lifecycle.


Conflict of interest statement

The authors have declared that no competing interests exist.

Figures

Fig 1
Fig 1. Key challenges hindering PPI and a tool for researchers to develop strategies to overcome these challenges.
(A) Thematic analysis of a researcher discussion forum with preclinical researchers identified key challenges in the implementation and adoption of PPI into research practice. (B) A visual design tool based on the business model canvas, which we’ve called PPI Ready: Researcher Planning Canvas was developed to aid the individual researcher to explore their personal barriers to adopting PPI and map a strategy to overcome or circumvent them.
Fig 2
Fig 2. Development of the PPI assessment survey (PAS).
Questions were adapted from the literature and reviewed by a PIP cohort of n = 12 for face validity, relevance, jargon use, comprehension and language and format accessibility. Question wording and scale were refined in response and reassessed by a subset of the PIP cohort. The refined questionnaire and the general self-efficacy scale (GSE) were piloted on a cohort of patients and public that had attended a research involvement or engagement event. N = 60 responses passed the consent check. Oblique factor analysis identified co-linearity between PPI questions which lead to question exclusion based on quantitative analysis and informed by qualitative input for PIPs. The refined questionnaire passed content validity analysis, including, internal validity, discriminant and convergent validity analysis.
Fig 3
Fig 3. PAS assessment tool.
A preformatted excel file with embedded analysis formula is available for use with the PAS. (A) Tab 1 of the excel file is the data input tab. The PIP details are entered in (1). The date is entered in (2). The responses to the PAS survey are entered in (3) and the flagging system is automatically generated. The PAS scores can be entered manually or can be updated via a linked excel file sent directly to the PIP(s). (4) The GSE score should be within two standard errors of the mean PPI scores (Q1-8). If not, a FAIL flag is generated and caution is advised in the interpretation of results. (B) Tab 2 is the output summary. It summarises the scores for each value category across all PIPs for each given time point and also generates an overall score and grade. (C) The scores can be plotted over time to visualise the PPI satisfaction trend. As illustrated, the overall score is relatively flat, but plotting of each value score illustrates that the informational assessment required attention and improved upon implementation of changes (after the second quarter) to increase clarity in communications.

References

    1. Moses H iii, Matheson DM, Cairns-Smith S, George BP, et al. (2015) The anatomy of medical research: Us and international comparisons. JAMA 313: 174–189. 10.1001/jama.2014.15939 - DOI - PubMed
    1. Ireland HRBo (2015) Ireland: Research. Evidence. Action. HRB Strategy 2016–2020. Ireland: HRB.
    1. van Thiel GS, Pieter (2013) Priorities medicines for Europe and the world "A public health approach to innovation". World Health Organization.
    1. Richards T, Snow R, Schroter S (2016) Co-creating health: more than a dream. BMJ 354. - PubMed
    1. Institute P-COR (2015) What we mean by engagement USA: PCORI.

Publication types