. 2019 May 8;2019(1):niz004.
doi: 10.1093/nc/niz004. eCollection 2019.

Confidence modulates exploration and exploitation in value-based learning

Affiliations

Confidence modulates exploration and exploitation in value-based learning

Annika Boldt et al. Neurosci Conscious. .

Abstract

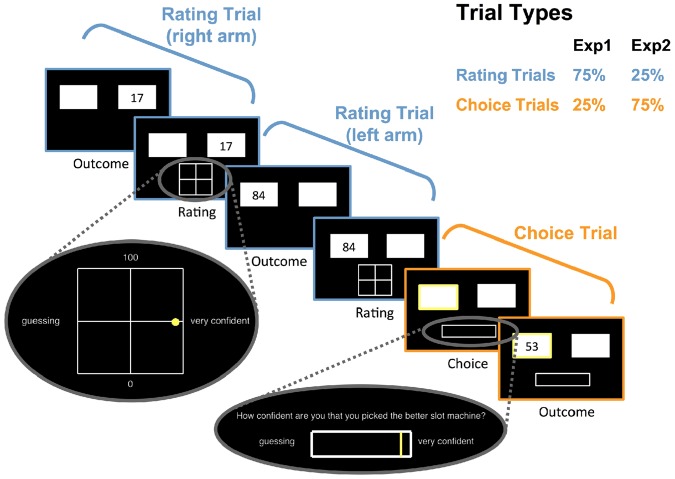
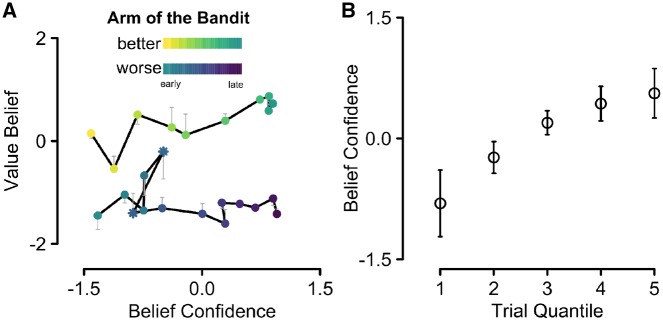
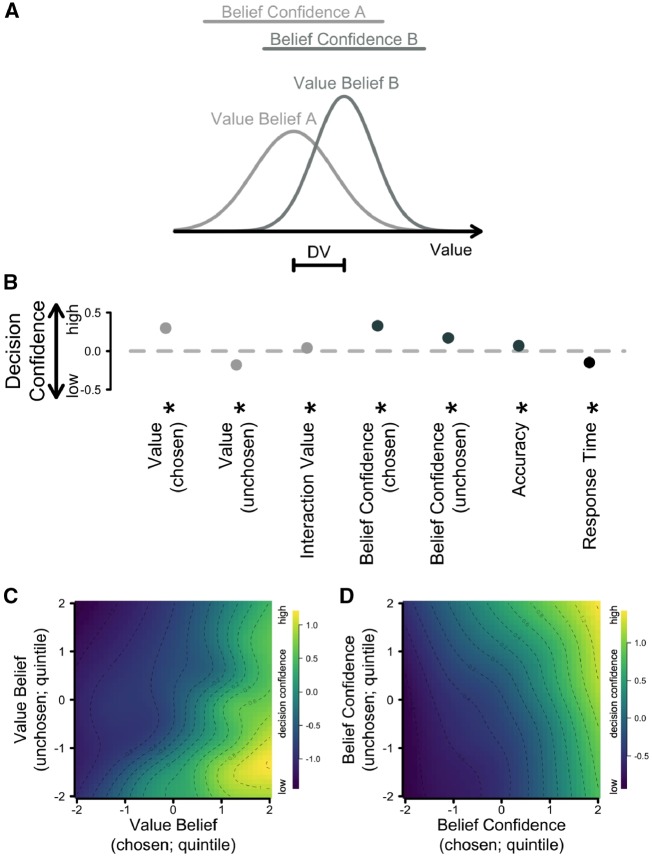
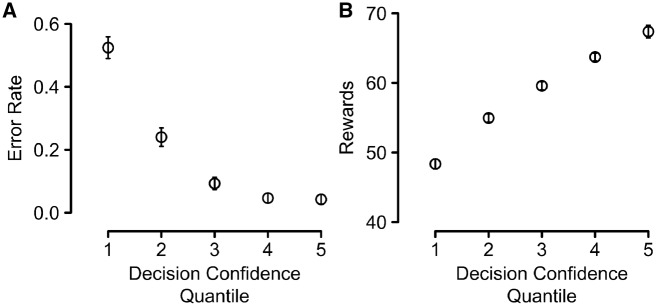
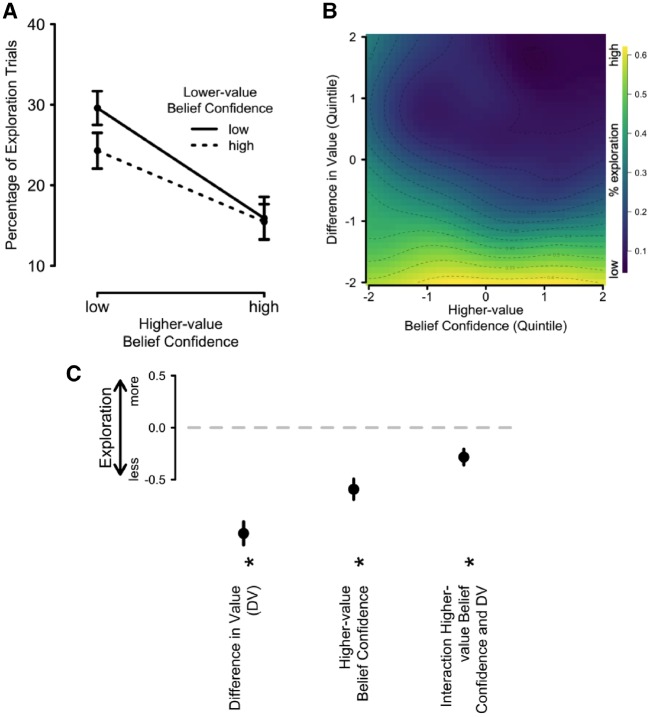
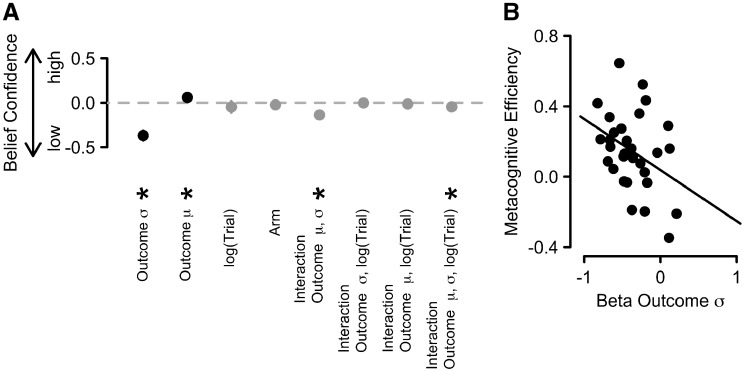
Uncertainty is ubiquitous in cognitive processing. In this study, we aim to investigate the ability agents possess to track and report the noise inherent in their mental operations, often in the form of confidence judgments. Here, we argue that humans can use uncertainty inherent in their representations of value beliefs to arbitrate between exploration and exploitation. Such uncertainty is reflected in explicit confidence judgments. Using a novel variant of a multi-armed bandit paradigm, we studied how beliefs were formed and how uncertainty in the encoding of these value beliefs (belief confidence) evolved over time. We found that people used uncertainty to arbitrate between exploration and exploitation, reflected in a higher tendency toward exploration when their confidence in their value representations was low. We furthermore found that value uncertainty can be linked to frameworks of metacognition in decision making in two ways. First, belief confidence drives decision confidence, i.e. people's evaluation of their own choices. Second, individuals with higher metacognitive insight into their choices were also better at tracing the uncertainty in their environment. Together, these findings argue that such uncertainty representations play a key role in the context of cognitive control.

Keywords: confidence; exploration–exploitation dilemma; metacognition; uncertainty; value-based choice.


Figures

Figure 1.
Figure 1.
Schematic representation of the task structure, showing a typical sequence of trials: people were faced with both rating (blue) and choice (orange) trials. During rating trials, they observed outcomes randomly from one arm of the two-armed bandit, represented as squares. Participants then rated the average value of this arm and their confidence in this value-belief estimate on a 2D grid. During choice trials, participants freely chose one arm of the bandit, rated their confidence in this decision and were then shown the reward. In Experiment 1, 75% of trials were rating trials and 25% trials were choice trials, with both trial types intermixed randomly. In Experiment 2, these proportions were reversed.
Figure 2.
Figure 2.
(A) Average traces of participants’ value belief and belief confidence ratings, given on the 2D grid scale for one example block. All ratings are z-transformed within-subject and then averaged across participants to reduce inter-individual differences in the use of the rating scales. The arm with the objectively higher rewards is shown in yellow to green (shown on 10 trials out of the block, corresponding to one data point each) and the other arm in blue to purple hues (shown on 14 trials out of the block, corresponding to one data point each). The brightness reflects the position of the data points within with block with brighter (yellow or blue) hues representing the earlier trials. The hairline arrows reflect the mean reward, calculated from the observed outcomes (objective mean value of the past outcomes). The length of the arrows is therefore proportional to the estimation error with longer arrows reflecting worse value estimates. (B) Belief confidence increased over blocks: the x-axis shows trial quintiles, calculated within each block ranging from the first (1) to the last (5) fifth of trials in each block. Belief confidence was z-transformed within-subject and then averaged across participants. The error bars reflect ±1 SEM.
Figure 3.
Figure 3.
Hierarchical regression model used to predict decision confidence. (A) Schematic figure showing the noisy value representation for two objects. For the purpose of simplicity, each value belief is represented as a normal distribution with a mean (value belief) and a standard deviation (belief confidence). For these two overlapping choice options, Option B has a higher value than Option A, and also a more precise value representation (higher belief confidence). (B) Standardized, fixed regression coefficients from a hierarchical, linear regression model. Positive, higher parameter estimates reflect that an increment in this variable led to an increment in decision confidence. The error bars, which are almost entirely hidden behind the disks, reflect ±1 SEM. The light gray disks represent predictors linked to value, the dark gray disks represent predictors linked to belief confidence, and the black disks represent control variables. (C and D) Depict the influence of the key predictors on decision confidence for both value belief (C) and belief confidence (D). Lighter colors reflect higher levels of decision confidence. DV = difference in value.
Figure 4.
Figure 4.
(A) Error rates and (B) average points won as a function of decision confidence. The data were binned according to decision confidence quintiles, which were formed within-subject. Errors are defined as trials on which people deviated from the ideal-observer model, i.e. trials on which they chose the arm of the bandit with so far the lower average in observed outcomes. All error bars are ±1 SEM for the respective y-axis values.
Figure 5.
Figure 5.
(A) Proportion of trials in which participants chose the lower-value option (exploration), as a function of the belief confidence of the higher- and lower-value options. (B) Proportion of trials in which participants chose the lower-value option (exploration trials), as a function of the belief confidence of the higher-value option and the DV. The dependent measure (exploration) is reflected in the color on the simulated grid, with lighter colors reflecting more exploration trials. (C) Standardized, fixed regression coefficients from a mixed-model logistic regression model, predicting exploration. Positive, stronger parameter estimates reflect that an increase in this variable led to a larger tendency to explore. All error bars reflect ±1 SEM. DV = difference in value.
Figure 6.
Figure 6.
(A) Standardized, fixed regression coefficients from a hierarchical, linear regression model. Positive parameter estimates reflect that an increment in this variable led to an increment in belief confidence. The error bars, which are almost entirely hidden behind the disks, reflect ±1 SEM. The black disks represent predictors linked to the observed outcomes and the gray disks represent control variables and interaction effects. (B) Regression weights for the variance of past outcomes (ideal-observer model confidence) for each participant plotted against their metacognitive efficiency. σ = standard deviation; μ = mean.

References

    1. Audley RJ. A stochastic model for individual choice behavior. Psychol Rev 1960;67:1–15. - PubMed
    1. Bach DR, Dolan RJ.. Knowing how much you don’t know: a neural organization of uncertainty estimates. Nat Rev Neurosci 2012;13:572–86. - PubMed
    1. Badre D, Doll BB, Long NM, et al.Rostrolateral prefrontal cortex and individual differences in uncertainty-driven exploration. Neuron 2012;73:595–607. - PMC - PubMed
    1. Bahrami B, Olsen K, Latham PE, et al.Optimally interacting minds. Science 2010;329:1081–5. - PMC - PubMed
    1. Bang D, Fleming SM.. Distinct encoding of decision confidence in human medial prefrontal cortex. Proc Natl Acad Sci 2018;115:6082–7. - PMC - PubMed