. 2019 Sep 24;70(18):4903-4918.
doi: 10.1093/jxb/erz217.

The mitogen-activated protein kinase 4-phosphorylated heat shock factor A4A regulates responses to combined salt and heat stresses

Affiliations

The mitogen-activated protein kinase 4-phosphorylated heat shock factor A4A regulates responses to combined salt and heat stresses

Norbert Andrási et al. J Exp Bot. .

Erratum in

Abstract

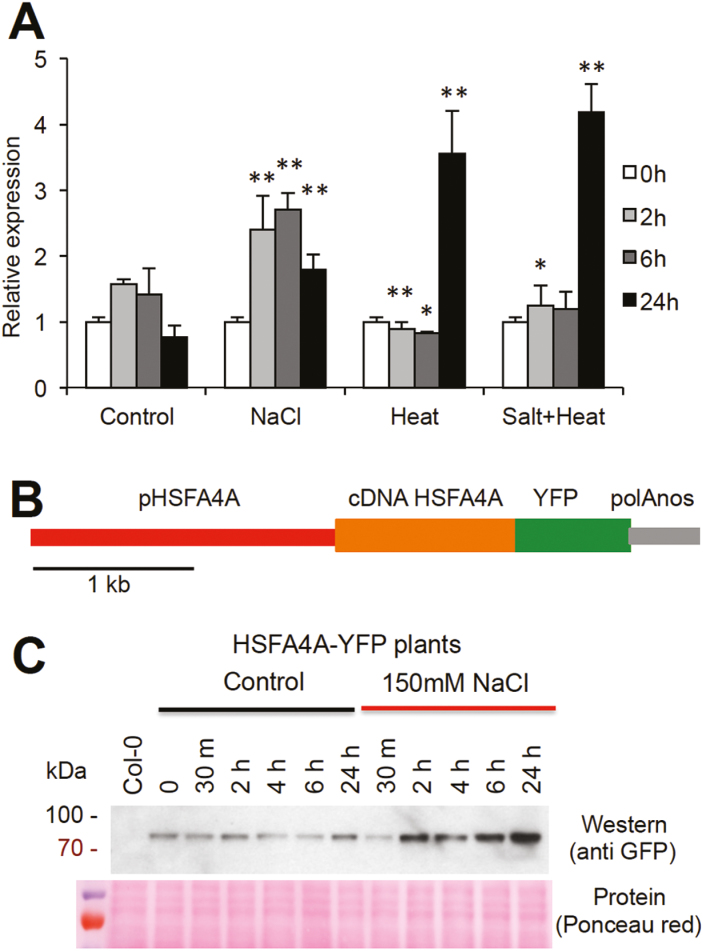
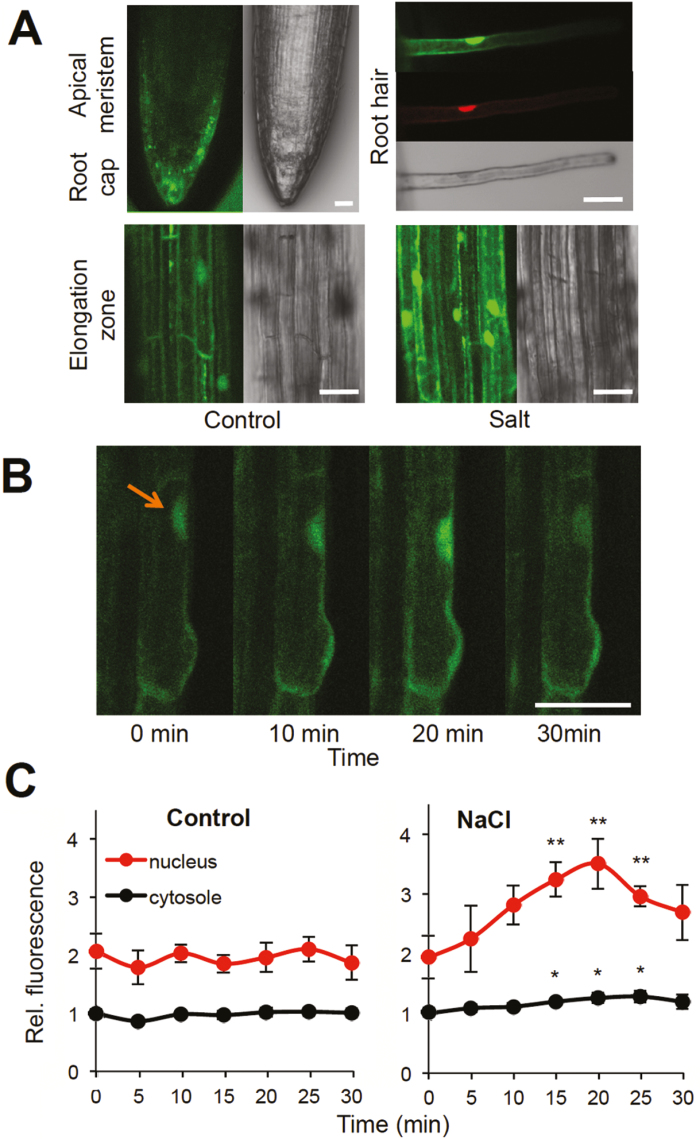
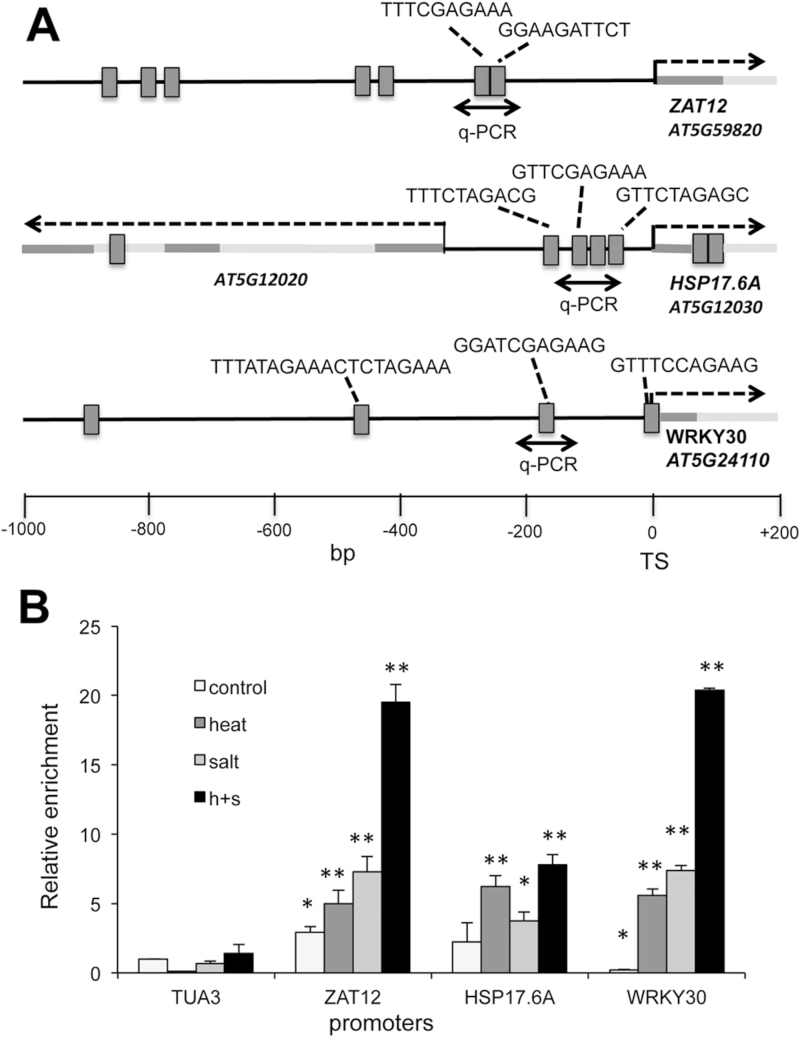
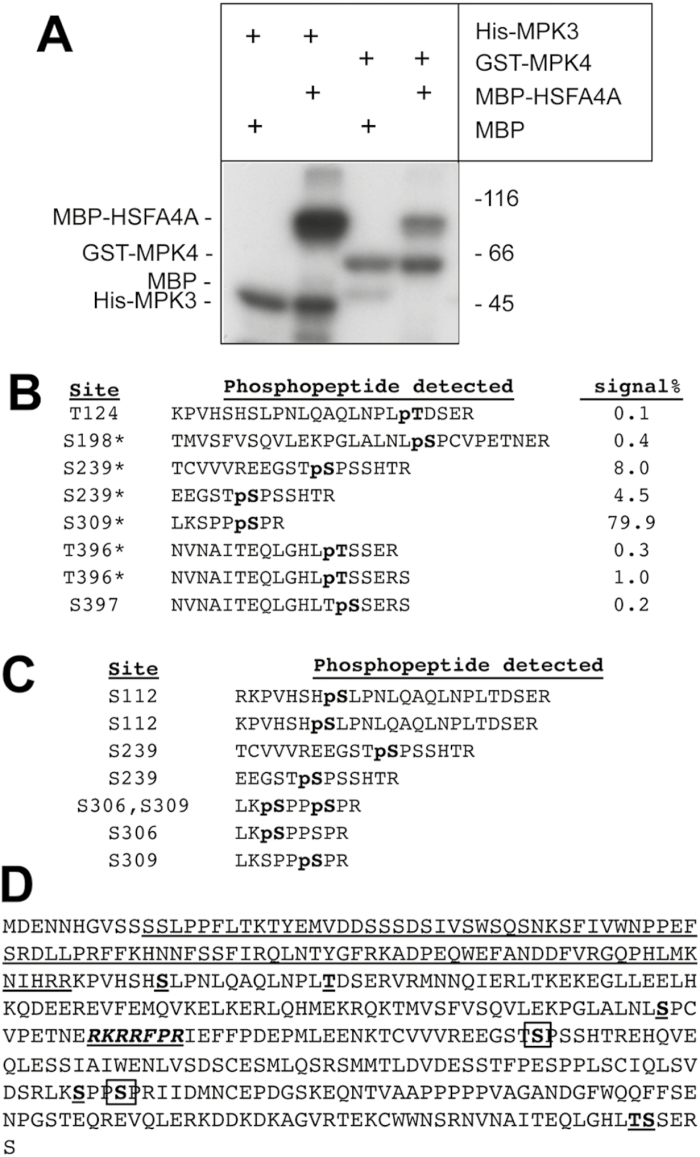
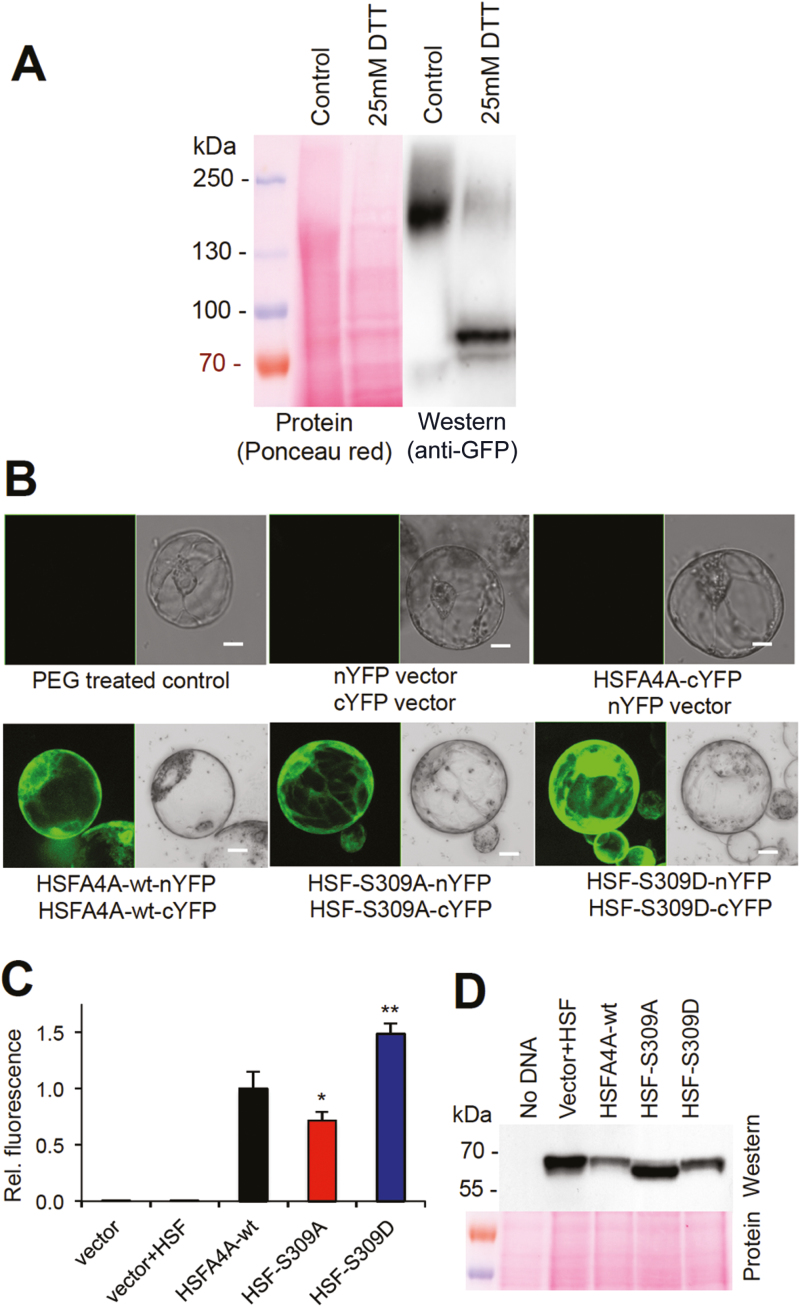
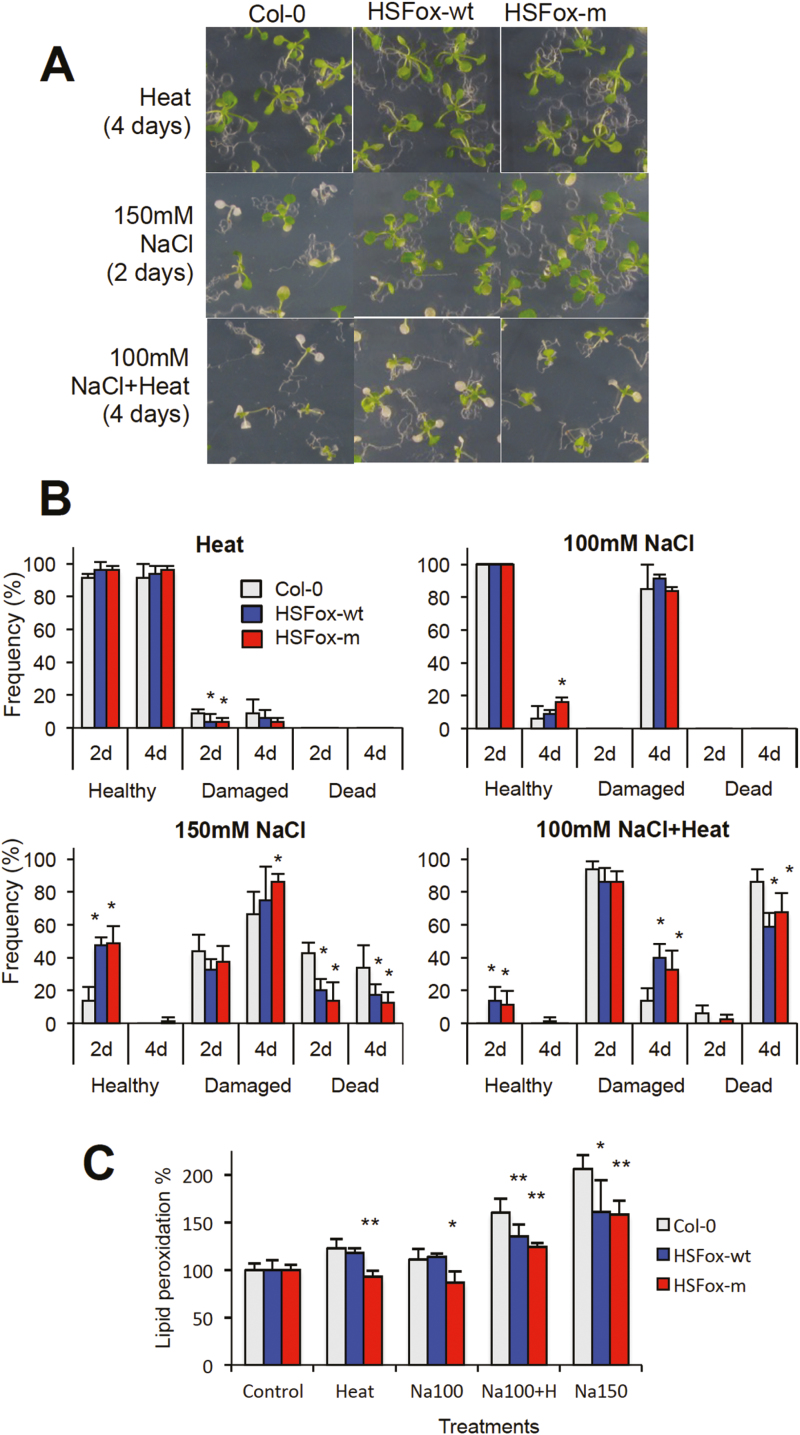
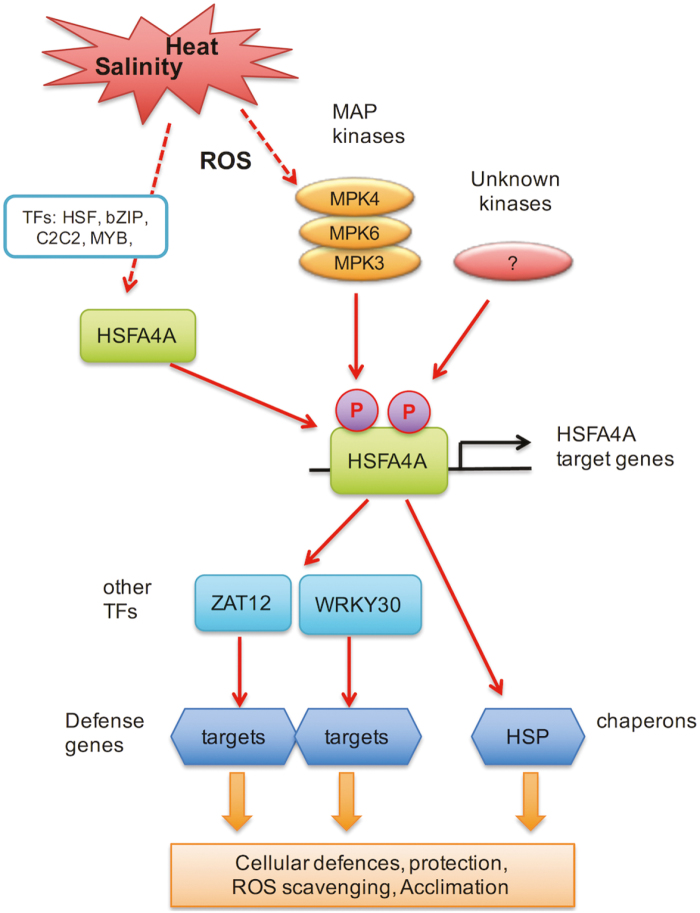
Heat shock factors regulate responses to high temperature, salinity, water deprivation, or heavy metals. Their function in combinations of stresses is, however, not known. Arabidopsis HEAT SHOCK FACTOR A4A (HSFA4A) was previously reported to regulate responses to salt and oxidative stresses. Here we show, that the HSFA4A gene is induced by salt, elevated temperature, and a combination of these conditions. Fast translocation of HSFA4A tagged with yellow fluorescent protein from cytosol to nuclei takes place in salt-treated cells. HSFA4A can be phosphorylated not only by mitogen-activated protein (MAP) kinases MPK3 and MPK6 but also by MPK4, and Ser309 is the dominant MAP kinase phosphorylation site. In vivo data suggest that HSFA4A can be the substrate of other kinases as well. Changing Ser309 to Asp or Ala alters intramolecular multimerization. Chromatin immunoprecipitation assays confirmed binding of HSFA4A to promoters of target genes encoding the small heat shock protein HSP17.6A and transcription factors WRKY30 and ZAT12. HSFA4A overexpression enhanced tolerance to individually and simultaneously applied heat and salt stresses through reduction of oxidative damage. Our results suggest that this heat shock factor is a component of a complex stress regulatory pathway, connecting upstream signals mediated by MAP kinases MPK3/6 and MPK4 with transcription regulation of a set of stress-induced target genes.

Keywords: Arabidopsis; MAP kinases; combined stress; heat; heat shock factor A4A; phosphorylation; promoter binding; salinity; transcription regulation.


Figures

Fig. 1.
Fig. 1.
Regulation of HSFA4A. (A) Transcriptional regulation of HSFA4A gene in wild-type Arabidopsis plants treated with salt (150 mM NaCl), heat stress (37 °C in light and 30 °C in dark), and their combination for 2, 6, and 24 h. Relative expression is shown where 1 corresponds to transcript level at 0 h. Error bars indicate standard error; asterisks indicate significant differences from control: *P<0.05 and **P<0.01 (Student’s t-test). (B) Schematic map of the pHSFA4A::HSFA4A-YFP gene construct. (C) Detection of HSFA4A–YFP fusion protein in 10-day-old control and salt-stressed plants (150 mM NaCl, 0–24 h) transformed with the pHSFA4A::HSFA4A-YFP gene construct. Salt treatment led to enhanced HSFA4A–YFP specific western signal. (This figure is available in color at JXB online.)
Fig. 2.
Fig. 2.
Intracellular localization and transfer of HSFA4A. (A) Confocal microscopic detection of the HSFA4A–YFP fusion protein in different segments of roots. Root hair is stained with propidium iodide to demonstrate nuclear localization of the YFP signal. Segments of elongation zone are shown with and without salt treatment (100 mM NaCl, 2 h). (B) HSFA4A is transported into nuclei during salt stress. Roots were treated with 100 mM NaCl, and HSFA4A–YFP-derived fluorescence was monitored in individual cells at regular intervals. Arrow indicate position of a nucleus. (C) Quantitative evaluation of YFP fluorescence in cytosol and nuclei. Relative fluorescence is shown, where 1 corresponds to intensity measured in cytosol at time 0. YFP-derived fluorescence was rapidly enhanced in nuclei of salt-treated cells, while it did not change in control cells. Scale bar on images indicates 20 µm. Error bars indicate standard error; asterisks indicate significant differences from time 0: *P<0.05 and **P<0.01 (Student’s t-test).
Fig. 3.
Fig. 3.
Binding of HSFA4A on target gene promoters. (A) Schematic map of ZAT12, HSP17.6A, and WRKY30 promoters according to AthaMap. Promoter regions between −1000 and +200 bp are shown. Black line indicates promoter, dark grey corresponds to 5′-UTR and exon while light grey is intron sequence. HSE motifs are indicated by grey boxes and sequences connected to the amplified regions are shown above the target region. Dashed arrows indicates transcription initiation. Amplified target sequences by qPCR are indicated by black double arrows. (B) ChIP assay with YFP-tagged HSFA4A using transgenic plant expressing the pHSFA4A::HSFA4A-YFP gene construct (see Fig. 1B, C). Plants were treated by salt (150 mM NaCl, 6 h), heat stress (37 °C, 6 h), and their combination before ChIP assay. ChIP results are shown as relative enrichment by qPCR, where reference (value 1) is the qPCR value of the TUA3 promoter, which lacks any HSE motif, at control conditions. Note enrichments on different promoter regions, which can be enhanced by salt or heat treatments. Error bars indicate standard error; asterisks indicate significant differences from ChIP values of TUA3: *P<0.05 and **P<0.01 (Student’s t-test).
Fig. 4.
Fig. 4.
Phosphorylation of HSFA4A. (A) In vitro phosphorylation of HSFA4A by MAP kinases MPK3 and MPK4. MBP-tagged HSFA4A was phosphorylated in vitro by His-MPK3 or GST–MPK4. (B) List of phosphopeptides identified by MS. Phosphorylated amino acids are indicated with bold letters (pT, pS). MBP-tagged HSFA4A was phosphorylated in vitro by MPK4, in-gel digested by trypsin, and analysed by mass spectrometry. The modified sites within the detected tryptic peptides were determined from MS/MS spectra acquired following ferric nitrilotriacetate chelate (Fe(III)-NTA) phosphopeptide enrichment (Supplemental Dataset S1). Phosphopeptide signal% was calculated from MS signal areas of the unmodified and phosphorylated peptides detected in the tryptic digest without phosphopeptide enrichment. Note that these values are not absolute phosphorylation ratios. (C) Detection of phosphopeptides in vivo. HSFA4A–YFP fusion protein was immunoprecipitated from transgenic plants, and phosphopeptides were detected by mass spectrometry. Bold letters indicate phosphorylated amino acids. (D) Amino acid sequence of HSFA4A. Amino acids phosphorylated by MPK3 (Pérez-Salamó et al., 2014) and MPK4 (this study) or detected in immunoprecipitated samples are shown with bold and underlined letters. Boxed letters indicate amino acids that were detected in both in vitro and in vivo phosphorylation assays. Underlined letters in italics indicate predicted MAPK docking motif (RKRRFPR). Conserved DNA binding domain is underlined. GST, glutathione S-transferase; His, polyhistidine tag; MBP, maltose binding protein.
Fig. 5.
Fig. 5.
Multimerization of HSFA4A. (A) Detection of HSFA4A–YFP multimers in Arabidopsis plants transformed with the pHSFA4A::HSFA4A-YFP gene construct. Protein extracts were treated with or without DTT and separated on non-denaturing polyacrylamide gels. HSFA4A–YFP was detected by western hybridization with anti-GFP antibody. Separated and membrane-blotted proteins were stained with Ponceau Red. (B) BiFC assay of wild-type HSFA4A (HSFA4A-wt), and mutants in which Ser309 was changed to Ala (HSF-S309A) or Asp (HSF-S309D). nYFP and cYFP indicates N- and C-terminal half of YFP protein. Controls include polyethylene glycol-treated protoplasts without plasmids, protoplasts transformed with plasmids having nYFP and cYFP fragments, or protoplasts expressing HSFA4A-cYFP in combination with the empty nYFP plasmid (upper row). Typical BiFC images are shown. (C) Quantitative evaluation of fluorescence signals in YFP-expressing transformed protoplasts in BiFC experiments. Relative fluorescence intensities are shown, where 1 equals signals of protoplasts expressing the wild-type HSFA4A constructs (HSFA4A-wt) while HSF-S309A and HSF-S309D indicate S309A and S309D mutants, respectively. (D) Western detection of HSFA4A–YFP fusions in BiFC experiment. Anti-GFP antibody was used to detect the proteins in transformed protoplasts. Note that comparable amount of HSFA4A–YFP was produced in each BiFC samples. In fact, slightly lower amount of wild-type and higher amount of S309A version of HSFA4A was produced. Error bars indicate standard error; asterisks indicate significant differences from HSFA4A-wt: *P<0.05 and **P<0.01 (Student’s t-test). Scale bar on images indicates 10 μm.
Fig. 6.
Fig. 6.
HSFA4A overexpression enhances tolerance to heat and salt stresses. Ten-day-old in vitro-grown plantlets were treated by salt (100 mM, 150 mM NaCl), heat (37 °C in light, 30 °C in dark) or their combination for 2 or 4 d. Rates of surviving healthy (vigorous growth with several new green leaves), damaged (small plants with retarded growth and/or chlorotic leaves), and dead plants (completely chlorotic with no green leaves) were scored 10 d after recovery. Similar results were obtained with independent transgenic lines of both constructs and one representative transgenic line was used for each construct in this experiments. (A) Growth of wild-type (Col-0) and transgenic plants overexpressing the wild-type (HSFox-wt) and S309D mutant (HSFox-m) forms of HSFA4A after heat, 150 mM NaCl, and combined 100 mM NaCl and heat treatments. (B) Frequencies of healthy, damaged, and dead plants after heat, salt, and combined heat and salt stresses applied for 2 or 4 d. Survival frequencies of control, non-stressed plants (all survived and healthy) and plants treated by 150 mM NaCl and heat (all dead) are not shown. (C) Lipid peroxidation rates of wild-type and HSFA4A-overexpressing lines. Values are normalized to control, non-treated plants. Error bars indicate standard deviation; asterisks indicate significant differences to Col-0 wild-type plants: *P<0.05 and **P<0.01 (Student’s t-test).
Fig. 7.
Fig. 7.
Model of stress signal transduction and transcription regulation mediated by HSFA4A. Environmental stresses such as salt and heat generate reactive oxygen species, which in turn can activate MAP kinases MPK3/6 and MPK4. Expression of HSFA4A is activated by stress conditions, in which different classes of TFs (e.g. HSF, bZIP, C2H2, and MYB) are implicated. Phosphorylation of HSFA4A by MPK3/6, MPK4, and other unknown kinases modulates its activity and induction of target genes. HSFA4A binds to promoters of effector genes such as chaperones (e.g. HSP17.6A) or other TFs (e.g. WRKY30 and ZAT12) in a stress-dependent manner and activate their transcription. Induction of these target genes contributes to stress tolerance, either directly producing protective proteins or indirectly through activation of other defense-related genes. (This figure is available in color at JXB online.)

References

    1. Akerfelt M, Morimoto RI, Sistonen L. 2010. Heat shock factors: integrators of cell stress, development and lifespan. Nature Reviews. Molecular Cell Biology 11, 545–555. - PMC - PubMed
    1. Albihlal WS, Obomighie I, Blein T, Persad R, Chernukhin I, Crespi M, Bechtold U, Mullineaux PM. 2018. Arabidopsis HEAT SHOCK TRANSCRIPTION FACTORA1b regulates multiple developmental genes under benign and stress conditions. Journal of Experimental Botany 69, 2847–2862. - PMC - PubMed
    1. Aleksza D, Horváth GV, Sándor G, Szabados L. 2017. Proline accumulation is regulated by transcription factors associated with phosphate starvation. Plant Physiology 175, 555–567. - PMC - PubMed
    1. Anckar J, Sistonen L. 2011. Regulation of HSF1 function in the heat stress response: implications in aging and disease. Annual Review of Biochemistry 80, 1089–1115. - PubMed
    1. Apel K, Hirt H. 2004. Reactive oxygen species: metabolism, oxidative stress, and signal transduction. Annual Review of Plant Biology 55, 373–399. - PubMed

Publication types

MeSH terms