Observational Study
. 2019 Aug;39(8):1469-1485.
doi: 10.1177/0271678X19846657. Epub 2019 May 14.

Continuous non-invasive optical monitoring of cerebral blood flow and oxidative metabolism after acute brain injury

Affiliations
Observational Study

Continuous non-invasive optical monitoring of cerebral blood flow and oxidative metabolism after acute brain injury

Wesley B Baker et al. J Cereb Blood Flow Metab. 2019 Aug.

Abstract

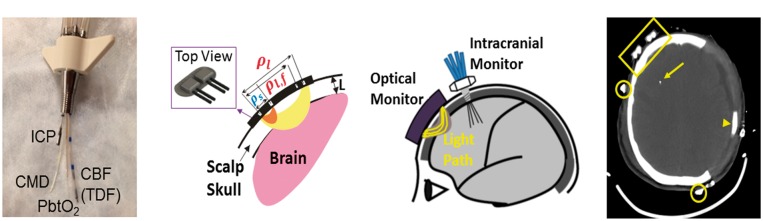
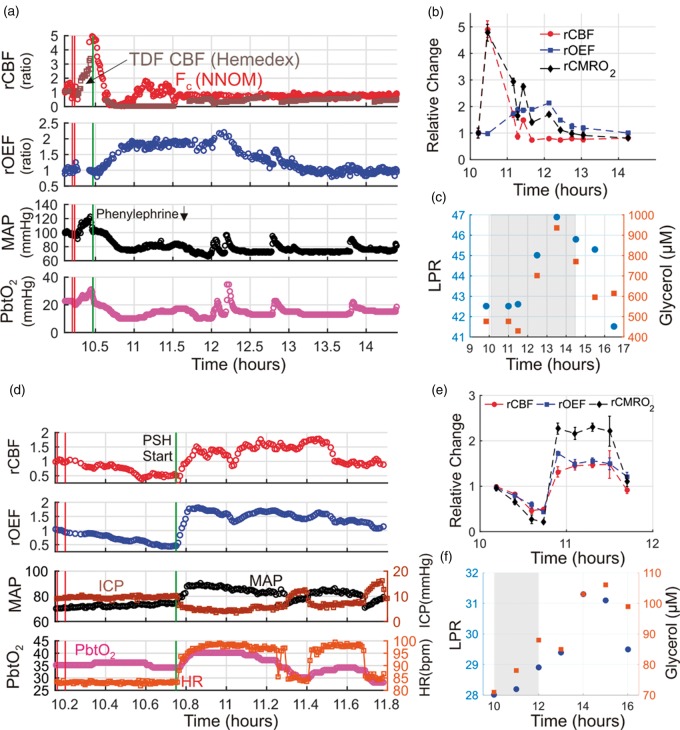
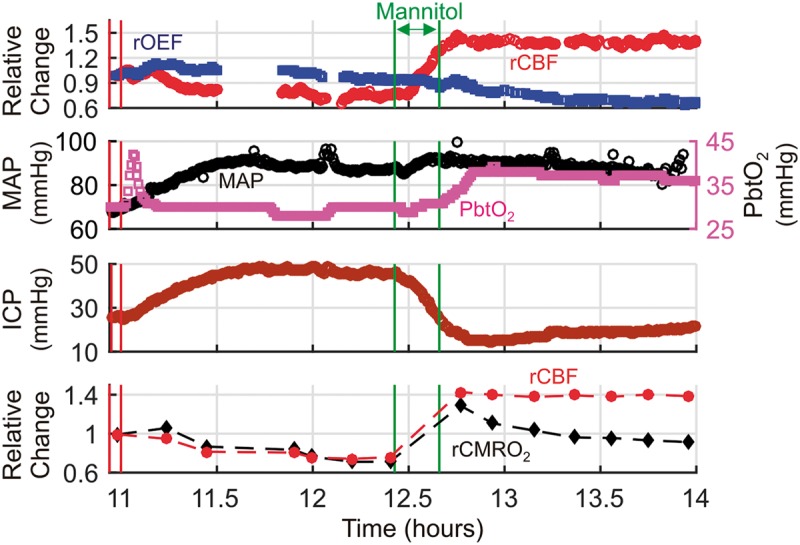
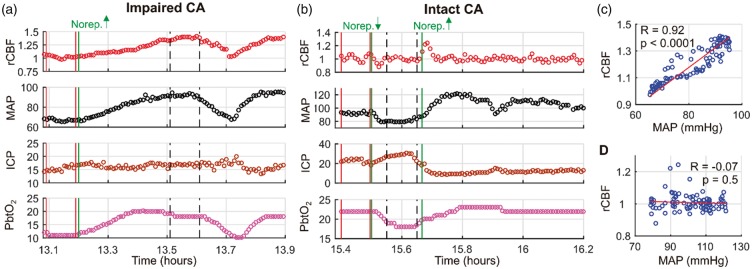
Rapid detection of ischemic conditions at the bedside can improve treatment of acute brain injury. In this observational study of 11 critically ill brain-injured adults, we employed a monitoring approach that interleaves time-resolved near-infrared spectroscopy (TR-NIRS) measurements of cerebral oxygen saturation and oxygen extraction fraction (OEF) with diffuse correlation spectroscopy (DCS) measurement of cerebral blood flow (CBF). Using this approach, we demonstrate the clinical promise of non-invasive, continuous optical monitoring of changes in CBF and cerebral metabolic rate of oxygen (CMRO2). In addition, the optical CBF and CMRO2 measures were compared to invasive brain tissue oxygen tension (PbtO2), thermal diffusion flowmetry CBF, and cerebral microdialysis measures obtained concurrently. The optical CBF and CMRO2 information successfully distinguished between ischemic, hypermetabolic, and hyperemic conditions that arose spontaneously during patient care. Moreover, CBF monitoring during pressor-induced changes of mean arterial blood pressure enabled assessment of cerebral autoregulation. In total, the findings suggest that this hybrid non-invasive neurometabolic optical monitor (NNOM) can facilitate clinical detection of adverse physiological changes in brain injured patients that are otherwise difficult to measure with conventional bedside monitoring techniques.

Keywords: Cerebral blood flow measurement; intrinsic optical imaging; near-infrared spectroscopy; neurocritical care.


Figures

Figure 1.
Figure 1.
(a) Picture of quad lumen bolt with invasive probes. (b) Schematic of NNOM sensor that probes the head with: (1) TR-NIRS measurements at long (ρl = 3.2 cm) and short (ρs = 0.7 cm) source-detector separations to derive cerebral StO2 and OEF; and (2) DCS measurements at long (ρl,f = 2.5 cm) and short (ρs = 0.7 cm) source-detector separations to derive a CBF index (see text). (c) Configuration of concurrent non-invasive and invasive intracranial monitoring probes. (d) Anatomical CT scan showing position of NNOM sensor on the scalp (encompassed by yellow rectangle) and the tip of an invasive probe (yellow arrow). The patient’s skull was surgically removed from the left side to treat cerebral edema and intracranial hypertension. Arrowhead points to subdural drain, and open circles mark positions of EEG electrodes.
Figure 2.
Figure 2.
Cerebral ischemic events triggered by a decrease in mean arterial pressure (MAP) in subject 10 (a, b, c), and excess cerebral metabolic demand during paroxysmal sympathetic hyperactivity (PSH) in subject 7 (d, e, f). Temporal traces of multimodal data acquired before/during/after an episode of patient agitation (a) and before/during/after an episode of PSH (d). Relative cerebral oxygen extraction fraction (rOEF ≡ OEF/OEFo) and blood flow (rCBF ≡ CBF/CBFo) measurements obtained with the NNOM are given by equations (2) and (3), respectively. Baseline values, CBFo and OEFo, are computed to be the means of the data between the two vertical red lines. Panel (a) contains NNOM measurements of cortical CBF (red circles) and thermal diffusion flowmetry (TDF) measurements of white matter CBF (brown squares). The vertical green lines in panels (a) and (d) indicate a decrease in phenylephrine infusion rate (from 150 to 100 mcg/min) and the start of PSH, respectively. In panels (b) and (e), steady-state 6-min averages of NNOM rCBF, rOEF, and relative cerebral metabolic rate of oxygen (rCMRO2) data for the same temporal intervals as panels (a) and (d), respectively, are shown (rCMRO2 given by equation (4)). Cerebral microdialysis lactate:pyruvate ratio (LPR; blue circles) and glycerol concentration (red squares) measurements are plotted before/during/after the patient agitation episode (c) and the PSH episode (f) over wider time intervals. The gray-shaded regions in panels (c) and (f) indicate the time intervals of panels (a) and (d), respectively. PbtO2, ICP, and HR denote, respectively, brain interstitial oxygen tension, intracranial pressure, and heart rate. Note, the gap in NNOM data in panel (a) was caused by a regrettable crash in the instrument control software.
Figure 3.
Figure 3.
Hyperemia/Luxury perfusion after an episode of intracranial hypertension. Temporal traces of relative cerebral blood flow (rCBF ≡ CBF/CBFo), and oxygen extraction fraction (rOEF ≡ OEF/OEFo), mean arterial pressure (MAP), brain interstitial oxygen tension (PbtO2), and intracranial pressure (ICP) data acquired during an episode of elevated ICP in a patient with diffuse hypoxic ischemic brain injury (cerebral microdialysis and thermal diffusion flowmetry CBF not available). Steady-state 6-min averages of rCBF and relative cerebral metabolic rate of oxygen (rCMRO2 ≡ CMRO2/CMRO2,o) data measured with the NNOM are also plotted versus time (bottom panel). CBFo, OEFo, and CMRO2,o denote the (baseline) mean values of the NNOM data between the two vertical red lines. The intracranial hypertension was treated with a 70 g bolus of 25% mannitol, administered between the two vertical green lines. Note: the initial transient increase in PbtO2 at the beginning of the episode is due to a 100% O2 challenge (performed periodically to test monitor function), and the gaps in the NNOM data were caused by regrettable crashes in the instrument control software.
Figure 4.
Figure 4.
Temporal non-invasive neurometabolic optical monitor (NNOM) measurements of relative cerebral blood flow (rCBF ≡ CBF/CBFo) with concurrent mean arterial pressure (MAP, mmHg), intracranial pressure (ICP, mmHg), and brain interstitial oxygen tension (PbtO2, mmHg) data acquired during MAP manipulations performed on “measurement day 1” (a) and “measurement day 2” (b) in subject #5 (diagnosed with traumatic brain injury, see Table 1). CBFo is the (baseline) mean value of the data between the two vertical red lines. MAP was significantly altered via adjustment of norepinephrine infusion (vertical green lines: the increase from 2 to 4 mcg/kg/min in panel (a); the decrease from 4 to 2 mcg/kg/min, followed by the increase from 2 to 4 mcg/kg/min in panel (b)). The vertical dashed black lines indicate the 6-min intervals used to compute the steady-state changes relative to baseline that are shown in panels (d) and (e) of Figure 5. (c) rCBF plotted against concurrent MAP data for the entire temporal interval shown in panel (a). The high Pearson’s correlation coefficient (i.e., DCSx = 0.92, p < 0.0001) indicates impaired cerebral autoregulation (CA). (d) rCBF plotted against concurrent MAP data for the entire temporal interval shown in panel (b). The lack of correlation (i.e., DCSx = −0.07, p = 0.5) indicates intact CA. The analogous pressure reactivity autoregulation indices (PRx) for the data in panels (a) and (b) are −0.10 (p = 0.34) and −0.92 (p < 0.0001), respectively (note, although the PRx value for panel (a) is negative, the p value indicates the correlation is not significant). The analogous brain tissue oxygen pressure reactivity autoregulation indices (ORx) are 0.80 (p < 0.0001) and 0.69 (p < 0.0001), respectively. Thermal diffusion flowmetry data were not available during these CA assessments.
Figure 5.
Figure 5.
During non-invasive neurometabolic optical monitoring, significant mean arterial pressure (MAP) changes were induced 19 times by standard-of-care adjustment in vasoactive medication infusion rates. DCSx, COx, ORx, TDFx, and PRx cerebral autoregulation (CA) indices were computed across the 50-min intervals encompassing the infusion changes (see text). These five indices are, respectively, the Pearson correlation coefficients between: (1) optical diffuse correlation spectroscopy (DCS) cerebral blood flow (CBF) index and mean arterial pressure (MAP); (2) optical time-resolved near-infrared spectroscopy (TR-NIRS) measurement of cerebral tissue oxygen saturation and MAP; (3) brain interstitial oxygen tension (PbtO2) and cerebral perfusion pressure (CPP); (4) thermal diffusion flowmetry (TDF) CBF and CPP; and (5) MAP and intracranial pressure. (a) COx plotted against DCSx; (b) ORx (blue circles) and TDFx (red squares) plotted against DCSx; and (c) PRx plotted against DCSx. In most cases, the DCSx, COx, ORx, and TDFx indicate impaired CA. The PRx, however, is more variable. Steady-state PbtO2 changes resulting from the infusion changes were correlated with DCS measured CBF changes (equation (3)) (d), but not with TR-NIRS measured OEF changes (equation (2)) (e). Steady-state DCS measured CBF changes were not correlated with TDF CBF changes (f). In panels (d) through (f), the baseline and perturbed data are 6 min averages across stable data acquired shortly before and shortly after the pressor infusion rate changes (e.g., see Figure 4). The red line in panel (d) is the linear best-fit line. One event of cerebral ischemia (i.e., PbtO2 < 20 mmHg, TDF CBF < 15 ml/100 g/min, cerebral microdialysis lactate:pyruvate ratio > 40) accompanied a drop in phenylephrine infusion (labeled in panels (d), (e), (f); temporal data in Figure 2). For subject #5, DCSx indicated impaired CA day 1 (DCSx = 0.92), and intact CA day 2 (DCSx = −0.07; MAP challenges labeled in panels (d), (e); temporal data in Figure 4).

References

    1. Al-Tamimi YZ, Orsi NM, Quinn AC, et al. A review of delayed ischemic neurologic deficit following aneurysmal subarachnoid hemorrhage: historical overview, current treatment, and pathophysiology. World Neurosurg 2010; 73: 654–667. - PubMed
    1. Cunningham A, Salvador R, Coles J, et al. Physiological thresholds for irreversible tissue damage in contusional regions following traumatic brain injury. Brain 2005; 128: 1931–1942. - PubMed
    1. Vergouwen MD, Vermeulen M, van Gijn J, et al. Definition of delayed cerebral ischemia after aneurysmal subarachnoid hemorrhage as an outcome event in clinical trials and observational studies. Stroke 2010; 41: 2391–2395. - PubMed
    1. Werner C, Engelhard K. Pathophysiology of traumatic brain injury. Br J Anaesth 2007; 99: 4–9. - PubMed
    1. Brott T, Bogousslavsky J. Treatment of acute ischemic stroke. N Engl J Med 2000; 343: 710–722. - PubMed

Publication types

LinkOut - more resources