

Guidance for DNA methylation studies: statistical insights from the Illumina EPIC array
- PMID: 31088362
- PMCID: PMC6518823
- DOI: 10.1186/s12864-019-5761-7
Guidance for DNA methylation studies: statistical insights from the Illumina EPIC array
Abstract
Background: There has been a steady increase in the number of studies aiming to identify DNA methylation differences associated with complex phenotypes. Many of the challenges of epigenetic epidemiology regarding study design and interpretation have been discussed in detail, however there are analytical concerns that are outstanding and require further exploration. In this study we seek to address three analytical issues. First, we quantify the multiple testing burden and propose a standard statistical significance threshold for identifying DNA methylation sites that are associated with an outcome. Second, we establish whether linear regression, the chosen statistical tool for the majority of studies, is appropriate and whether it is biased by the underlying distribution of DNA methylation data. Finally, we assess the sample size required for adequately powered DNA methylation association studies.
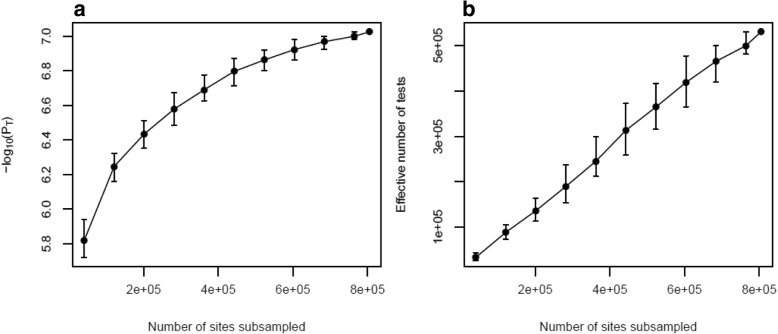
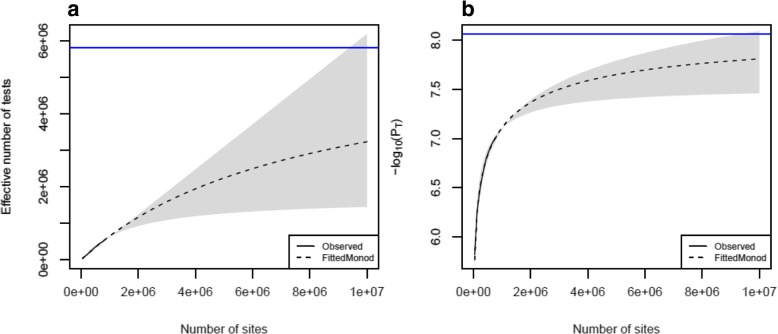
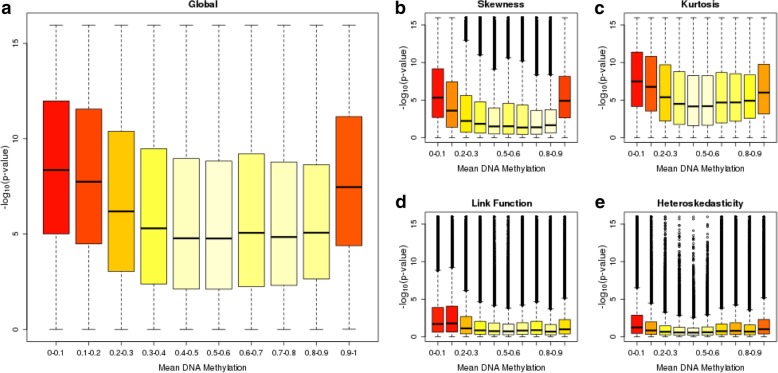
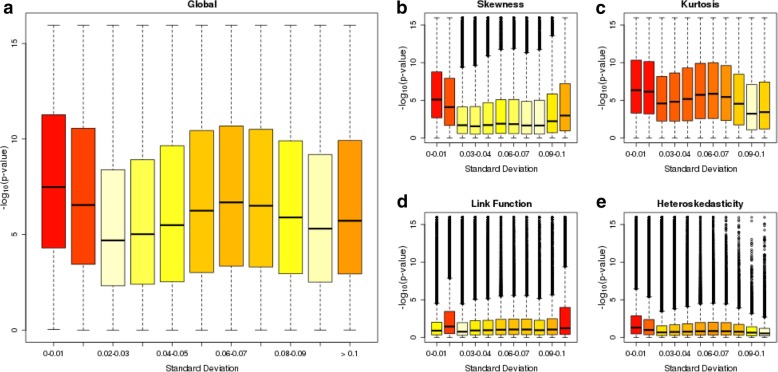
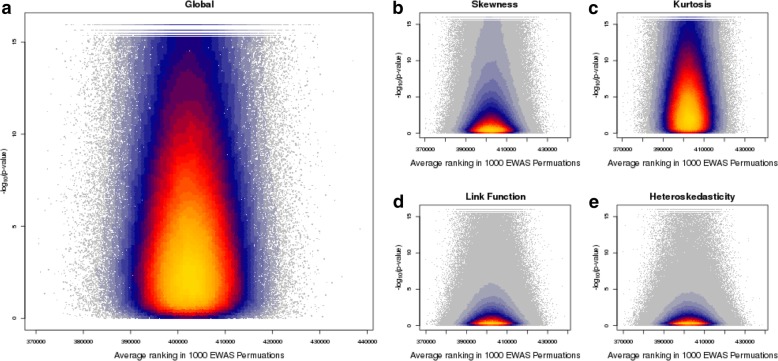
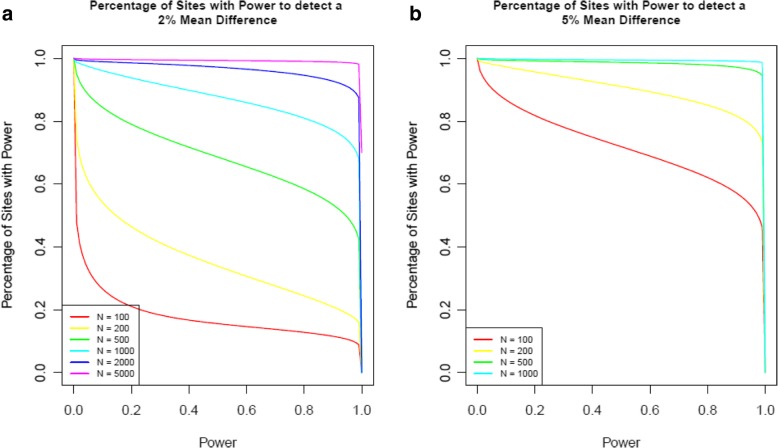
Results: We quantified DNA methylation in the Understanding Society cohort (n = 1175), a large population based study, using the Illumina EPIC array to assess the statistical properties of DNA methylation association analyses. By simulating null DNA methylation studies, we generated the distribution of p-values expected by chance and calculated the 5% family-wise error for EPIC array studies to be 9 × 10- 8. Next, we tested whether the assumptions of linear regression are violated by DNA methylation data and found that the majority of sites do not satisfy the assumption of normal residuals. Nevertheless, we found no evidence that this bias influences analyses by increasing the likelihood of affected sites to be false positives. Finally, we performed power calculations for EPIC based DNA methylation studies, demonstrating that existing studies with data on ~ 1000 samples are adequately powered to detect small differences at the majority of sites.
Conclusion: We propose that a significance threshold of P < 9 × 10- 8 adequately controls the false positive rate for EPIC array DNA methylation studies. Moreover, our results indicate that linear regression is a valid statistical methodology for DNA methylation studies, despite the fact that the data do not always satisfy the assumptions of this test. These findings have implications for epidemiological-based studies of DNA methylation and provide a framework for the interpretation of findings from current and future studies.
Keywords: DNA methylation; Epigenome-wide association study (EWAS); Illumina EPIC array; Multiple testing; Power.
Conflict of interest statement
Ethics approval and consent to participate
Ethical approval for the Understanding Society nurse visit was obtained from the National Research Ethics Service (Reference: 10/H0604/2). Participants gave written consent for blood sampling.
Consent for publication
Not applicable.
Competing interests
The authors declare that they have no competing interests.
Publisher’s Note
Springer Nature remains neutral with regard to jurisdictional claims in published maps and institutional affiliations.
Figures

References
-
- Heyn H, Carmona FJ, Gomez A, Ferreira HJ, Bell JT, Sayols S, Ward K, Stefansson OA, Moran S, Sandoval J, et al. DNA methylation profiling in breast cancer discordant identical twins identifies DOK7 as novel epigenetic biomarker. Carcinogenesis. 2013;34(1):102–108. doi: 10.1093/carcin/bgs321. - DOI - PMC - PubMed
-
- Irizarry RA, Ladd-Acosta C, Wen B, Wu Z, Montano C, Onyango P, Cui H, Gabo K, Rongione M, Webster M, et al. The human colon cancer methylome shows similar hypo- and hypermethylation at conserved tissue-specific CpG island shores. Nat Genet. 2009;41(2):178–186. doi: 10.1038/ng.298. - DOI - PMC - PubMed
-
- Lange CP, Campan M, Hinoue T, Schmitz RF, van der Meulen-de Jong AE, Slingerland H, Kok PJ, van Dijk CM, Weisenberger DJ, Shen H, et al. Genome-scale discovery of DNA-methylation biomarkers for blood-based detection of colorectal cancer. PLoS One. 2012;7(11):e50266. doi: 10.1371/journal.pone.0050266. - DOI - PMC - PubMed
-
- Liu Y, Aryee MJ, Padyukov L, Fallin MD, Hesselberg E, Runarsson A, Reinius L, Acevedo N, Taub M, Ronninger M, et al. Epigenome-wide association data implicate DNA methylation as an intermediary of genetic risk in rheumatoid arthritis. Nat Biotechnol. 2013;31(2):142–147. doi: 10.1038/nbt.2487. - DOI - PMC - PubMed
MeSH terms
Grants and funding
LinkOut - more resources
Full Text Sources
Medical
