. 2019 Jul 12;294(28):10789-10806.
doi: 10.1074/jbc.RA118.007134. Epub 2019 May 14.

The solution structure of the human IgG2 subclass is distinct from those for human IgG1 and IgG4 providing an explanation for their discrete functions

Affiliations

The solution structure of the human IgG2 subclass is distinct from those for human IgG1 and IgG4 providing an explanation for their discrete functions

Gar Kay Hui et al. J Biol Chem. .

Abstract

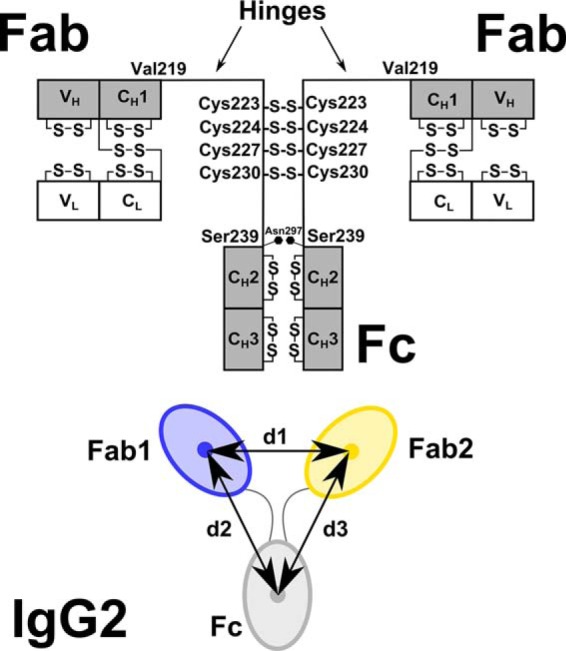
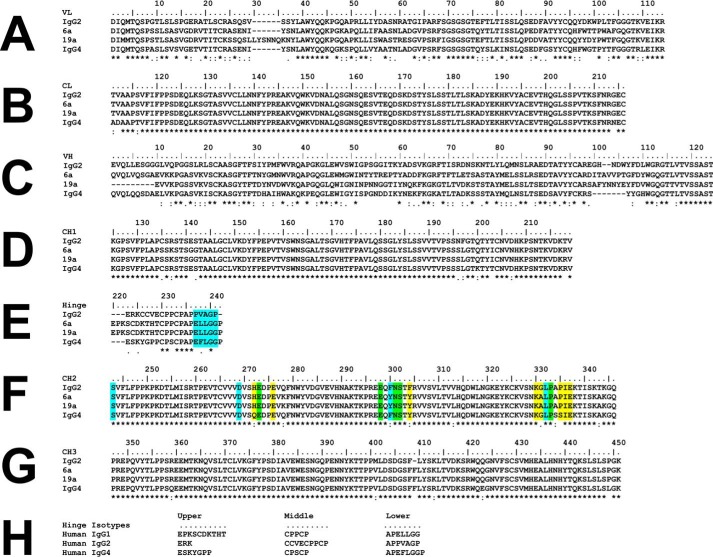
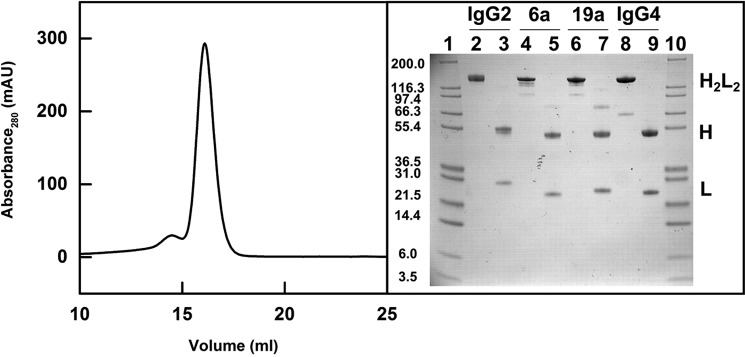
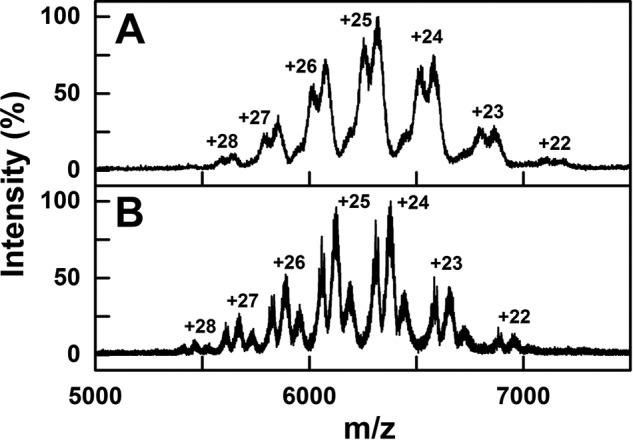
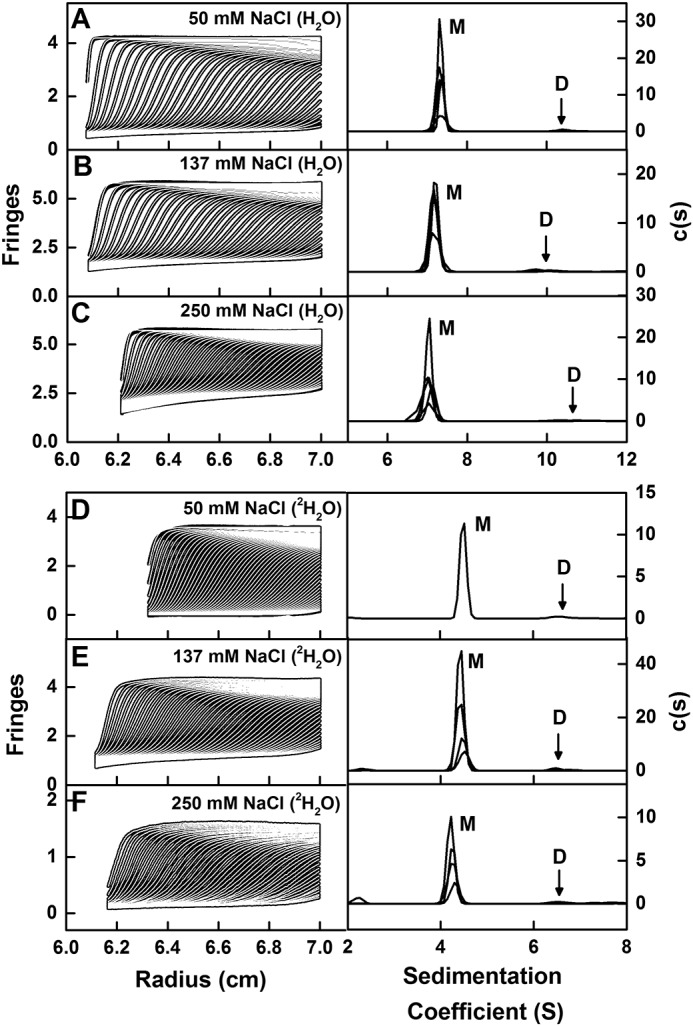
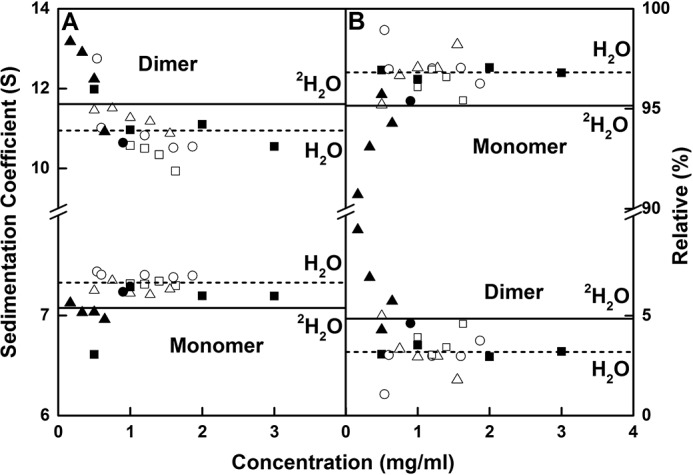
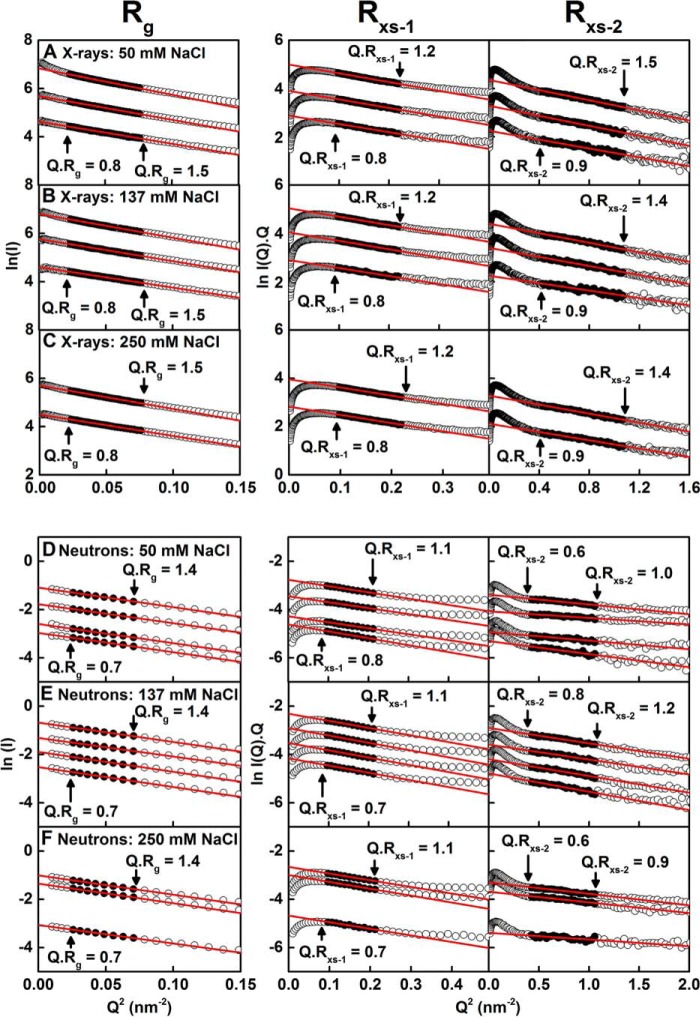
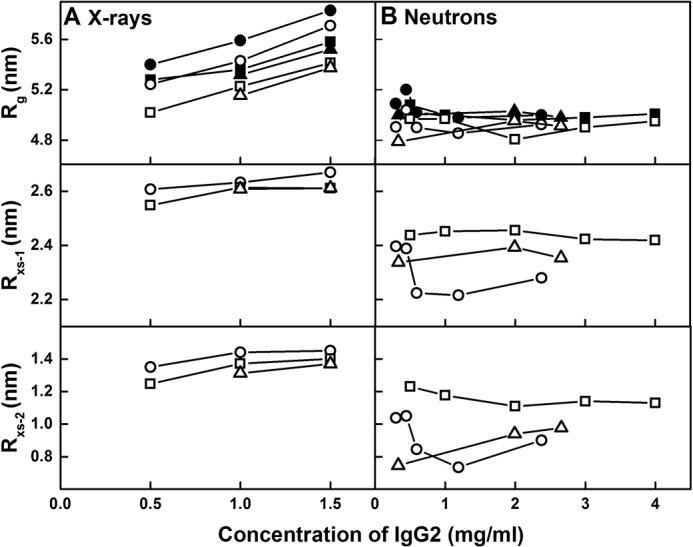
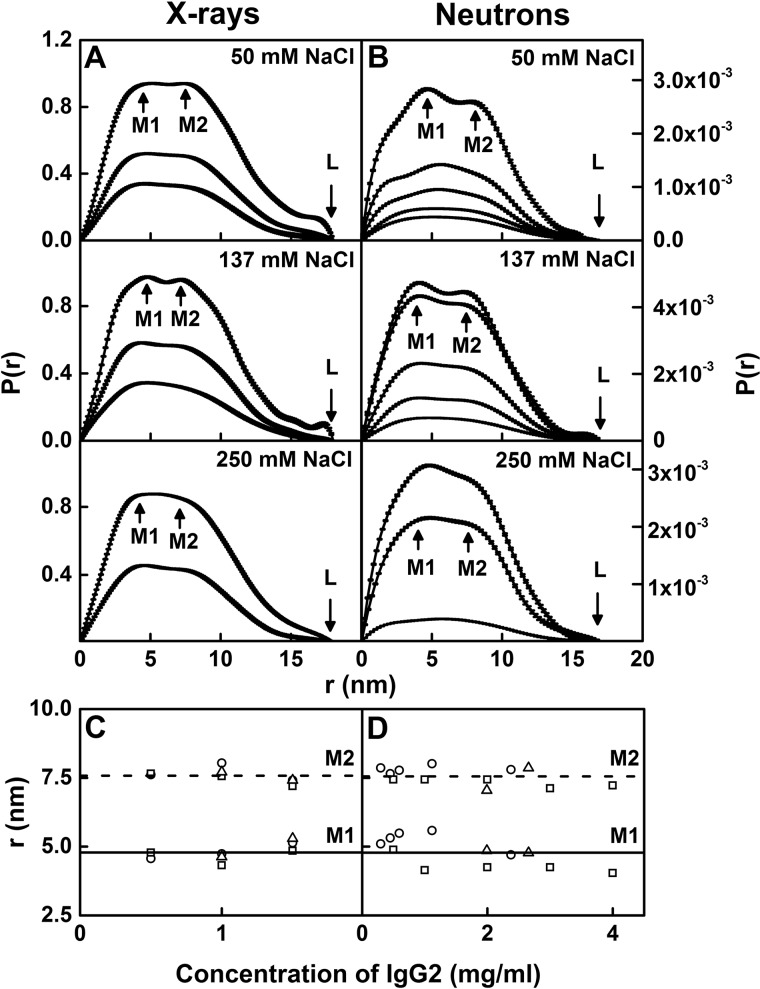
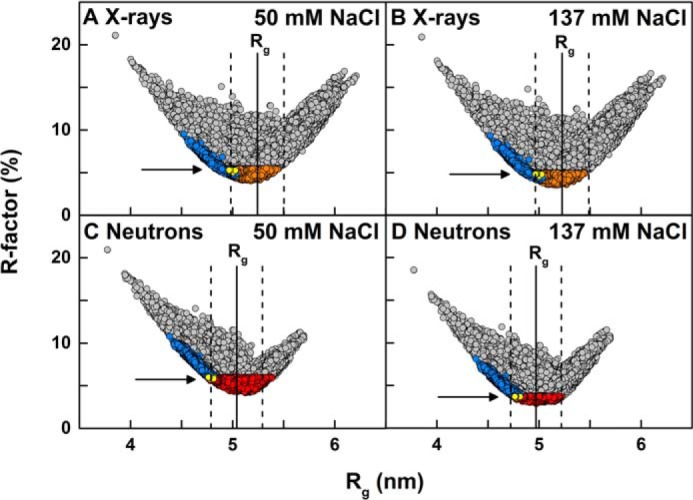
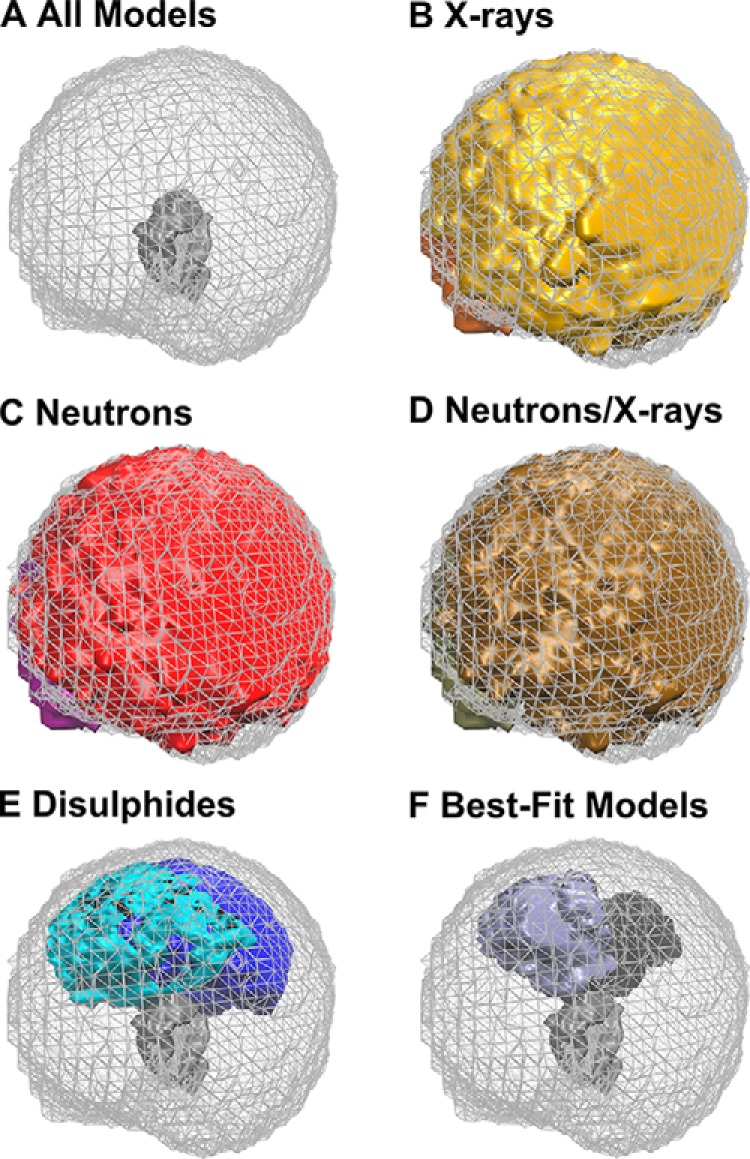
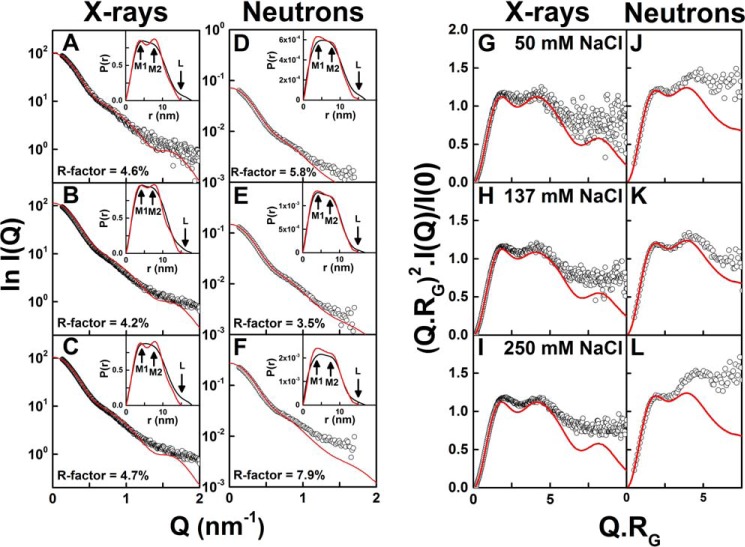
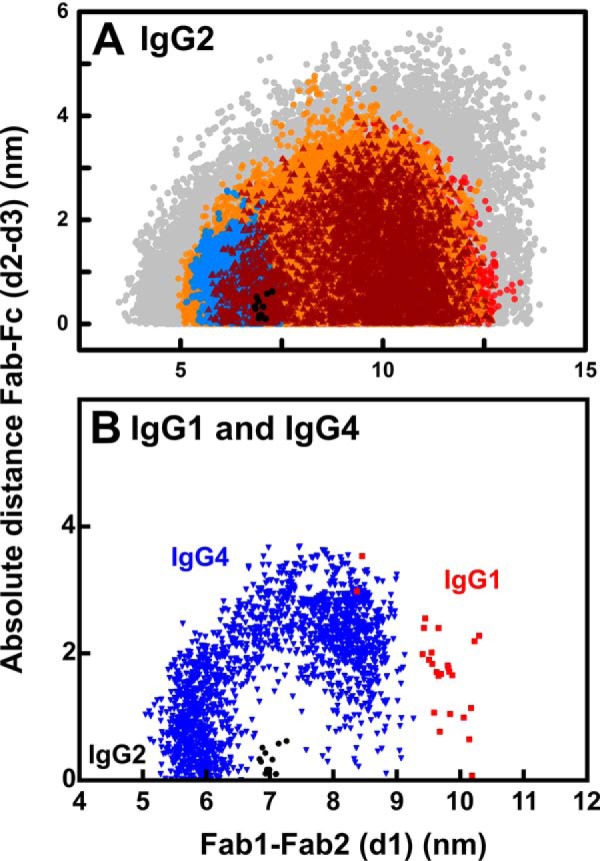
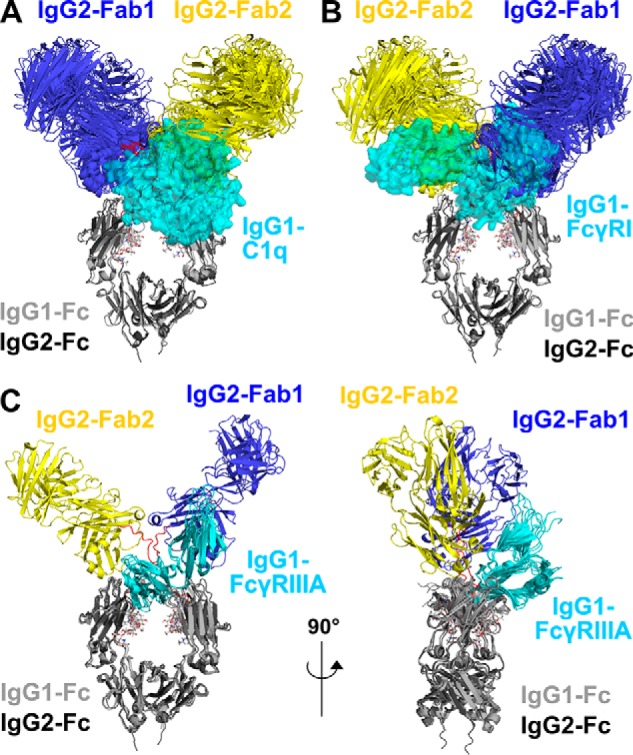
Human IgG2 antibody displays distinct therapeutically-useful properties compared with the IgG1, IgG3, and IgG4 antibody subclasses. IgG2 is the second most abundant IgG subclass, being able to bind human FcγRII/FcγRIII but not to FcγRI or complement C1q. Structural information on IgG2 is limited by the absence of a full-length crystal structure for this. To this end, we determined the solution structure of human myeloma IgG2 by atomistic X-ray and neutron-scattering modeling. Analytical ultracentrifugation disclosed that IgG2 is monomeric with a sedimentation coefficient (s20, w0) of 7.2 S. IgG2 dimer formation was ≤5% and independent of the buffer conditions. Small-angle X-ray scattering in a range of NaCl concentrations and in light and heavy water revealed that the X-ray radius of gyration (Rg ) is 5.2-5.4 nm, after allowing for radiation damage at higher concentrations, and that the neutron Rg value of 5.0 nm remained unchanged in all conditions. The X-ray and neutron distance distribution curves (P(r)) revealed two peaks, M1 and M2, that were unchanged in different buffers. The creation of >123,000 physically-realistic atomistic models by Monte Carlo simulations for joint X-ray and neutron-scattering curve fits, constrained by the requirement of correct disulfide bridges in the hinge, resulted in the determination of symmetric Y-shaped IgG2 structures. These molecular structures were distinct from those for asymmetric IgG1 and asymmetric and symmetric IgG4 and were attributable to the four hinge disulfides. Our IgG2 structures rationalize the existence of the human IgG1, IgG2, and IgG4 subclasses and explain the receptor-binding functions of IgG2.

Keywords: analytical ultracentrifugation; antibody; immunoglobulin G (IgG); molecular modeling; neutron-scattering; small-angle X-ray scattering (SAXS).


Conflict of interest statement

The authors declare that they have no conflicts of interest with the contents of this article.

Figures

Figure 1.
Figure 1.
Human IgG2 domain structure. The two heavy chains each possess VH, CH1, CH2, and CH3 domains, and the two light chains each possess VL and CL domains. The heavy chains are connected by four Cys–Cys disulfide bridges at Cys-223, Cys-224, Cys-227, and Cys-230. There is one N-linked oligosaccharide site at Asn-297 on each of the CH2 domains. The hinge region between the Fab and Fc fragments is composed of 19 residues (ERKCCVECPPCPAPPVAGP) between Val-219 and Ser-239 (EU numbering). Below the black diagram, the distance between the centers of mass of the two Fab regions (blue, yellow) was denoted as d1. Those between the two Fab and Fc regions were denoted as d2 and d3. The antibody is shown as a 2-fold symmetric structure with d2 = d3. In general, d2 and d3 are unequal. In the text, the smaller of the two values is denoted as min(d2,d3), and the larger of the two is denoted as max(d2,d3).
Figure 2.
Figure 2.
Sequence alignment of IgG2 with human IgG1 6a and IgG1 19a and IgG4. The IgG2 sequence was taken from IgG2 Li33 (13). The IgG1 6a and 19a sequences were taken from Ref. . A and B, VL, and CL domains. C–E, VH and CH1 domains and the hinge. F and G, CH2 and CH3 domains. H, comparison of hinge sequences from human IgG1, IgG2, and IgG4 subclasses. E and F, yellow indicates the contact residues involved in the IgG1–Fc complex with the C1q globular head, and blue indicates the contact residues required for interacting with FcγRI, and green indicates the contact residues that interact with both C1q and FcγRI.
Figure 3.
Figure 3.
Purification of IgG2. The IgG2 elution peak from a Superose 6 10/300 gel-filtration column is shown on the left (mAU, milli-absorbance units). The nonreduced and reduced SDS-PAGE analysis of the IgG subclasses is shown on the right with H2L2 representing the intact antibody molecule, H the heavy chain, and L the light chain. Lanes 1 and 10 contain Mark 12 molecular mass markers labeled in kDa. Lanes 2- 3, 4–5, 6–7, and 8–9 contain nonreduced and reduced IgG2, nonreduced and reduced IgG1 6a, nonreduced and reduced IgG1 19a, and nonreduced and reduced IgG4 B72.3, respectively.
Figure 4.
Figure 4.
Native MS of glycosylated and deglycosylated IgG2. Native mass spectra of myeloma IgG2 are shown at an m/z between 5,000 and 7,500. The glycosylated and deglycosylated IgG2 mass spectra are shown in A and B, respectively. The theoretical charge states were generated using Amphitrite software and labeled.
Figure 5.
Figure 5.
Sedimentation velocity analyses of IgG2. The experimentally observed sedimentation boundaries for IgG2 in the left panels in PBS-50 (A), PBS-137 (B), PBS-250 in H2O buffers (C), and in PBS-50 (D), PBS-137 (E), and PBS-250 (F) in 100% 2H2O buffers were recorded at a rotor speed of 40,000 rpm and 20 °C. Approximately 50 boundaries (black outlines) are shown from up to 300 scans for every sixth scan for clarity, and they were fitted using SEDFIT as shown (white lines). In the right panels, the corresponding size-distribution analyses c(s) are shown to reveal a major monomer (M) peak and a minor dimer (D) peak. The observed c(s) peaks are shifted to lower s values in 2H2O buffers.
Figure 6.
Figure 6.
Sedimentation coefficient values and amounts of IgG2. A, s20, w values for the monomer and dimer peaks are shown as a function of IgG2 concentration in the six buffers of this study. B, percentages of monomer and dimer from the c(s) integrations. IgG2 is shown in PBS-50 (○), PBS-137 (□), and PBS-250 (▵) buffers in H2O at 20 °C and in PBS-50 (●), PBS-137 (■), and PBS-250 (▴) buffers at 20 °C in 100% 2H2O. The average s20, w values of monomer and dimer from the integration of the c(s) analyses for IgG2 are shown for H2O (- -) and 2H2O (—) buffers at 20 °C.
Figure 7.
Figure 7.
X-ray and neutron Guinier Rg and Rxs analyses for IgG2. The X-ray scattering curves of IgG2 are shown for three buffers: A, PBS-50; B, PBS-137; and C, PBS-250 at 20 °C. The concentrations were ∼0.5, 1.0, and 1.5 mg/ml for PBS-50 and PBS-137 and 1.0 and 1.5 mg/ml for PBS-250 from bottom to top. The filled circles between the arrowed data points represent the Q.Rg and Q.Rxs ranges used to determine the Rg and Rxs values. The Q-ranges used for the Rg, Rxs-1, and Rxs-2 values were 0.15–0.28, 0.31–0.47, and 0.65–1.04 nm−1, respectively. The neutron-scattering curves of IgG2 are shown for three buffers: D, PBS-50; E, PBS-137; and F, PBS-250 at 20 °C in 100% heavy water. The concentrations were ∼0.30, 0.59, 1.19, and 2.38 mg/ml for PBS-50; 0.5, 1.0, 2.0, and 3.0 mg/ml for PBS-137; and 0.33, 1.99, and 2.66 mg/ml for PBS-250 from bottom to top. The filled circles between the arrowed data points represent the Q.Rg and Q.Rxs ranges used to determine the Rg and Rxs values. The Q-ranges used for the Rg, Rxs-1, and Rxs-2 values were 0.15–0.28, 0.31–0.47, and 0.65–1.04 nm−1, respectively. Two neutron curves (4 mg/ml in PBS-137 and 0.45 mg/ml in PBS-50) were omitted for clarity.
Figure 8.
Figure 8.
Concentration dependence of the X-ray and neutron Guinier parameters for IgG2. The Rg, Rxs-1, and Rxs-2 values are displayed from top to bottom for each buffer. A, X-ray Guinier values for IgG2 are shown for PBS-50 (○), PBS-137 (□), and PBS-250 (▵) buffers at 20 °C. The P(r) Rg values are shown for PBS-50 (●), PBS-137 (■), and PBS-250 (▴) at 20 °C. B, neutron Guinier values for IgG2 are shown for PBS-50 (○), PBS-137 (□), and PBS-250 (▵) buffers at 20 °C in 100% heavy water. The P(r) Rg values are shown for PBS-50 (●), PBS-137 (■), and PBS-250 (▴) at 20 °C in 100% heavy water.
Figure 9.
Figure 9.
X-ray and neutron distance distribution analyses P(r) for IgG2. The peak maxima M1 and M2 and maximum length at L are indicated by arrows. A, X-ray P(r) curves for IgG2 in PBS-50, PBS-137, and PBS-250 (H2O) are shown for concentrations at ∼0.5, 1.0, and 1.5 mg/ml for PBS-50 and PBS-137 and 1.0 and 1.5 mg/ml for PBS-250 from bottom to top. B, neutron P(r) curves for IgG2 in PBS-50, PBS-137, and PBS-250 at 20 °C in 100% heavy water. Concentrations were ∼0.30, 0.45, 0.59, 1.19, and 2.38 mg/ml for PBS-50, 0.5, 1.0, 2.0, 3.0, and 4.0 mg/ml for PBS-137, and 0.33, 1.99, and 2.66 mg/ml for PBS-250 from bottom to top. C, X-ray M1 and M2 values are shown for PBS-50 (○), PBS-137 (□), and PBS-250 (▵) buffers. D, neutron M1 and M2 values are shown for PBS-50 (○), PBS-137 (□), and PBS-250 (▵) in 100% heavy water buffer. The lines are the mean values for M1 (—) and M2 (- - -).
Figure 10.
Figure 10.
Modeling analyses for IgG2. The 123,371 goodness-of-fit R-factors were compared with the X-ray and neutron Rg values calculated for the IgG2 models. All 123,371 models are shown in gray. The 5,242 models filtered using an α-carbon separation of 0.75 nm for each of the four pairs of cysteine residues in the hinge (Fig. 1) are shown as blue circles. The 13 best-fit models that were accepted for each X-ray and neutron pair according to three filters (X-ray and neutron R-factor cutoffs and disulfide separations) are shown as yellow circles and arrowed. The experimentally observed Guinier Rg values are shown by vertical solid lines with error ranges of ± 5% shown by dashed lines. A, hydrated X-ray models were compared with the experimental X-ray curve of 0.5 mg/ml IgG2 in PBS-50 where the orange circles show 35,141 models with the R-factor below 5.5%. B, hydrated X-ray models were compared with experimental X-ray curve of 1 mg/ml IgG2 in PBS-137, where the orange circles show 30,088 models with the R-factor below 5%. C, unhydrated neutron models were compared with the experimental neutron curve of 0.45 mg/ml IgG2 in PBS-50 in 100% 2H2O, where the red circles show 44,835 models with the R-factor below 6%. D, unhydrated neutron models were compared with the experimental neutron curve of 1 mg/ml IgG2 in PBS-137 in 100% 2H2O, where the red circles show 10,731 models with the R-factor below 3.75%.
Figure 11.
Figure 11.
Density plots of the best-fit IgG2 models in PBS-137 buffer. The graphics were rendered using Tachyon in VMD. A, density plot for all 123,371 models is shown as a mesh with the Fc region shown as a gray solid surface. This is the reference for B–F. B, models that satisfied an X-ray R-factor cutoff below 5% for the curve at 1 mg/ml in PBS-137 in 100% light water. The two Fab regions are shown in gold and orange (30,088 models). C, models that satisfied a neutron R-factor cutoff of 3.75% for the curve at 1 mg/ml in PBS-137 in 100% heavy water. The two Fab regions are shown in red and purple (10,731 models). D, models that satisfied both the X-ray and neutron R-factors. The two Fab regions are shown in brown and tan (4,866 models). E, models that satisfied using an α-carbon separation of 0.75 nm between each of the four pairs of cysteine residues in the IgG2 hinge. The two Fab regions are shown in cyan and blue (5,242 models). F, 13 final best-fit models for IgG2 in PBS-137 that meet the X-ray and neutron R-factor cutoff and disulfide filters. The two Fab regions are shown in purple and black (13 models).
Figure 12.
Figure 12.
X-ray and neutron-scattering curve fits and Kratky analyses for the best-fit IgG2 models. The experimental data are indicated by white open circles, and the modeled best-fit curve is indicated in red. The models show 0.75-nm separations between each of the four pairs of cysteines in the IgG2 hinge. The X-ray best fits correspond to 0.5 mg/ml IgG2 in PBS-50 (A), 1 mg/ml IgG2 in PBS-137 (B), and 1.5 mg/ml IgG2 in PBS-250 (C). The neutron best fits correspond to 0.45 mg/ml IgG2 in PBS-50 (D), 1 mg/ml IgG2 in PBS-137 (E), and 1.99 mg/ml IgG2 in PBS-250 (F) in 100% 2H2O. The insets correspond to the experimental (black) and best-fit modeled (red) P(r) curves, in which M1, M2, and L are arrowed. G–L, corresponding Kratky plots for the same six comparisons between experiment and models are shown.
Figure 13.
Figure 13.
Distribution of the Fab–Fab and Fab–Fc distances in human IgG2. The analyses are shown for 1 mg/ml IgG2 in PBS-137. The inter-Fab distance, d1, between the center–of–mass of the two Fab arms and the absolute difference in Fab to Fc distances, d2–d3, are shown (Fig. 1). A, all 123,731 models from the Monte Carlo simulations are shown in gray. The 30,088 models with an X-ray R-factor below 5% are shown in orange. The 10,731 models with a neutron R-factor below 3.75% are shown in red. The 4,866 models filtered by both the X-ray and neutron R-factor filters are shown in brown. The 5,242 models that have less than 0.75 nm α-carbon separations for each of the four pairs of cysteine residues in the hinge are shown in blue. The 13 best-fit models that satisfy the X-ray and neutron and disulfide filters are shown in black. B, IgG2 models (black) denote those that meet the X-ray and neutron and disulfide filters from A and are compared with those for IgG1 (red) and IgG4 (blue) that were calculated in the same way.
Figure 14.
Figure 14.
Superimposition of the nine IgG2 best-fit models with complement C1q and two Fc receptors. The nine IgG2 best-fit models are compared with crystal structures for the IgG1–C1q, IgG1–FcγRI, and IgG1–FcγRIII complexes. Superimpositions of the Fc regions of the IgG2 models with the crystal structures of the Fc complexes were achieved using the “align” function of PyMOL. The IgG2 Fab regions are shown in blue (Fab1) and yellow (Fab2) and the Fc region in dark gray as in Fig. 1. The Fc region is seen in the same view in A, B, and C (left), and it is rotated by 90° in C (right). The glycans in the IgG2 Fc region are represented as sticks, and the IgG2 hinge is represented as red loops. A, superimposition of the nine IgG2 best-fit models with the IgG1–Fc complex with the globular head of C1q (PDB code 6FCZ). The IgG1–Fc region is represented as a light gray cartoon, and C1q is represented as a cyan semi-transparent surface. B, superimposition of the nine IgG2 best-fit models with the IgG1–Fc complex with FcγRI (PDB code 4X4M). The IgG1–Fc region is represented as a light gray cartoon, and FcγRI is represented as a cyan semi-transparent surface. C, two orthogonal views at 90° of the superimposition of the IgG2 best-fit model with three crystal structures for the IgG1–Fc complexes with FcγRIIIA Val-158 (PDB codes 3SGJ, 5VU0, and 5YC5). The IgG1–Fc regions are represented as light gray cartoon schematics and FcγRIIIA are represented as cyan cartoons.

References

    1. Strohl W. R., and Strohl L. M. (eds) (2012) in Therapeutic Antibody Engineering, pp. 37–595, Woodhead Publishing Series in Biomedicine, Woodhead Publishing, Sawston, Cambridge, UK
    1. Siber G. R., Schur P. H., Aisenberg A. C., Weitzman S. A., and Schiffman G. (1980) Correlation between serum IgG-2 concentrations and the antibody response to bacterial polysaccharide antigens. N. Engl. J. Med. 303, 178–182 10.1056/NEJM198007243030402 - DOI - PubMed
    1. Barrett D. J., and Ayoub E. M. (1986) IgG2 subclass restriction of antibody to pneumococcal polysaccharides. Clin. Exp. Immunol. 63, 127–134 - PMC - PubMed
    1. Brezski R. J., and Jordan R. E. (2010) Cleavage of IgGs by proteases associated with invasive diseases: an evasion tactic against host immunity? MAbs. 2, 212–220 10.4161/mabs.2.3.11780 - DOI - PMC - PubMed
    1. Brezski R. J., Oberholtzer A., Strake B., and Jordan R. E. (2011) The in vitro resistance of IgG2 to proteolytic attack concurs with a comparative paucity of autoantibodies against peptide analogs of the IgG2 hinge. MAbs. 3, 558–567 10.4161/mabs.3.6.18119 - DOI - PMC - PubMed

Publication types