. 2019 May 14;10(1):2147.
doi: 10.1038/s41467-019-10133-z.

Nucleoporin Nup155 is part of the p53 network in liver cancer

Affiliations

Nucleoporin Nup155 is part of the p53 network in liver cancer

Kerstin Holzer et al. Nat Commun. .

Abstract

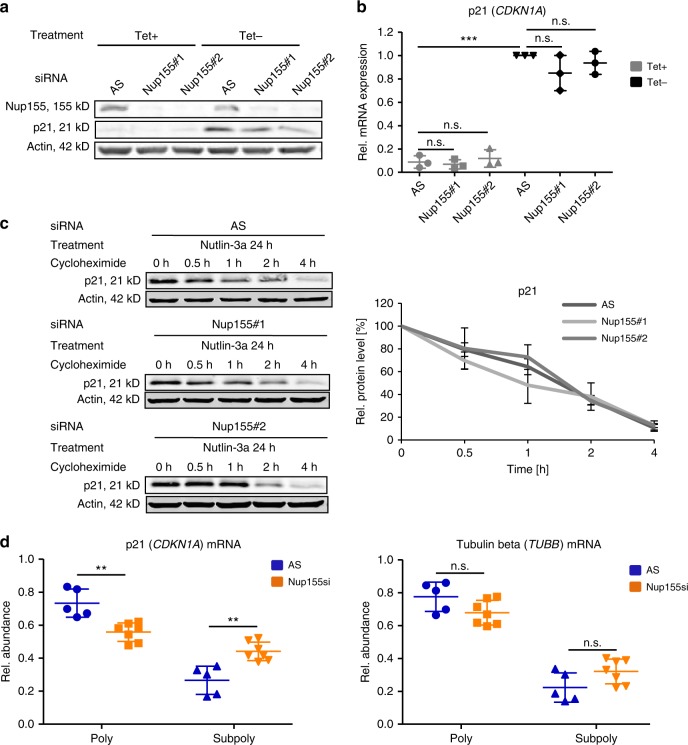
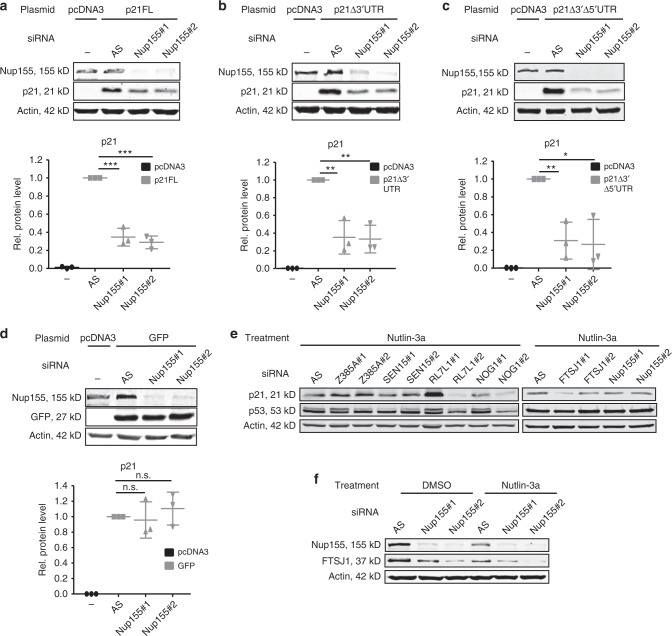
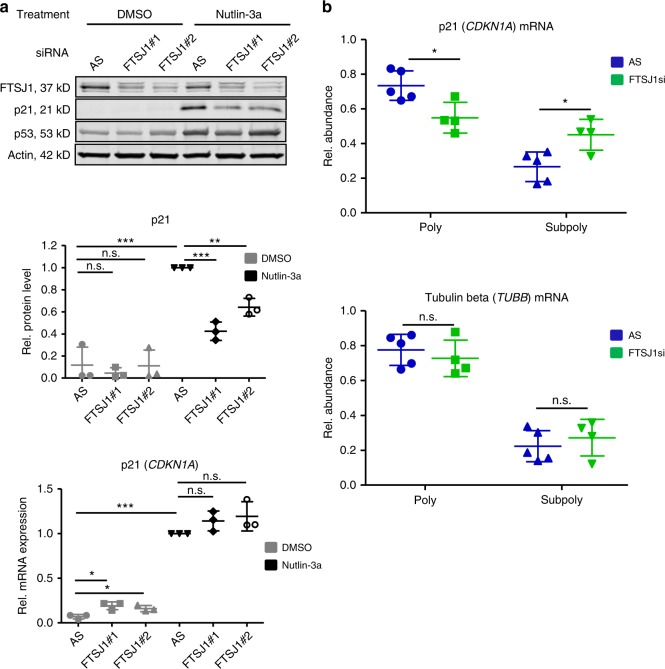
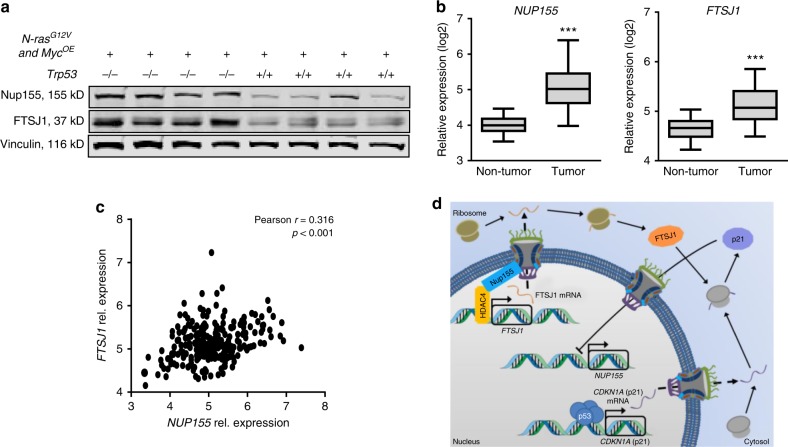
Cancer-relevant signalling pathways rely on bidirectional nucleocytoplasmic transport events through the nuclear pore complex (NPC). However, mechanisms by which individual NPC components (Nups) participate in the regulation of these pathways remain poorly understood. We discover by integrating large scale proteomics, polysome fractionation and a focused RNAi approach that Nup155 controls mRNA translation of p21 (CDKN1A), a key mediator of the p53 response. The underlying mechanism involves transcriptional regulation of the putative tRNA and rRNA methyltransferase FTSJ1 by Nup155. Furthermore, we observe that Nup155 and FTSJ1 are p53 repression targets and accordingly find a correlation between the p53 status, Nup155 and FTSJ1 expression in murine and human hepatocellular carcinoma. Our data suggest an unanticipated regulatory network linking translational control by and repression of a structural NPC component modulating the p53 pathway through its effectors.


Conflict of interest statement

The authors declare no competing interests.

Figures

Fig. 1
Fig. 1
Full induction of p21 is Nup155-dependent. a Protein fold-changes (blue and grey dots) including p53 targets (red dots) upon Nup155 (orange dot) knockdown compared to the control siRNA (AS) condition are shown as log2 ratios. p21 is highlighted in green as a key effector of the p53 response. Overall 3523 proteins could be quantified by quantitative mass spectrometry in HepG2 cells treated with Nutlin-3a for 24 h. b HepG2 cells were treated either with control siRNA (AS) or three different Nup155 siRNAs (Nup155#1, Nup155#2, and Nup155#3) for 72 h and p53 was induced by adding Nutlin-3a for 24 h. Cell extracts were analysed by immunoblotting with indicated antibodies (upper panel). Densitometric quantification of immunoblots derived from three independent experiments is shown in the lower panel and normalised to the control siRNA (AS) condition. c HepG2 cells were treated either with control siRNA (AS) or two different Nup35, Nup93, and Nup188 siRNAs (Nup35#1, Nup35#2, Nup93#1, Nup93#2, Nup188#1, and Nup188#2) for 72 h. Cells were harvested upon 24 h of Nutlin-3a treatment and extracts were analysed by immunoblotting with the indicated antibodies. For corresponding densitometric analyses see Supplementary Figure 1B-D. d Protein fold-changes of NPC components (purple dots) upon Nup155 knockdown (orange dot) corresponding to the conditions described in a. e Representative confocal microscopy pictures of MAb414 immunofluorescence staining of HepG2 cells treated as indicated. DAPI was used for DNA labeling. Scale bar = 10 µm. *p < 0.05, **p < 0.01, ***p < 0.001 (Student′s t-test). Data are presented as mean ± stdv. Source data are provided as a Source Data file
Fig. 2
Fig. 2
Nup155 is involved in p21 mRNA translation. a H24-p21 cells containing a tetracycline (Tet-off)-regulatable p21 expression construct were either treated with control siRNA (AS) or two different Nup155 siRNAs (Nup155#1 and Nup155#2) for 72 h. p21 was induced by tetracycline (Tet) removal 96 h before harvesting. Cell extracts were analysed by immunoblotting with the indicated antibodies. For corresponding densitometric analyses see Supplementary Figure 2A. b Relative p21 (CDKN1A) mRNA levels of the corresponding conditions described in a were measured by qRT-PCR. Data are derived from three independent experiments and normalised to the Tet-off control siRNA (AS) condition. c HepG2 cells were treated either with control siRNA (AS) or two different Nup155 siRNAs (Nup155#1 and Nup155#2) for 72 h. p21 was induced by adding Nutlin-3a 24 h before blocking translational elongation with cycloheximide. Cells were harvested at indicated time points and analysed by immunoblotting with the indicated antibodies (left panels). Densitometric quantification analyses of the above-mentioned p21 half-life experiments normalised to the control siRNA condition (right panel). d HepG2 cells were treated either with control siRNA (AS) or two different Nup155 siRNAs for 72 h. Translational elongation was blocked with cycloheximide and polyribosome analyses were performed. p21 (left panel) and tubulin beta mRNA (right panel) of the polysomal (poly) and subpolysomal (subpoly) fractions were measured by qRT-PCR with the expression levels normalised to Renilla spike-in RNA. p-values result from the comparison of the control (AS) (n = 5) and combined Nup155 siRNAs (n = 7), see also Methods section. **p < 0.01, ***p < 0.001 (Student′s t-test); Data are presented as mean ± stdv. Source data are provided as a Source Data file
Fig. 3
Fig. 3
Nup155-dependent p21 mRNA translation is independent of the 3′/5′UTR and potentially involves FTSJ1. ad H1299 cells were treated either with control (AS) or two different Nup155 siRNAs (Nup155#1 and Nup155#2) for 72 h and either co-transfected with a control vector (pcDNA3) or different p21 expression constructs with p21 full-length (p21FL) (a) or constructs that lack either the 3′UTR (p21Δ3′UTR) (b) or the 5′UTR and the 3′UTR (p21Δ3′Δ5'UTR) (c). A GFP-expressing construct served as a negative control (d). Cell extracts were analysed by immunoblotting with the indicated antibodies (upper panels) and corresponding densitometric analyses derived from three independent experiments are shown in the lower panels and are normalised to the control siRNA condition. e Candidates with a suggested role in mRNA translation and downregulated upon Nup155 knockdown as revealed by the proteomic approach (see Fig. 1A) were included in a focused RNAi approach. Reduced p21 protein accumulation and unaltered p53 levels as assayed by immunoblotting were considered as phenocopy of Nup155 depletion. Corresponding immunoblots show p21 and p53 levels (under Nutlin-3a treatment) either from the control siRNA (AS) condition or the candidate knockdown conditions (using two different siRNAs #1 and #2). Actin served as loading control. f HepG2 cells were treated either with control siRNA (AS) or two Nup155 siRNAs (Nup155#1 and Nup155#2) for 72 h and p53 was induced by adding Nutlin-3a for 24 h. Cell extracts were analysed by immunoblotting with indicated antibodies. For densitometric analyses see Supplementary Figure 3B. *p < 0.05, **p < 0.01, ***p < 0.001 (Student′s t-test); Data are presented as mean ± stdv. Source data are provided as a Source Data file
Fig. 4
Fig. 4
FTSJ1 knockdown phenocopies Nup155 depletion. a Upper panel: HepG2 cells were treated either with control siRNA (AS) or two FTSJ1 siRNAs (FTSJ#1 and FTSJ1#2) for 72 h and p53 was induced by adding Nutlin-3a for 24 h. Cell extracts were analysed by immunoblotting with indicated antibodies. Middle panel: densitometric quantification analyses of p21 immunoblots derived from three independent experiments normalised to the Nutlin-3a control siRNA condition. For densitometric analyses of FTSJ1 and p53 see Supplementary Figure 4 A. Lower panel: relative p21 (CDKN1A) mRNA levels of the corresponding conditions described above were measured by qRT-PCR. Data are derived from three independent experiments and normalised to the Nutlin-3a control siRNA condition. b HepG2 cells were treated either with control siRNA (AS) or two different FTSJ1 siRNAs (FTSJ1#1 and FTSJ1#2) for 72 h. Polyribosome analyses were performed as described in Fig. 2d. p21 (CDKN1A) mRNA (left panel) and tubulin beta (TUBB) mRNA (right panel) of the polysomal (poly) and subpolysomal (subpoly) fractions were measured by qRT-PCR with the expression levels normalized to Renilla spike-in RNA. p-values result from the comparison of the control (AS) (n = 5) and combined FTSJ1 siRNAs (n = 4). The control siRNA (AS) condition is identical to that shown in Fig. 2d (see also Methods section). *p < 0.05, **p < 0.01, ***p < 0.001 (Student′s t-test); Data are presented as mean ± stdv. Source data are provided as a Source Data file
Fig. 5
Fig. 5
HDAC4 is involved in FTSJ1 transcriptional regulation. a Relative mature (upper panel) and nascent (lower panel) mRNA levels of FTSJ1 in HepG2 cells upon Nup155 knockdown and Nutlin-3a treatment for 24 h as measured by qRT-PCR. Data are derived from three independent experiments and normalised to the control siRNA condition. b HepG2 cells were treated either with control siRNA (AS) or two different HDAC4 siRNAs (HDAC4#1 and HDAC4#2) for 72 h and p53 was induced by adding Nutlin-3a for 24 h. Relative nascent mRNA levels of FTSJ1 (upper panel) and HDAC4 (lower panel) as measured by qRT-PCR. Data are derived from three independent experiments and normalised to the control siRNA (AS) condition. c HepG2 cells were co-transfected with HDAC4-Flag and Nup155-HA constructs for 24 h. Empty vector control (−). Relative FTSJ1 mRNA level as measured by qRT-PCR. Data are derived from three independent experiments and normalised to the control vector condition. *p < 0.05, **p < 0.01, ***p < 0.001 (Student′s t-test); Data are presented as mean ± stdv. Source data are provided as a Source Data file
Fig. 6
Fig. 6
Nup155 and FTSJ1 are targets of p53-mediated repression. a Sk-Hep1 cells were treated either with DMSO or Nutlin-3a for 24 h and 48 h. Cell extracts were analysed by immunoblotting with indicated antibodies (upper panel). Nup155 and FTSJ1 densitometric analyses of immunoblots derived from three independent experiments (middle panels) normalised to the DMSO condition. Relative nascent mRNA levels of NUP155 and FTSJ1 as measured by qRT-PCR (lower panels). Data are derived from three independent experiments and normalised to the DMSO condition. b Sk-Hep1 cells were treated either with control siRNA (AS) or two different p53 siRNAs (p53#1 and p53#2) for 72 h. Cells were harvested upon 48 h of Nutlin-3a treatment and extracts were analysed by qRT-PCR (NUP155 upper panel; FTSJ1 lower panel). Data are derived from three independent experiments and normalised to the Nutlin-3a control siRNA condition. c Sk-Hep1 cells were treated either with control siRNA (AS) or two different p21 siRNAs (p21#1 and p21#2) for 72 h. Cells were harvested upon 24 h of Nutlin-3a treatment and extracts were analysed by qRT-PCR (NUP155 left panel; FTSJ1 middle panel; p21 (CDKN1A) lower panel). Data are derived from three independent experiments and normalised to the Nutlin-3a control siRNA condition. *p < 0.05, **p < 0.01, ***p < 0.001 (Student′s t-test); Data are presented as mean ± stdv. Source data are provided as a Source Data file
Fig. 7
Fig. 7
p53 status, Nup155 and FTSJ1 expression are correlated in murine and human HCC. a Murine N-rasG12V and Myc-driven HCC which developed in a Tpr53-deleted (Trp53−/−, n = 4) or -wild-type (Trp53+/+, n = 4) background were analysed by immunoblotting with the indicated antibodies. b Relative transcript levels of NUP155 (left panel) and FTSJ1 (right panel), in HCC tissue (n = 247) compared to non-tumorous liver tissue (n = 239). The center line of the box plots denotes the median, the bounds of the box indicate the 25th to 75th percentiles and the whiskers represent the 5th to 95th percentiles, respectively. ***p < 0.001 (Student′s t-test). c Correlation of NUP155 and FTSJ1 in HCC tissue (n = 247). r Pearson correlation coefficient, p Pearson p-value. d Suggested feedback loop model linking p53/p21 with Nup155 and FTSJ1. Source data are provided as a Source Data file

References

    1. Vousden KH, Prives C. Blinded by the light: the growing complexity of p53. Cell. 2009;137:413–431. doi: 10.1016/j.cell.2009.04.037. - DOI - PubMed
    1. Kastenhuber ER, Lowe SW. Putting p53 in context. Cell. 2017;170:1062–1078. doi: 10.1016/j.cell.2017.08.028. - DOI - PMC - PubMed
    1. el-Deiry WS, et al. WAF1, a potential mediator of p53 tumor suppression. Cell. 1993;75:817–825. doi: 10.1016/0092-8674(93)90500-P. - DOI - PubMed
    1. Abbas T, Dutta A. p21 in cancer: intricate networks and multiple activities. Nat. Rev. Cancer. 2009;9:400–414. doi: 10.1038/nrc2657. - DOI - PMC - PubMed
    1. Jung YS, Qian Y, Chen X. Examination of the expanding pathways for the regulation of p21 expression and activity. Cell. Signal. 2010;22:1003–1012. doi: 10.1016/j.cellsig.2010.01.013. - DOI - PMC - PubMed

Publication types

MeSH terms