. 2019 May 14;10(1):2157.
doi: 10.1038/s41467-019-09882-8.

miR-155 harnesses Phf19 to potentiate cancer immunotherapy through epigenetic reprogramming of CD8+ T cell fate

Affiliations

miR-155 harnesses Phf19 to potentiate cancer immunotherapy through epigenetic reprogramming of CD8+ T cell fate

Yun Ji et al. Nat Commun. .

Abstract

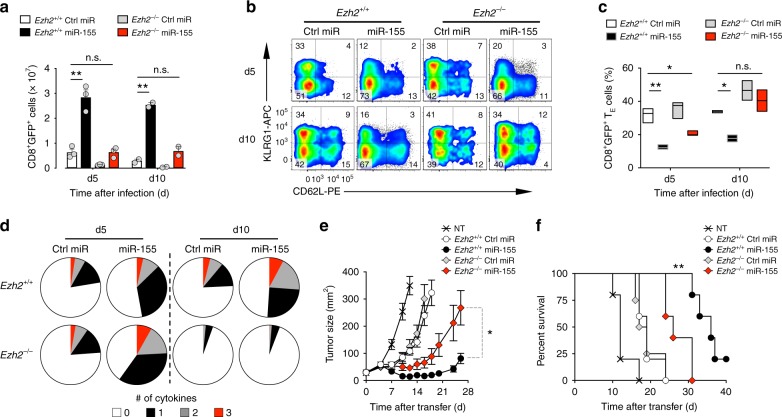
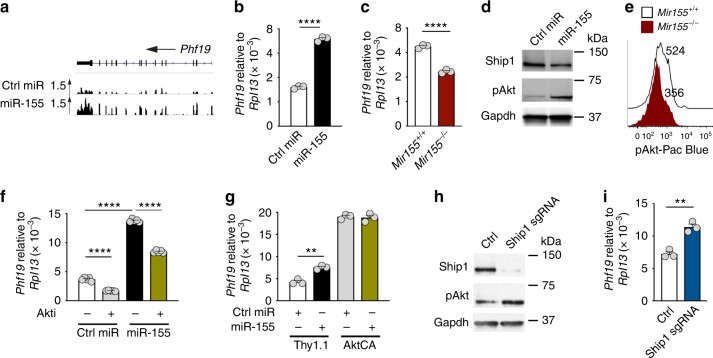
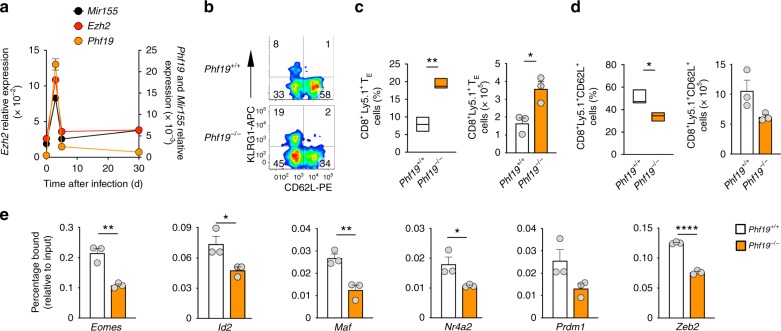
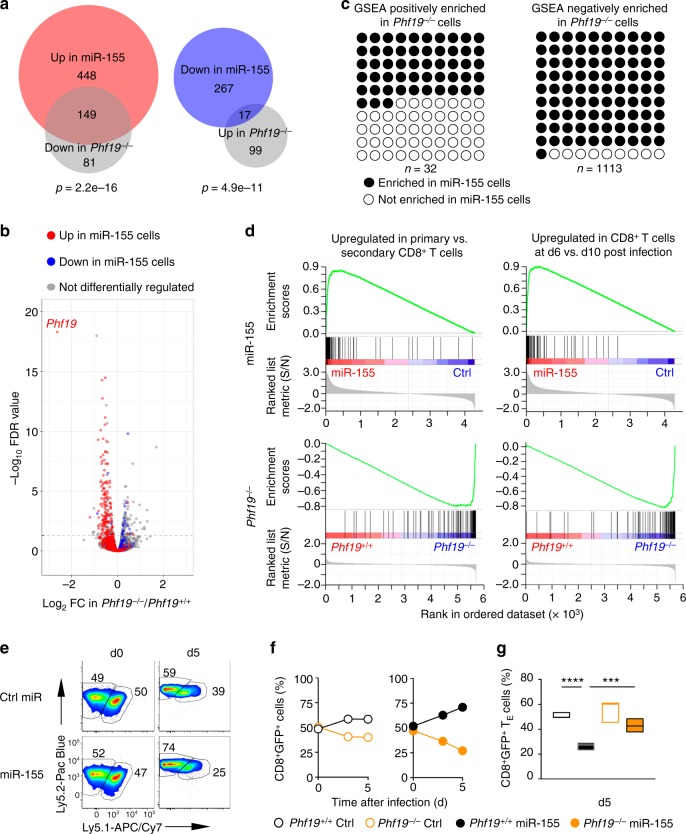
T cell senescence and exhaustion are major barriers to successful cancer immunotherapy. Here we show that miR-155 increases CD8+ T cell antitumor function by restraining T cell senescence and functional exhaustion through epigenetic silencing of drivers of terminal differentiation. miR-155 enhances Polycomb repressor complex 2 (PRC2) activity indirectly by promoting the expression of the PRC2-associated factor Phf19 through downregulation of the Akt inhibitor, Ship1. Phf19 orchestrates a transcriptional program extensively shared with miR-155 to restrain T cell senescence and sustain CD8+ T cell antitumor responses. These effects rely on Phf19 histone-binding capacity, which is critical for the recruitment of PRC2 to the target chromatin. These findings establish the miR-155-Phf19-PRC2 as a pivotal axis regulating CD8+ T cell differentiation, thereby paving new ways for potentiating cancer immunotherapy through epigenetic reprogramming of CD8+ T cell fate.


Conflict of interest statement

Y.J. and L.G. are the inventors of an international pending patent on Phf19 technology (“T-CELLS MODIFIED TO OVEREXPRESS PHF19” PCT/US2018/036125 filed on 05 June 2018, applied by THE UNITED STATES OF AMERICA, AS REPRESENTED BY THE SECRETARY, DEPARTMENT OF HEALTH AND HUMAN SERVICE; Office of Technology Transfer National Institutes of Health 6011 Executive Boulevard, Suite 325, MSC 7660 Bethesda, Maryland 20892–7660, US). The remaining authors declare no competing interests.

Figures

Fig. 1
Fig. 1
miR-155 epigenetically silences CD8+ T cell differentiation. a Negative enrichment of H3K27me3 genes (left) and PRC2 (middle) and Suz12 (right) targets in miR-155-overexpressing cells. b Quantitative RT-PCR of Eed, Ezh2, and Suz12 mRNA in miR-155 and Ctrl-overexpressing cells sorted 5 days following adoptive transfer of 3 × 105 pmel-1 CD8+ T cells transduced with miR-155 or Ctrl-miR into wild-type mice in conjunction with gp100-VV. Bars (mean ± s.e.m. of technical triplicates) are relative to Rpl13 mRNA. c Number of splenic pmel-1 CD8+GFP+ T cells assessed at different time points after transfer as in b. d Flow cytometry of splenic pmel-1 CD8+GFP+ T cells 5 days after transfer as in b. Numbers indicate the percentage of cells after gating on live CD8+GFP+ T cells. e Percentage of terminal effector (KLRG1+CD62L, TE) in the spleen assessed at different time points after transfer as in b. Data are presented as box plots extending to minimum and maximum values. Bands inside the boxes represent median values of three individual mice. f Percentage of pmel-1 CD8+Thy1.1+Vβ13+ TE cells per generation after adoptive transfer of 1.5 × 105 pmel-1 TCR transduced CFSE-labeled Mir155+/+ or Mir155−/− CD8+ T cells into Ly5.1 mice in conjunction with gp100-VV. g Flow cytometry of CD8+Thy1.1+Vβ13+ T cells in generation #8 and #9 after transfer as in f. Numbers indicate the percentage of cells after gating on live CD8+Thy1.1+Vβ13+ T cells. h H3K27me3 marks and RNA-seq reads at gene loci known to promote CD8+ T cell terminal differentiation in miR-155 and Ctrl-miR-overexpressing cells. ChIP-seq was performed on KLRG1 pmel-1 CD8+ T cells transduced with miR-155 or Ctrl-miR and cultured in vitro for 5 days. Gene expression was evaluated by RNA-seq of KLRG1CD62L cells sorted from transferred cells 5 days after adoptive transfer of 3 × 105 miR-155 or Ctrl-miR-overexpressing cells into wild-type mice in conjunction with gp100-VV. RNA-seq data were obtained from triplicated groups of three individual mice. Data are representative of at least two independent experiments (bg), *P < 0.05; **P < 0.01; ****P < 0.001 (unpaired two-tailed Student’s t-test)
Fig. 2
Fig. 2
Ezh2 is required for the enhanced CD8+ T cell antitumor immunity conferred by miR-155. a Number of live CD8+GFP+ T cells in the spleen assessed at day 5 and 10 following adoptive transfer of 3 × 105 pmel-1 Ezh2+/+ or Ezh2−/− CD8+ T cells transduced with miR-155 or Ctrl-miR into B16 tumor-bearing mice in conjunction with gp100-VV. Bars represent the mean ± s.e.m. of three or two individual mice. b Flow cytometry of splenic CD8+GFP+ T cells 5 and 10 days after transfer as in a. Numbers indicate the percentage of cells after gating on live CD8+GFP+ T cells. c Percentage of splenic pmel-1 CD8+GFP+ TE cells at indicated time points after transfer. Data are presented as box plots extending to minimum and maximum values. Bands inside the boxes represent median values of three individual mice. d Combinatorial cytokine response of splenic CD8+GFP+ T cells 5 and 10 days after transfer as in a, as determined by the Boolean combination of gates identifying IFN-γ+, IL-2+, and TNF+ cells. Data are presented as the mean of three individual mice. ef Tumor size (mean ± s.e.m.) (e) and survival curve (f) of B16 tumor-bearing mice after adoptive transfer of 4 × 106 cells generated as in a in conjunction with gp100-VV (n = 5 mice/group). NT no treatment. Data are representative of two independent experiments. *P < 0.05; **P < 0.01 (unpaired two-tailed Student’s t-test) (a, d), **P < 0.01 [a Log-rank (Mantel-Cox) Test] (f)
Fig. 3
Fig. 3
Deletion of Jarid2 does not recapitulate the functional advantages conferred by miR-155 in CD8+ T cells. a Sequence alignment of the Jarid2 3′ UTR in multiple species. The predicted miR-155 target site sequence is shown in capital bold. b Jarid2 protein level in miR-155-overexpressing cells assessed by Immunoblot. c Quantitative RT-PCR of Jarid2 mRNA in pmel-1 Jarid2+/+ and pmel-1 Jarid2–/– cells. Bars (mean ± s.e.m. of technical triplicates) are relative to Rpl13 mRNA. d Flow cytometry of splenic CD8+GFP+ T cells assessed at different time points following adoptive transfer of 3 × 105 pmel-1 Jarid2fl/fl CD8+ T cells transduced with GFP-Cre or Ctrl GFP into wild-type mice in conjunction with gp100-VV. Numbers indicate the percentage of cells after gating on live CD8+GFP+ T cells. e Number of splenic pmel-1 CD8+GFP+ T cells at day 5 after transfer as in d. Bars represent the mean ± s.e.m. of three individual mice. f Flow cytometry of splenic pmel-1 CD8+GFP+ T cells 5 days after transfer as described in d. Numbers indicate the percentage of cells after gating on live CD8+GFP+ T cells. g Percentage of splenic pmel-1 CD8+GFP+ TE cells at indicated time points after transfer as in d. Data are presented as box plots extending to minimum and maximum values. Bands inside the boxes represent median values of three individual mice. h Tumor size (left, mean ± s.e.m.) and survival curve (right) of B16 tumor-bearing mice after adoptive transfer of 2 × 106 cells in conjunction with gp100-VV and IL-2 (n = 5 mice/group). NT no treatment. Data are representative of two independent experiments. **P < 0.01 (unpaired two-tailed Student’s t-test) (c, g, and h: left); ***P < 0.005 [a Log-rank (Mantel-Cox) Test] (h: right)
Fig. 4
Fig. 4
miR-155 promotes Phf19 expression by enhancing Akt signaling via downregulation of Ship1. a, b RNA-seq reads (a) and quantitative RT-PCR (b) of Phf19 mRNA in miR-155 and Ctrl-miR-overexpressing cells. Bars (mean ± s.e.m. of technical triplicates) are relative to Rpl13 mRNA. c Quantitative RT-PCR of Phf19 mRNA in in vitro activated KLRG1 miR-155 sufficient and deficient CD8+ T cells. Bars (mean ± s.e.m. of technical triplicates) are relative to Rpl13 mRNA. d Ship1 and pAkt levels in miR-155-overexpressing cells assessed by Immunoblot. e pAkt levels of in vitro activated KLRG1 miR-155 sufficient and deficient CD8+ T cells assessed by flow cytometry. f, g Quantitative RT-PCR of Phf19 mRNA in ex vivo sorted CD8+ T cells overexpressing miR-155 and Ctrl-miR after a 6 h incubation with or without AKT inhibitor VIII (Akti) (f) or transduction with constitutively active Akt (AktCA) or Thy1.1 control (g). Bars represent the mean ± s.e.m. of technical triplicates. h Ship1 and pAkt levels in Cas9+ CD8+ T cells transduced with Ship1-specific gRNA assessed by Immunoblot. i Quantitative RT-PCR of Phf19 mRNA in Cas9+ CD8+ T cells transduced with Ship1-specific gRNA or control. Bars represent the mean ± s.e.m. of technical triplicates. Data are representative of two independent experiments. *P < 0.05; **P < 0.01; ****P < 0.001 (unpaired two-tailed Student’s t-test)
Fig. 5
Fig. 5
Phf19 restricts CD8+ T cell terminal differentiation. a Quantitative RT-PCR of Mir155, Ezh2, and Phf19 after transfer of 105 pmel-1 CD8+Ly5.1+ T cells into wild-type mice in conjunction with gp100-VV assessed at the indicated points. Ezh2 and Phf19 levels are relative to Rpl13, Mir155 levels are relative to U6. b Flow cytometry of splenic live CD8+Ly5.1+ T cells 5 days after transfer of 3 × 105 naïve pmel-1 CD8+Ly5.1+ Phf19+/+ or Phf19−/− T cells into wild-type mice in conjunction with gp100-VV. Numbers indicate percentage after gating on live CD8+Ly5.1+ T cells. c Percentage (left) and number (right) of splenic pmel-1 CD8+Ly5.1+ TE cells 5 days after transfer as in b. d Percentage (left) and number (right) of splenic CD8+Ly5.1+CD62L+ T cells 5 days after adoptive transfer as in b. Data are presented as box plots extending to minimum and maximum values. Bands inside the boxes represent median values of three individual mice. e ChIP-qPCR using H3K27me3 antibody on in vitro activated non TE KLRG1 Phf19+/+ or Phf19−/− T cells with primers specific to the transcription start site of selected TFs. ChIP enrichments are presented as the percentage of protein bound, normalized to input. Bars represent the mean ± s.e.m. of technical triplicates. Data are representative of two independent experiments. *P < 0.05; **P < 0.01; ****P < 0.001 (unpaired two-tailed Student’s t-test)
Fig. 6
Fig. 6
Phf19 is a critical downstream factor of miR-155 in CD8+ T cells. a Venn diagrams and b volcano plot depicting the number of overlapping differentially expressed genes between differentially expressed genes in miR-155-overexpressing and Phf19−/− KLRG1CD62L CD8+ T cells. Gene expression was evaluated by RNA-seq of pmel-1 KLRG1CD62L CD8+ T cells 5 days after adoptive transfer of 3 × 105 pmel-1 Phf19+/+/Phf19−/− cells or pmel-1 cells overexpressing Ctrl-miR/miR-155 into wild-type mice in conjunction with gp100-VV. RNA-seq data were obtained from triplicated groups of three individual mice. c Gene sets significantly enriched (FDR < 0.25) in Phf19−/− CD8+ T cells. Gene sets also enriched in miR-155 overexpressing cells are highlighted in black. d Enrichment of genes upregulated in CD8+ T cells responding to primary vs secondary LCMV infections (left panels) and enrichment of genes upregulated in CD8+ T cells at d6 vs d10 post LmOVA infections (right panels) in miR-155-overexpressing and Phf19−/− CD8+ T cells. e Flow cytometry analysis of congenically-distinguishable live pmel-1 Phf19+/+ Ly5.2+/+ and pmel-1 Phf19−/− Ly5.1+/− cells transduced with either miR-155 or Ctrl-miR assessed pre-transfer and 5 days after co-transfer of 3 × 105 cells into wild-type mice in conjunction with gp100-VV administration. Numbers adjacent to outlined areas indicate percentage after gating on live CD8+GFP+ T cells. f, g Percentages of live pmel-1 CD8+GFP+ T cells transduced with Ctrl-miR (left panel) or miR-155 (right panel) (f) and CD8+ GFP+ TE cells (g) at indicated time points after transfer as described in e. Symbols represent the mean ± s.e.m. of three individual mice; small horizontal lines (right panel) indicate the mean ± s.e.m. Data are representative of two independent experiments. ***P < 0.005; ****P < 0.001 (unpaired two-tailed Student’s t-test)
Fig. 7
Fig. 7
Phf19 epigenetically reprograms T cell antitumor immunity. a Amino acid sequence alignment of the partial aromatic cage of Phf19. Tryptophan (W) and tyrosine (Y) residues were mutated to cysteine (C) or alanine (A), respectively. b Immunoblot of total, soluble, and chromatin-bound proteins from CD8+ T cells transduced with the Phf19Thy1.1, Phf19mutThy1.1, and Thy1.1 control. c Flow cytometry of splenic T cells at indicated time points following adoptive transfer of 3 × 105 pmel-1 CD8+ T cells transduced with Phf19Thy1.1, Phf19mutThy1.1, or Thy1.1 into wild-type mice in conjunction with gp100-VV. Numbers indicate percentage after gating on live CD8+ Thy1.1+ T cells. d Number of splenic pmel-1 CD8+Thy1.1+ T cells 5 days after transfer as in c. Bars represent the mean ± s.e.m. of three individual mice. e Flow cytometry of splenic CD8+Thy1.1+ T cells at indicated time points after transfer as in c. Numbers indicate percentage after gating on live CD8+Thy1.1+ T cells. f Percentage of splenic pmel-1 CD8+Thy1.1+ TE cells at indicated time points as in c. Data are presented as box plots extending to minimum and maximum values. Bands inside the boxes represent median values of three individual mice. g Intracellular cytokine staining of splenic CD8+Thy1.1+ T cells 5 days after transfer as in c. Numbers indicate percentage after gating on live CD8+Thy1.1+ T cells. h Combinatorial cytokine response of splenic CD8+Thy1.1+ T cells as in c, as determined by the Boolean combination of gates identifying IFN-γ+, IL-2+, and TNF+ cells. Data are presented as the mean of three individual mice. i Tumor size (left, mean ± s.e.m.) and survival curve (right) of B16 tumor-bearing mice receiving 2 × 106 cells generated as in c in conjunction with gp100-VV and IL-2 (n = 7 mice/group). NT no treatment. Data are representative of two independent experiments. *P < 0.05; **P < 0.01; ***P < 0.005; ****P < 0.001 (unpaired two-tailed Student’s t-test) (d, h, and i left); *P < 0.05 (a Log-rank (Mantel-Cox) Test) (i right)
Fig. 8
Fig. 8
The miR-155-PRC2 circuitry potentiates antitumor immunity by epigenetically reprogramming CD8+ T cell fate. Cartoon depicting the regulatory circuitry by which miR-155 epigenetically reprograms CD8+ T cell fate and function via enhancement of PRC2 activity. TFs, Transcription factors

References

    1. Schietinger A, Greenberg PD. Tolerance and exhaustion: defining mechanisms of T cell dysfunction. Trends Immunol. 2014;35:51–60. doi: 10.1016/j.it.2013.10.001. - DOI - PMC - PubMed
    1. Gattinoni L, Klebanoff CA, Restifo NP. Paths to stemness: building the ultimate antitumour T cell. Nat. Rev. Cancer. 2012;12:671–684. doi: 10.1038/nrc3322. - DOI - PMC - PubMed
    1. Gattinoni L, et al. Wnt signaling arrests effector T cell differentiation and generates CD8 + memory stem cells. Nat. Med. 2009;15:808–813. doi: 10.1038/nm.1982. - DOI - PMC - PubMed
    1. Ji Y, et al. Repression of the DNA-binding inhibitor Id3 by Blimp-1 limits the formation of memory CD8 + T cells. Nat. Immunol. 2011;12:1230–1237. doi: 10.1038/ni.2153. - DOI - PMC - PubMed
    1. Gautam S, et al. The transcription factor c-Myb regulates CD8(+) T cell stemness and antitumor immunity. Nat. Immunol. 2019;20:337–349. doi: 10.1038/s41590-018-0311-z. - DOI - PMC - PubMed

Publication types

MeSH terms

Substances