. 2019 May 14;9(1):7381.
doi: 10.1038/s41598-019-43689-3.

MicroRNA-126 regulates Hypoxia-Inducible Factor-1α which inhibited migration, proliferation, and angiogenesis in replicative endothelial senescence

Affiliations

MicroRNA-126 regulates Hypoxia-Inducible Factor-1α which inhibited migration, proliferation, and angiogenesis in replicative endothelial senescence

Matilde Alique et al. Sci Rep. .

Abstract

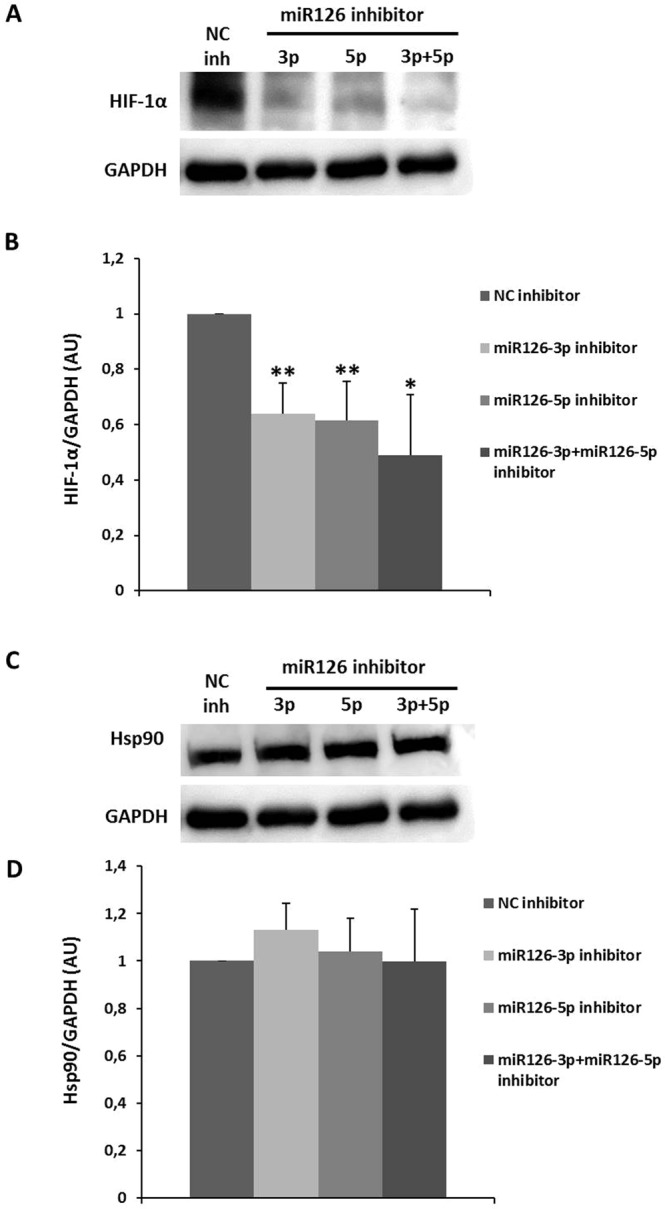
Whereas a healthy endothelium maintains physiological vascular functions, endothelial damage contributes to the development of cardiovascular diseases. Endothelial senescence is the main determinant of endothelial dysfunction and thus of age-related cardiovascular disease. The objective of this study is to test the involvement of microRNA-126 and HIF-1α in a model of replicative endothelial senescence and the interrelationship between both molecules in this in vitro model. We demonstrated that senescent endothelial cells experience impaired tube formation and delayed wound healing. Senescent endothelial cells failed to express HIF-1α, and the microvesicles released by these cells failed to carry HIF-1α. Of note, HIF-1α protein levels were restored in HIF-1α stabilizer-treated senescent endothelial cells. Finally, we show that microRNA-126 was downregulated in senescent endothelial cells and microvesicles. With regard to the interplay between microRNA-126 and HIF-1α, transfection with a microRNA-126 inhibitor downregulated HIF-1α expression in early passage endothelial cells. Moreover, while HIF-1α inhibition reduced tube formation and wound healing closure, microRNA-126 levels remained unchanged. These data indicate that HIF-1α is a target of miRNA-126 in protective and reparative functions, and suggest that their therapeutic modulation could benefit age-related vascular disease.


Conflict of interest statement

The authors declare no competing interests.

Figures

Figure 1
Figure 1
HUVECs senescence markers. HUVECs develop a senescence phenotype with increasing passage number in vitro. The percentage of senescent HUVECs at different passages was determined by senescence-associated β-galactosidase staining (A) and C12FDG fluorescence staining (B). The data represent means ± SD and are expressed as a percentage of total cells and fold induction respectively with respect to control values (early passage cells). Early passage endothelial cells, n = 6; senescent endothelial cells (n = 6); 10 random fields/each; magnification, x100. (C) Cyclin D1 and (D) Lamin B1 representative Western blots in early passage and senescent HUVECs pools. Equal protein loading was confirmed probing with β-actin. The graphs present densitometric band analysis normalized to β-actin in arbitrary units (AU). The data represent means ± SD and are expressed as fold induction with respect to control values (early passage cells). Early passage endothelial cells n = 3 pools; senescent endothelial cells. n = 3 pools. *p < 0.05, **p < 0.01 and ***p < 0.001. Early passage vs. senescent HUVECs cells. In the figure graphs, the early passage is called young.
Figure 2
Figure 2
Wound healing in HUVECs monolayers. (A) Representative photomicrographs of early passage and senescent HUVECs monolayers 8 hours after wounding. β-galactosidase staining is showed at the final time. Note the flattened morphology and positive senescence-associated SA-β-gal staining of the senescent cells. Red lines indicate the edge of the wound repopulating cells. Magnification 100x. (B) Time course of changes in the size of the remaining wound. The data points represent the % open area means ± SD. Early passage endothelial cells, n = 9 in duplicate; senescent endothelial cells, n = 6 in duplicate. *p < 0.05, **p < 0.01 and ***p < 0.001. Early passage vs. senescent HUVECs cells at the same time. Endothelial tube formation in HUVECs. The spontaneous formation of capillary-like structures by HUVEC on Matrigel was used to assess angiogenic potential. (C) Light microscope pictures and (D,E) fluorescent microscopy (for HUVECs treated with calcein AM) photomicrographs of early passage and senescent HUVECs seeded on Matrigel-coated wells after 6 h. Early passage HUVECs migrated to form connected tubular networks; senescent HUVECs significantly attenuated network formation. (FH) Total segment length, total tube length and the number of nodes were quantitated from photographs of early passage and senescent HUVECs after 6 hours. (C and D: Magnification: 100x; E: Magnification: 40x). Data are expressed as means ± SD. Early passage endothelial cells, n = 10 in triplicate; senescent endothelial cells, n = 6 in quadruple. *p < 0.05, **p < 0.01, Early passage vs. senescent HUVECs. In the figure graphs, the early passage is called young.
Figure 3
Figure 3
HIF-1α mRNA, and HIF-1α and Hsp90 protein levels in HUVECs. (A) qPCR analysis of HIF-1α mRNA levels in early passage and senescent HUVECs pools using the ΔCt method; HPRT1 mRNA was used for normalization. Early passage endothelial cells, n = 3 pools; senescent endothelial cells, n = 3 pools. *p < 0.05. (B,C) Representative HIF-1α and Hsp90 western blot of early passage and senescent HUVECs pools. Equal protein loading was confirmed probing with GAPDH. The graphs present densitometric band analysis normalized to GAPDH in arbitrary units (AU). Early passage endothelial cells, n = 3 pools; senescent endothelial cells, n = 3 pools. Early passage vs. senescent HUVECs. HIF-1α and Hsp90 protein levels of MVs released by HUVECs. (D) Representative HIF-1α and (E) Hsp90 western blot of early passage and senescent MVs pools. Equal protein loading was confirmed probing with Ponceau red staining. The graphs present densitometric band analysis normalized to Ponceau red staining in arbitrary units (AU). Early passage endothelial MVs, n = 3 pools; senescent endothelial MVs, n = 3 pools. The data represent means ± SD. ***p < 0.001. Early passage vs. senescent. In the figure graphs, the early passage is called young.
Figure 4
Figure 4
DFO effect on HIF-1α protein in senescent HUVECs. (A) qPCR analysis of HIF-1α mRNA in control and DFO-treated senescent HUVECs using the ΔCt method; HPRT1 mRNA was used for normalization. (B) Representative HIF-1α and (D) Hsp90 western blots in control and DFO-treated (100 µM, 8 hours) senescent HUVECs. Equal protein loading was confirmed probing with GAPDH. (C,E) The graphs present densitometric band analysis normalized to GAPDH in arbitrary units (AU). The data represent means ± SD. Control vs. DFO-treated senescent HUVECs cells. ***p < 0.001 n = 4.
Figure 5
Figure 5
DFO effect on wound healing in senescent HUVECs. (A) Representative photomicrographs of senescent and DFO-treated senescent HUVECs cells 8 hours after wounding. Red lines indicate the edge of the wound repopulating cells. Magnification 100x. (B) Time course of changes in the size of the remaining wound. The data points represent the % open area means ± SD. n = 4 in duplicate.
Figure 6
Figure 6
MiR-126 in early passage and senescent HUVECs and MVs. QPCR analysis of miR-126-3p and miR-126-5p was performed in early passage and senescent HUVECs pools (A,B,C) and MVs (D,E) using the ΔCt method; U6 snRNA was used for normalization in HUVECs. MVs were normalized to a spike in (miR39-3p) levels. (A) miR-126-5p expression was lower than miR-126-3p expression in early passage and senescent HUVECs using early passage HUVECs miR-126-3p levels as a control. ***p < 0.001, miR-126-5p vs miR-126-3p in early passage HUVECs. (B) miR-126-3p and (C) miR-126-5p expression was diminished in senescent HUVECs versus early passage HUVECs. (D) miR-126-3p and (E) miR-126-5p expression were diminished in senescent MVs compared with early passage MVs. Early passage endothelial HUVECs and MVs, n = 3 pools; senescent endothelial HUVECs and MVs, n = 3 pools. The data represent means ± SD. *p < 0.05, **p < 0.01 and ***p < 0.001. Early passage vs. senescent HUVECs or MVs. In the figure graphs, the early passage is called young.
Figure 7
Figure 7
Effect of YC-1 on HIF-1α and Hsp90 proteins in early passage HUVECs. Representative (A) HIF-1α and (B) Hsp90 protein western blots in early passage HUVECs treated with different doses of YC-1. Equal protein loading was confirmed probing with GAPDH. The graphs present densitometric band analysis normalized to GAPDH in arbitrary units (AU). The data represent means ± SD. n = 4. YC-1 treated vs. Control ***p < 0.001.
Figure 8
Figure 8
Effect of YC-1 in a scratch assay. (A) Representative photomicrographs of cell monolayers 8 hours after wounding. Red lines indicate the edge of the wound repopulating cells. Magnification 100x. (B) Time course of changes in the size of the remaining wound. The data points represent the % open area means ± SD. Control: n = 9 in duplicate; YC-1 30, 50 and 100 µM: n = 4 in duplicate; YC-1 treated vs. Control at the same time. *p < 0.05, **p < 0.01 and ***p < 0.001. (C) Effect of YC-1 on tube formation in HUVECs. Light microscope pictures of HUVECs seeded on Matrigel-coated wells and treated with different YC-1 concentrations for 6 h. Two representative series of images of endothelial tube structures were shown. Control HUVECs migrated to form connected tubular networks. YC-1-treated HUVECs significantly attenuated network formation. (DF) Quantitative analysis of the total segment length, total tube length and the number of nodes were performed from photographs. Magnification: 100x. Data are expressed as means ± SD. Control cells, n = 10 in triplicate; YC-1 treated cells, n = 4 in triplicate. YC-1 treated vs. Control. *p < 0.05, **p < 0.01 and ***p < 0.001.
Figure 9
Figure 9
Effect of miR-126 inhibition on HIF-1α and Hsp90 protein levels in early passage HUVECs. (A) Representative HIF-1α western blot in early passage HUVECs transfected with negative control (NC) inhibitor, miR-126-3p strand, miR-126-5p strand or both sequence inhibitors, miR-126-3p plus miR-126-5p for 72 hours. Equal protein loading was confirmed probing with GAPDH. (B) The graphs present densitometric band analysis normalized to GAPDH in arbitrary units (AU). The data represent means ± SD. n = 3.Control vs. miR-126-transfected early passage HUVECs cells. *p < 0.05 and **p < 0.01. (C) Representative Hsp90 western blot in early passage HUVECs transfected with negative control (NC) inhibitor, miR-126-3p strand, miR-126-5p strand or both sequence inhibitors, miR-126-3p plus miR-126-5p for 72 hours. Equal protein loading was confirmed probing with GAPDH. (D) The graphs present densitometric band analysis normalized to GAPDH in arbitrary units (AU). The data represent means ± SD. n = 3.
Figure 10
Figure 10
Schematic representation of miR-126 and HIF-1α signaling pathway in replicative senescence model in vitro.

References

    1. Rajendran P, et al. The vascular endothelium and human diseases. Int J Biol Sci. 2013;9:1057–1069. doi: 10.7150/ijbs.7502. - DOI - PMC - PubMed
    1. Carrecedo J, R.-C. R., Alique M. & Ramírez-Chamond R. Endothelial cell senescence in the pathogenesis of endothelial dysfunction. 1–16 (Intech, 2018).
    1. Luna C, et al. Aging-associated oxidized albumin promotes cellular senescence and endothelial damage. Clinical Interventions in. Aging. 2016;11:225–236. doi: 10.2147/CIA.S91453. - DOI - PMC - PubMed
    1. Longatto Filho Adhemar, Lopes José Manuel, Schmitt Fernando C. Angiogenesis and Breast Cancer. Journal of Oncology. 2010;2010:1–7. doi: 10.1155/2010/576384. - DOI - PMC - PubMed
    1. Guo L, et al. CD163+ macrophages promote angiogenesis and vascular permeability accompanied by inflammation in atherosclerosis. J Clin Invest. 2018;128:1106–1124. doi: 10.1172/JCI93025. - DOI - PMC - PubMed

Publication types

MeSH terms