. 2019 May 15;15(5):e1008090.
doi: 10.1371/journal.pgen.1008090. eCollection 2019 May.

Maternal Nanos inhibits Importin-α2/Pendulin-dependent nuclear import to prevent somatic gene expression in the Drosophila germline

Affiliations

Maternal Nanos inhibits Importin-α2/Pendulin-dependent nuclear import to prevent somatic gene expression in the Drosophila germline

Miho Asaoka et al. PLoS Genet. .

Abstract

Repression of somatic gene expression in germline progenitors is one of the critical mechanisms involved in establishing the germ/soma dichotomy. In Drosophila, the maternal Nanos (Nos) and Polar granule component (Pgc) proteins are required for repression of somatic gene expression in the primordial germ cells, or pole cells. Pgc suppresses RNA polymerase II-dependent global transcription in pole cells, but it remains unclear how Nos represses somatic gene expression. Here, we show that Nos represses somatic gene expression by inhibiting translation of maternal importin-α2 (impα2) mRNA. Mis-expression of Impα2 caused aberrant nuclear import of a transcriptional activator, Ftz-F1, which in turn activated a somatic gene, fushi tarazu (ftz), in pole cells when Pgc-dependent transcriptional repression was impaired. Because ftz expression was not fully activated in pole cells in the absence of either Nos or Pgc, we propose that Nos-dependent repression of nuclear import of transcriptional activator(s) and Pgc-dependent suppression of global transcription act as a 'double-lock' mechanism to inhibit somatic gene expression in germline progenitors.


Conflict of interest statement

The authors have declared that no competing interests exist.

Figures

Fig 1
Fig 1. Nos and Pum repress Impα2 production in pole cells.
(A–C) impα2 mRNA expression in pole cells of embryos derived from nos/+ (A), nos/nos (nos) (B), and pum/pum (pum) females (C) mated with y w males. Stage-5 embryos were stained for impα2 mRNA. Arrowheads point to pole cells. (D–H, D’–H’) Impα2 protein expression in pole cells of embryos derived from nos/+ (D and D’), nos (E and E’), and pum females (F and F’), and y w females with (impα2-nos3´UTR) (H and H’) or without two copies of impα2-nos3´UTR (y w) (G and G’). Stage-5 embryos were stained with anti-Impα2 23aa antibody (green, D–H), which recognizes only Impα2 protein among the Importin-α family of proteins [48]. DIC images (D’–H’) are also shown. Arrows and arrowheads point to pole cells with and without Impα2 expression, respectively. Scale bars, 20 μm (C) and 10 μm (H’). (I) Fluorescence intensities of Impα2 protein signals in pole cells of embryos derived from nos/+, nos, pum, y w, and impα2-nos3´UTR females. Embryos from late stage 4 to stage 6 were stained with anti–Impα2 23aa antibody, and fluorescence intensities of Impα2 signals were measured (see Materials and Methods). Mean values of fluorescence intensities (± SE) are shown. For each genotype, 7–17 embryos were examined. The numbers of pole cells measured are shown in parentheses. Significance was calculated using paired t-test (*: P < 0.01, n.s.: P > 0. 05).
Fig 2
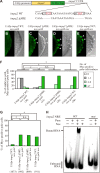
Fig 2. Nos represses impα2 translation in an NRE-like sequence–dependent manner.
(A) Schematic representation of UASp-impα2 WT and UASp-impα2 ΔNRE, which express impα2 WT and impα2 ΔNRE mRNAs, respectively. A triple Myc tag sequence (green) was inserted just before the termination codon in the impα2 protein-coding region (yellow). impα2 WT mRNA retains an intact 3´ UTR of impα2 containing a single NRE-like sequence, GUUGU(Xn)AUUGUU (boxed) [28]. By contrast, impα2 ΔNRE contains an altered impα2 3´ UTR, in which the sequences GUUGU and AUUGUU were precisely deleted. Evolutionarily conserved Pum-binding sequences (UGU trinucleotides) are shown in red [–22]. (B–E) Stage-5 embryos derived from UASp-impα2 WT/+; nos-gal4/+ (UASp-impα2 WT; nos-gal4) (B), UASp-impα2 ΔNRE/+; nos-gal4/+ (UASp-impα2 ΔNRE; nos-gal4) (C), UASp-impα2 ΔNRE/+; nos-gal4 nos/nos (UASp-impα2 ΔNRE; nos-gal4 nos) (D), and UASp-impα2 WT/+; nos-gal4 nos/nos (UASp-impα2 WT; nos-gal4 nos) females (E) mated with y w males were stained for Myc (green). DIC images (right) are also shown. Arrowheads point to pole cells expressing Myc-tagged protein. Scale bar, 20 μm. (F and G) Expression of Myc was examined in pole cells of embryos from late stage 4 to stage 6. Embryos were derived from females described above. Percentages of embryos carrying 0 (white), 1–3 (gray), 4–6 (pale green), or ≥7 (green) pole cells with Myc signal are shown in F. Percentages of pole cells with Myc signal are shown in G. The numbers of embryos or pole cells examined are shown in parentheses. Significance was calculated using Fisher’s exact test (*: P < 0.01, n.s.: P > 0.1). (H) EMSA was performed using impα2 RNA fragment containing wild-type (WT) or mutated (mut) NRE-like sequence; nucleotide sequences are shown in S2 Fig. Labeled RNA with (+) or without (-) Pum or Nos was incubated as described in Materials and Methods.
Fig 3
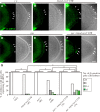
Fig 3. Nos represses nuclear import of Ftz-F1 in pole cells by inhibiting Impα2 production.
(A–D) Ftz-F1 distribution in pole cells of embryos derived from y w (A), nos/+ (B), nos (C), and impα2-nos3´UTR (D) females mated with y w males. Stage-5 embryos were double-stained for Ftz-F1 (green) and nuclei (propidium iodide: magenta). DIC images (right) are also shown. Large arrows and arrowheads point to pole cells with Ftz-F1 signal enriched in the nucleus and cytoplasm, respectively. Small arrows point to pole cells with Ftz-F1 signal evenly distributed in the nucleus and cytoplasm. Note that Ftz-F1 is enriched in somatic nuclei. (E–I) Magnified images of pole cells double-stained for Ftz-F1 (green) and propidium iodide (magenta). Pole cells shown by yellow arrowheads in A (E) and B (F), small and large yellow arrows in C (G and H), and large yellow arrow in D (I) are shown. DIC images (right) are also shown. Dashed thick and thin lines outline pole cells and their nuclei, respectively. Scale bars, 10 μm (A) and 2 μm (E). (J) Expression of Ftz-F1 was examined in pole cell nuclei of embryos from late stage 4 to stage 6. Embryos were derived from nos/+, nos, y w, and impα2-nos3´UTR females mated with y w males. Percentages of embryos containing 0 (white), 1–3 (pale orange), 4–6 (orange), or ≥7 (red) pole cells with enrichment of Ftz-F1 signal in the nucleus are shown. For each genotype, 19–57 embryos were observed. Significance was calculated using Fisher’s exact test (*: P < 0.01). (K) Nuclear import of Ftz-F1 in pole cells of embryos derived from y w (lime green), nos/+ (green), nos (pink), and impα2-nos3´UTR females (pinkish-purple), mated with y w males. Embryos from late stage 4 to stage 5 were double-stained with anti-Ftz-F1 antibody and DAPI or propidium iodide. Fluorescence intensities of Ftz-F1 signal in the nuclear and cytoplasmic areas of individual pole cells were measured on each section of serial confocal images, and the ratio of fluorescence intensities (nucleus/cytoplasm) was calculated (see Materials and Methods). Percentages of pole cells with each fluorescence intensity ratio are shown. For each genotype, 133–299 pole cells were counted. Significances were calculated using chi-square test.
Fig 4
Fig 4. Mis-expression of Impα2 causes ectopic expression of ftz in pole cells lacking Pgc.
(A–F) ftz mRNA expression in pole cells of embryos derived from y w (A) and impα2-nos3´UTR females (B and C), and from pgc/pgc females with (pgc impα2-nos3´UTR) (F) or without two copies of impα2-nos3´UTR (pgc) (D and E). Stage-5 embryos were stained for ftz mRNA (green, left). DIC images (right) are also shown. Arrows or arrowheads point to pole cells with or without ftz signal, respectively. Although ftz signal was occasionally detected in pole cells of impα2-nos3´UTR embryos (C) and pgc embryos (E), the signal intensity in these pole cells was usually less than that in pole cells of pgc impα2-nos3´UTR embryos (F). Scale bar, 20 μm. (G) Expression of ftz mRNA was examined in pole cells of embryos from late stage 4 to stage 5. Embryos were derived from y w, impα2-nos3´UTR, pgc/+, pgc, pgc/+; impα2-nos3´UTR/impα2-nos3´UTR (pgc/+ impα2-nos3´UTR), and pgc impα2-nos3´UTR females mated with y w males. Percentages of embryos containing 0 (white), 1 (gray), 2–4 (pale green), or ≥5 (green) pole cells with ftz mRNA signal are shown. The numbers of embryos examined are shown in parentheses. Significance was calculated using Fisher’s exact test (*: P < 0.01).
Fig 5
Fig 5. Nos and Pgc are both required to repress ftz expression in pole cells.
(A–G, A’–G’, A”–G”) ftz mRNA expression in pole cells of embryos derived from y w (A–A”), pgc/Df (pgc) (B–B” and C–C”), nos (D–D” and E–E”), and pgc/pgc; nos/nos (pgc nos) females (F–F” and G–G”) mated with y w males. Stage-5 embryos were triple-stained for ftz mRNA (green), Vasa (magenta), and nuclear DNA (DAPI: blue). Scale bar, 30 μm. (H) Expression of ftz mRNA was examined in pole cells of embryos from late stage 4 to stage 5. Embryos were derived from nos/+, nos, pgc, and pgc nos females mated with y w males. Percentages of embryos containing 0 (white), 1 (gray), 2–4 (pale green), or ≥5 (green) pole cells with ftz mRNA signal are shown. The numbers of embryos examined are shown in parentheses. Significance was calculated using Fisher’s exact test (*: P < 0.01, n.s.: P > 0.5).
Fig 6
Fig 6. Mis-expression of Impα2 in pole cells has no significant effects on mitosis, apoptosis, or migration of pole cells.
(A) Expression of a mitotic marker PH3 was examined in pole cells of embryos derived from y w, nos, impα2-nos3’UTR, and pgc impα2-nos3’UTR females mated with y w males. Stage-7–9 embryos were double-stained with anti-PH3 (green) and anti-Vasa (a marker for pole cells: magenta) antibodies. Left: representative images of pole cells negative (top) and positive (bottom) for PH3 in stage-8 embryos. DIC images merged with PH3- and Vasa-signals are also shown. Right: percentages of embryos carrying 0 (white), 1 (gray), 2 (pale green), or ≥3 (green) pole cells with PH3 signal are shown. The numbers of embryos examined are shown in parentheses. Significance was calculated using Fisher’s exact test (*: P < 0.05, n.s.: P > 0.5). (B) Expression of an apoptotic marker, cleaved Caspase-3, was examined in pole cells of embryos derived from y w, impα2-nos3’UTR, pgc/pgc (pgc), and pgc impα2-nos3’UTR females mated with y w males. Stage-10–16 embryos were double-stained with anti–cleaved Caspase-3 (green) and anti-Vasa (magenta) antibodies. Left: representative images of pole cells negative (top) and positive (bottom) for cleaved Caspase-3 in stage-12 embryos. DIC images merged with cleaved Caspase-3- and Vasa-signals are also shown. Right: percentages of pole cells expressing cleaved Caspase-3 are shown. The numbers of pole cells examined are shown in parentheses. For each genotype, 10–26 embryos were examined. Significance was calculated using Fisher’s exact test (*: P < 0.01, n.s.: P > 0.1). (C) Stage-14–16 embryos derived from y w, impα2-nos3’UTR, pgc/Df (pgc), and pgc impα2-nos3’UTR females mated with y w males were stained with anti-Vasa antibody (magenta). Left: representative images of pole cells within (top) and outside of (bottom) gonads in stage-14 embryos. DIC images merged with Vasa signal are also shown. Dotted line shows contour of embryonic gonads. Right: percentages of pole cells incorporated in the embryonic gonads. Total numbers of pole cells examined are shown in parentheses. For each genotype, 10–20 embryos were examined. Significance was calculated using Fisher’s exact test (*: P < 0.01, n.s.: P > 0.1). Scale bars, 10 μm (A–C).
Fig 7
Fig 7. Mis-expression of Impα2 in pole cells affects gametogenesis.
(A and B) Ovaries (A) and testes (B) of adults at 2–8 days after eclosion were examined. Flies were derived from y w, impα2-nos3´UTR, pgc/+, pgc/+ impα2-nos3´UTR, pgc, and pgc impα2-nos3´UTR females mated with y w males, or from y w females mated with pgc/+ impα2-nos3´UTR or pgc impα2-nos3´UTR males. Percentages of ovaries (A) and testes (B) showing normal (white), dysgenic (gray), and agametic (black) phenotypes (see S5 Fig) are shown. For each genotype, 88–190 ovaries and 68–252 testes were examined. Significance was calculated using Fisher’s exact test (*: P < 0.05, n.s.: P > 0.1).

References

    1. Extavour CG, Akam M. Mechanisms of germ cell specification across the metazoans: epigenesis and preformation. Development (Cambridge, England). 2003;130(24):5869–84. - PubMed
    1. Illmensee K, Mahowald AP. Transplantation of posterior polar plasm in Drosophila. Induction of germ cells at the anterior pole of the egg. Proc Natl Acad Sci U S A. 1974;71(4):1016–20. - PMC - PubMed
    1. Beams HW, Kessel RG. The problem of germ cell determinants. Int Rev Cytol. 1974;39:413–79. - PubMed
    1. Eddy EM. Germ plasm and the differentiation of the germ cell line. Int Rev Cytol. 1975;43:229–80. - PubMed
    1. Rongo C, Lehmann R. Regulated synthesis, transport and assembly of the Drosophila germ plasm. Trends Genet. 1996;12(3):102–9. - PubMed

Publication types

MeSH terms