. 2019 Aug 15;28(16):2752-2762.
doi: 10.1093/hmg/ddz095.

Cdkn2a (Arf) loss drives NF1-associated atypical neurofibroma and malignant transformation

Affiliations

Cdkn2a (Arf) loss drives NF1-associated atypical neurofibroma and malignant transformation

Steven D Rhodes et al. Hum Mol Genet. .

Abstract

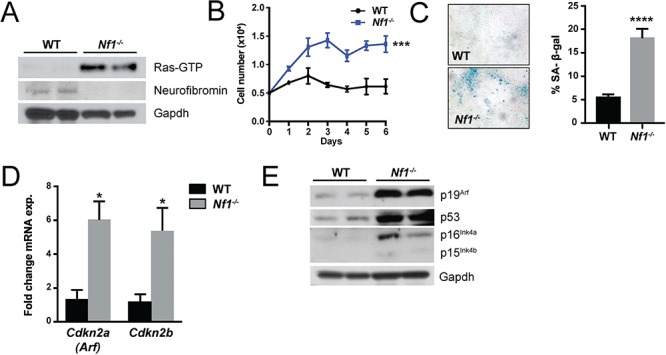
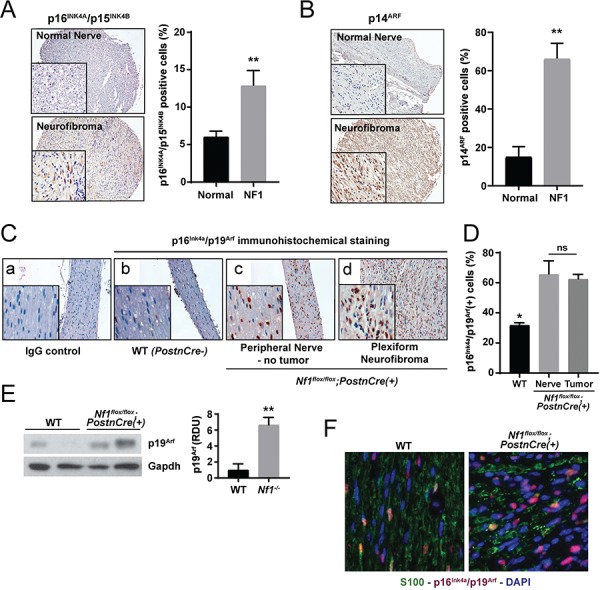
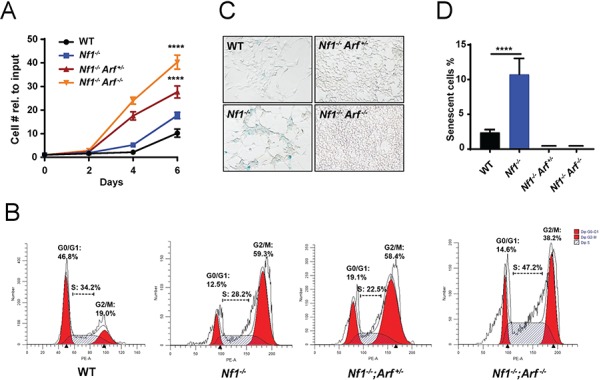
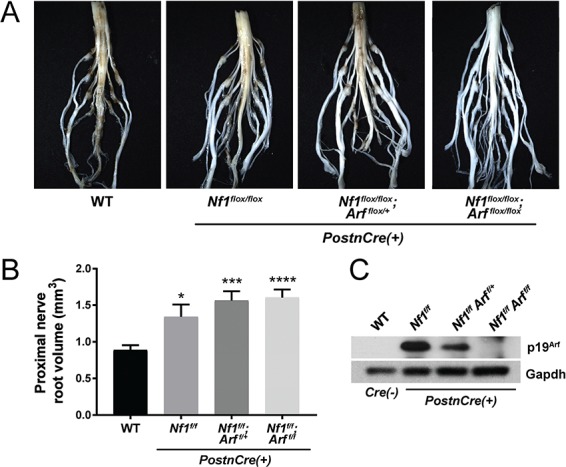
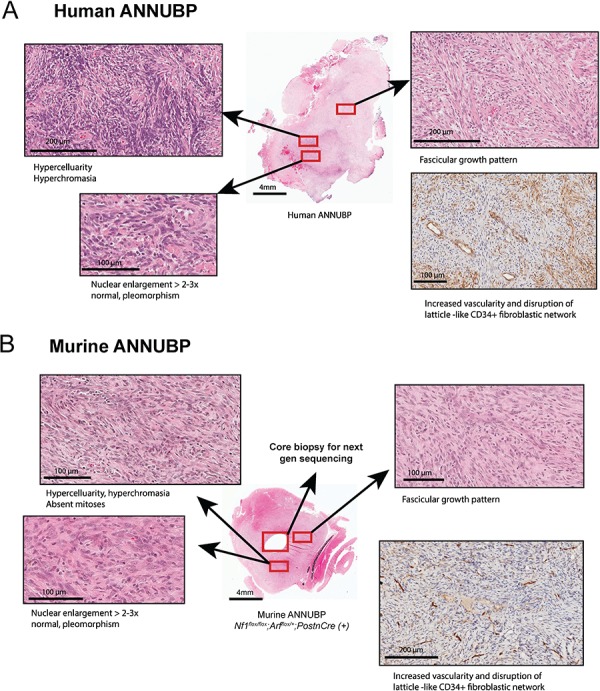
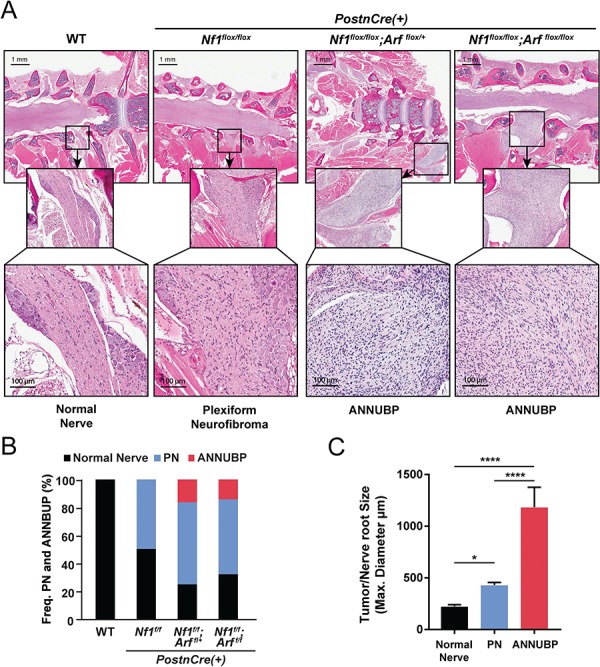
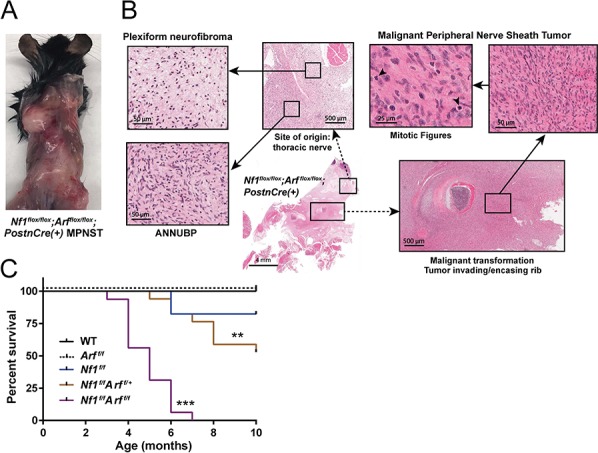
Plexiform neurofibroma (PN) tumors are a hallmark manifestation of neurofibromatosis type 1 (NF1) that arise in the Schwann cell (SC) lineage. NF1 is a common heritable cancer predisposition syndrome caused by germline mutations in the NF1 tumor suppressor, which encodes a GTPase-activating protein called neurofibromin that negatively regulates Ras proteins. Whereas most PN are clinically indolent, a subset progress to atypical neurofibromatous neoplasms of uncertain biologic potential (ANNUBP) and/or to malignant peripheral nerve sheath tumors (MPNSTs). In small clinical series, loss of 9p21.3, which includes the CDKN2A locus, has been associated with the genesis of ANNUBP. Here we show that the Cdkn2a alternate reading frame (Arf) serves as a gatekeeper tumor suppressor in mice that prevents PN progression by inducing senescence-mediated growth arrest in aberrantly proliferating Nf1-/- SC. Conditional ablation of Nf1 and Arf in the neural crest-derived SC lineage allows escape from senescence, resulting in tumors that accurately phenocopy human ANNUBP and progress to MPNST with high penetrance. This animal model will serve as a platform to study the clonal development of ANNUBP and MPNST and to identify new therapies to treat existing tumors and to prevent disease progression.


Figures

Figure 1
Figure 1
Loss of neurofibromin drives Schwann cell senescence. (A) Ras-GTP activity, neurofibromin and Gapdh (loading control) were detected in WT and Nf1−/− SC progenitors by western blot. (B) Proliferation of WT and Nf1−/− SCs was assessed by manual cell counting. n = 3 biological replicates per genotype at each time point. ***P < 0.001 WT versus Nf1−/− by two-way ANOVA. (C) Representative photomicrographs of β-galactosidase stained WT and Nf1−/− primary SCs. The percentage of β-galactosidase positive staining cells was quantified. n = 3 biological replicates per genotype. ****P < 0.0001 WT versus Nf1−/− by Student’s t-test. (D) Expression of senescence associated transcripts, Cdkn2a(Arf) and Cdkn2b in WT and Nf1−/− SCs. n = 3 biological replicates per genotype. *P < 0.05 WT versus Nf1−/− by Student’s t-test. (E) Western blot of p19Arf, p53, p16Ink4a, p15Ink4b and Gapdh (loading control) in WT and Nf1−/− SCs.
Figure 2
Figure 2
Murine and human PN exhibit a senescence signature. (A) IHC staining for p16INK4A/p15INK4B was performed on human PN and healthy control nerve tissues. The percentage of p16INK4 positive staining cells was quantified. n = 8 biological replicates for PN and n = 7 biological replicates for control nerve tissue. **P < 0.01 PN versus normal nerve control by Student’s t-test. (B) IHC for p14ARF in human PN and healthy control nerve tissues. The percentage of p14ARF positive staining cells was quantified. n = 8 biological replicates for PN and n = 4 biological replicates for control nerve tissue. **P < 0.01 PN versus normal nerve control by Student’s t-test. (C) IHC staining of p16Ink4a/p19Arf expression in peripheral nerve tissue from WT and PN bearing Nf1flox/flox;PostnCre(+) mice. (D) The percentage of p16Ink4a/p19Arf-positive staining cells was quantified. n = 3 biological replicates per group. *P < 0.05 for WT versus Nf1flox/flox;PostnCre nerve and tumor tissue. No statistically significant difference (ns) comparing Nf1flox/flox;PostnCre nerve and tumor bearing tissue. (E) Western blot of p19Arf and Gapdh in the trigeminal nerve tissues of WT and Nf1flox/flox;PostnCre(+) mice. Expression was normalized to Gapdh and quantified in relative densitometry units. **P < 0.01 WT versus Nf1flox/flox;PostnCre(+) by one-way ANOVA followed by Tukey’s multiple comparisons test. n = 5 biological replicates per genotype as shown on expanded panel in Supplementary Material, Figure S1. (F) IF with anti-S100 (GFP), anti-p16Ink4a/p19Arf (RFP) and nuclear (DAPI) markers. Representative merged photomicrographs are shown at 20× magnification.
Figure 3
Figure 3
Genetic ablation of p19Arf allows Nf1-null DNSCs to escape senescence and proliferate aberrantly. (A) Proliferation of WT, Nf1−/−, Nf1−/−;Arf +/− and Nf1−/−;Arf −/− DNSCS was assessed by manual cell counting at serial time points as shown. The fold change in cell number relative to input (50 000 cells/well) is shown. (B) Cell cycle of WT, Nf1−/−, Nf1−/−;Arf +/− and Nf1−/−;Arf −/− DNSCS was assessed by flow cytometry. The percentage of cells in G0/G1, S and G2/M phase are denoted as shown. (C) Senescence associated β-galactosidase staining in DNSCs as shown in representative photomicrographs. (D) The percentage of SAS-βgal-positive staining cells relative to total cell number per HPF was quantified. ****P < 0.0001 for Nf1−/− versus WT, Nf1−/−;Arf +/− and Nf1−/−;Arf −/− by one-way ANOVA followed by Tukey’s multiple comparison’s test. n = 3 biological replicates per genotype.
Figure 4
Figure 4
Diffuse morphological changes in the lumbosacral nerve plexus of Nf1/Arf mutant mice. (A) The lumbosacral spinal cord, DRG and associated proximal spinal nerve roots were microdissected from each genotype: WT, Nf1flox/flox, Nf1flox/flox;Arf flox/+ and Nf1flox/flox;Arf flox/flox;PostnCre(+) as shown. (B) Proximal spinal nerve root volume was measured. The number of proximal spinal nerve roots evaluated per genotype are as follows: WT (n = 28), Nf1flox/flox;PostnCre(+) (n = 16), Nf1flox/flox;Arf flox/+;PostnCre(+) (n = 16) and Nf1flox/flox;Arf flox/flox;PostnCre(+) (n = 24). *P < 0.05 WT versus Nf1flox/flox;PostnCre(+).***P < 0.001 WT versus Nf1flox/flox;Arf flox/+;PostnCre(+).****P < 0.0001 WT versus Nf1flox/flox;Arf flox/flox;PostnCre(+). Statistical analysis was performed via one-way ANOVA followed by Sidak’s multiple comparison test. (C) Western blot of p19Arf and Gapdh (loading control) in the trigeminal nerve of each genotype.
Figure 5
Figure 5
Nf1/Arf mutant mice develop tumors that phenocopy human ANNUBP. (A) Tumor arising in a 60-year-old female patient with a diagnosis of NF1 demonstrating increased cellularity, cytological atypia (enlarged, hyperchromatic and pleomorphic appearing nuclei), fascicular growth pattern and disruption of the lattice-like CD34+ fibroblastic network meeting diagnostic criteria ANNUBP. (B) ANNUBP arising in a representative Nf1flox/flox;Arf flox/+;PostnCre(+) mouse recapitulating the histopathological features observed in the human specimen shown above.
Figure 6
Figure 6
Frequency and size of PN and ANNUBP arising from the cervicothoracic spine of Nf1/Arf mutant mice. (A) Coronal whole spinal sections revealing the spinal cord, DRG with associated proximal spinal nerve roots demonstrating PN and ANNUBP arising from the proximal nerve roots of Nf1flox/flox;PostnCre(+), Nf1flox/flox;Arfflox/+;PostnCre(+) and Nf1flox/flox;Arfflox/flox;PostnCre(+) mice. WT mice exhibited normal nerve architecture and cellularity. (B) Stacked bar plot demonstrating the frequency of PN and ANNUBP arising in the cervical thoracic spinal nerve roots of Nf1flox/flox, Nf1flox/flox;Arf flox/+ and Nf1flox/flox;Arfflox/flox;PostnCre(+) mice. The number of proximal spinal nerve roots evaluated per genotype are as follows: WT (n = 85), Nf1flox/flox;PostnCre(+) (n = 85), Nf1flox/flox;Arf flox/+;PostnCre(+) (n = 87) and Nf1flox/flox;Arf flox/flox;PostnCre(+) (n = 86). (C) The maximal diameter of WT control nerve roots and those infiltrated with PN and ANNUBP lesions were measured on coronal spinal sections and plotted as shown. The number of nerve roots and tumors of each histological subtype are as follows: normal nerve (n = 33), PN (n = 27) and ANNUBP (n = 13). Statistical analysis was performed by one-way ANOVA followed by Tukey’s multiple comparisons test. *P < 0.05 normal nerve versus PN. ****P < 0.0001 ANNUBP versus normal nerve and PN.
Figure 7
Figure 7
Nf1/Arf mutant mice die from tumor progression to MPNST. (A) Nf1flox/flox;Arfflox/flox;PostnCre(+) mouse with multiple, rapidly growing and infiltrative masses. A diagnosis of MPNST was confirmed histopathologically post-mortem. (B) PN arising from a thoracic nerve root in a representative Nf1flox/flox;Arfflox/flox;PostnCre(+) mouse. Progression to ANNUBP is observed with hypercellularity, cellular atypia and a fascicular growth pattern. Subsequent transition to MPNST with encasement/invasion of surrounding rib and multiple mitotic figures is seen. (C) Kaplan Meier survival curve of WT (n = 14), Arf flox/flox;PostnCre(+) (n = 9) Nf1flox/flox (n = 17), Nf1flox/flox;Arf flox/+;PostnCre(+) (n = 17) and Nf1flox/flox;Arf flox/flox;PostnCre(+) (n = 16) mice. Statistical analysis was performed using a logrank test with Bonferroni post hoc adjustment for multiple comparisons. ***P < 0.001 Nf1flox/flox;Arfflox/flox;PostnCre(+) versus WT, Arfflox/flox;PostnCre(+) and Nf1flox/flox;PostnCre(+). **P < 0.01 Nf1flox/flox;Arfflox/flox;PostnCre(+) versus Nf1flox/flox;Arf flox/+;PostnCre(+).

References

    1. Carey J.C., Baty B.J., Johnson J.P., Morrison T., Skolnick M. and Kivlin J. (1986) The genetic aspects of neurofibromatosis. Ann. N. Y. Acad. Sci., 486, 45–56. - PubMed
    1. Chen Z., Liu C., Patel A.J., Liao C.P., Wang Y. and Le L.Q. (2014) Cells of origin in the embryonic nerve roots for NF1-associated plexiform neurofibroma. Cancer Cell, 26, 695–706. - PMC - PubMed
    1. Zhu Y., Ghosh P., Charnay P., Burns D.K. and Parada L.F. (2002) Neurofibromas in NF1: Schwann cell origin and role of tumor environment. Science, 296, 920–922. - PMC - PubMed
    1. Evans D.G., Baser M.E., McGaughran J., Sharif S., Howard E. and Moran A. (2002) Malignant peripheral nerve sheath tumours in neurofibromatosis 1. J. Med. Genet., 39, 311–314. - PMC - PubMed
    1. Nguyen R., Dombi E., Widemann B.C., Solomon J., Fuensterer C., Kluwe L., Friedman J.M. and Mautner V.F. (2012) Growth dynamics of plexiform neurofibromas: a retrospective cohort study of 201 patients with neurofibromatosis 1. Orphanet J. Rare Dis., 7, 75. - PMC - PubMed

Publication types

MeSH terms