

Genomic Mismatch at LIMS1 Locus and Kidney Allograft Rejection
- PMID: 31091373
- PMCID: PMC6589355
- DOI: 10.1056/NEJMoa1803731
Genomic Mismatch at LIMS1 Locus and Kidney Allograft Rejection
Abstract
Background: In the context of kidney transplantation, genomic incompatibilities between donor and recipient may lead to allosensitization against new antigens. We hypothesized that recessive inheritance of gene-disrupting variants may represent a risk factor for allograft rejection.
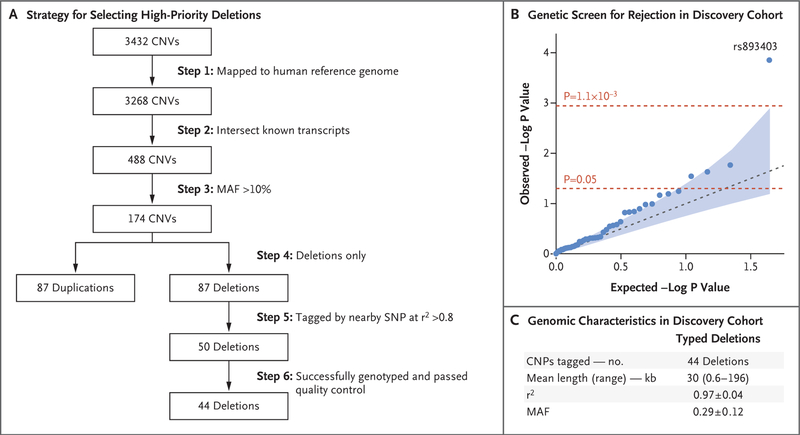
Methods: We performed a two-stage genetic association study of kidney allograft rejection. In the first stage, we performed a recessive association screen of 50 common gene-intersecting deletion polymorphisms in a cohort of kidney transplant recipients. In the second stage, we replicated our findings in three independent cohorts of donor-recipient pairs. We defined genomic collision as a specific donor-recipient genotype combination in which a recipient who was homozygous for a gene-intersecting deletion received a transplant from a nonhomozygous donor. Identification of alloantibodies was performed with the use of protein arrays, enzyme-linked immunosorbent assays, and Western blot analyses.
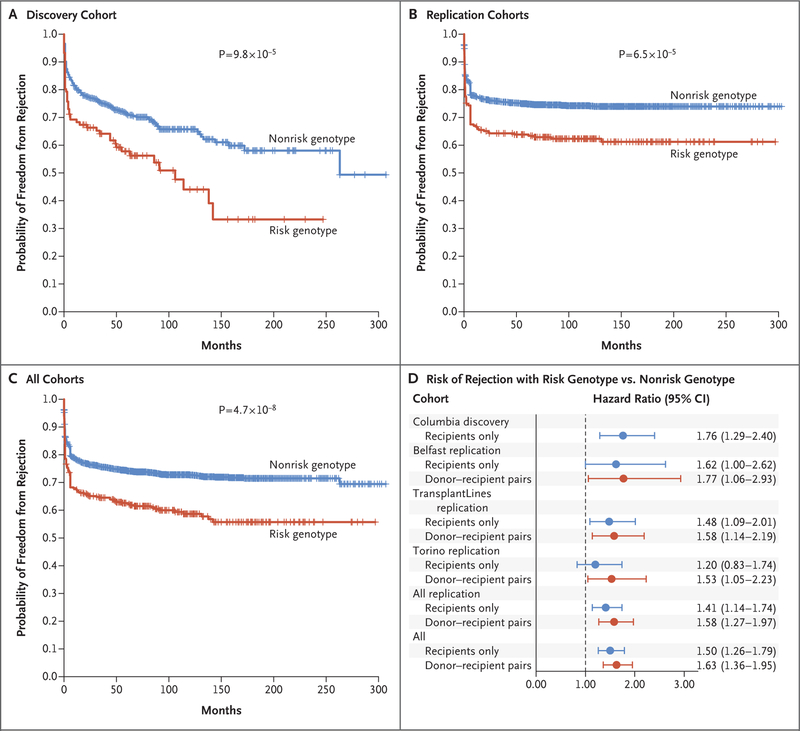
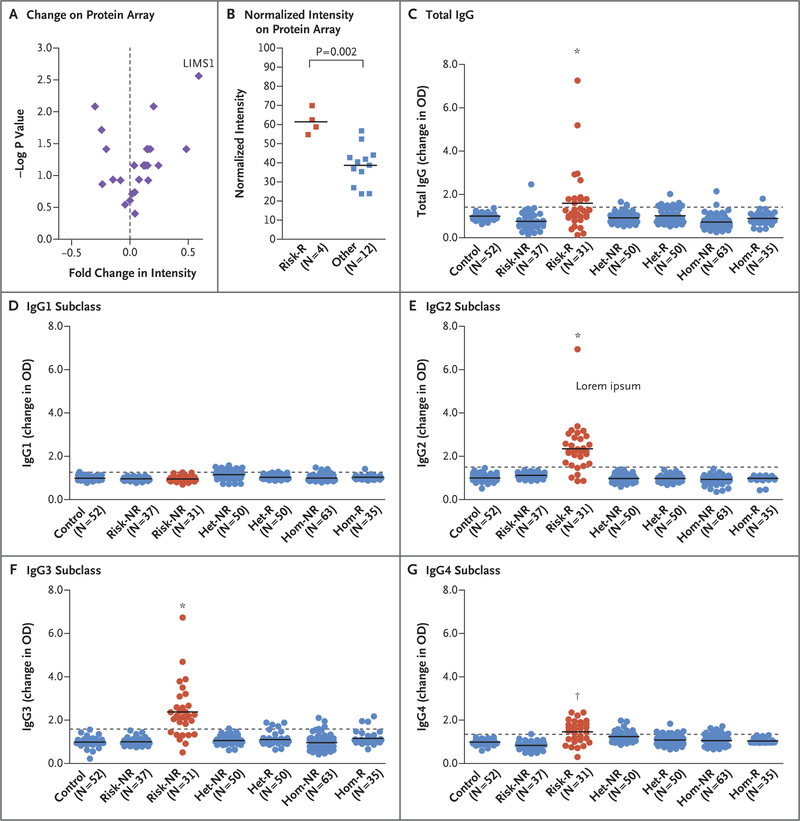
Results: In the discovery cohort, which included 705 recipients, we found a significant association with allograft rejection at the LIMS1 locus represented by rs893403 (hazard ratio with the risk genotype vs. nonrisk genotypes, 1.84; 95% confidence interval [CI], 1.35 to 2.50; P = 9.8×10⁻⁵). This effect was replicated under the genomic-collision model in three independent cohorts involving a total of 2004 donor-recipient pairs (hazard ratio, 1.55; 95% CI, 1.25 to 1.93; P = 6.5×10⁻⁵). In the combined analysis (discovery cohort plus replication cohorts), the risk genotype was associated with a higher risk of rejection than the nonrisk genotype (hazard ratio, 1.63; 95% CI, 1.37 to 1.95; P = 4.7×10⁻⁸). We identified a specific antibody response against LIMS1, a kidney-expressed protein encoded within the collision locus. The response involved predominantly IgG2 and IgG3 antibody subclasses.
Conclusions: We found that the LIMS1 locus appeared to encode a minor histocompatibility antigen. Genomic collision at this locus was associated with rejection of the kidney allograft and with production of anti-LIMS1 IgG2 and IgG3. (Funded by the Columbia University Transplant Center and others.).
Copyright © 2019 Massachusetts Medical Society.
Figures
Comment in
-
Histocompatibility: minor differences have a major impact.Nat Rev Nephrol. 2019 Sep;15(9):529-530. doi: 10.1038/s41581-019-0175-y. Nat Rev Nephrol. 2019. PMID: 31253941 No abstract available.
-
Genomic Mismatch at LIMS1 Locus and Kidney Allograft Rejection.N Engl J Med. 2019 Aug 29;381(9):e16. doi: 10.1056/NEJMc1908072. N Engl J Med. 2019. PMID: 31461602 No abstract available.
-
Genomic Mismatch at LIMS1 Locus and Kidney Allograft Rejection.N Engl J Med. 2019 Aug 29;381(9):e16. doi: 10.1056/NEJMc1908072. N Engl J Med. 2019. PMID: 31461603 No abstract available.
-
Genomic Mismatch at LIMS1 Locus and Kidney Allograft Rejection.N Engl J Med. 2019 Aug 29;381(9):e16. doi: 10.1056/NEJMc1908072. N Engl J Med. 2019. PMID: 31461604 No abstract available.
-
Genomic Mismatch at LIMS1 Locus and Kidney Allograft Rejection.N Engl J Med. 2019 Aug 29;381(9):e16. doi: 10.1056/NEJMc1908072. N Engl J Med. 2019. PMID: 31461605 No abstract available.
References
-
- Magee JC, Barr ML, Basadonna GP, et al. Repeat organ transplantation in the United States, 1996–2005. Am J Transplant 2007;7:1424–33. - PubMed
-
- Sellarés J, de Freitas DG, Mengel M, et al. Understanding the causes of kidney transplant failure: the dominant role of antibody-mediated rejection and nonadherence. Am J Transplant 2012;12:388–99. - PubMed
-
- Opelz G Non-HLA transplantation immunity revealed by lymphocytotoxic anti-bodies. Lancet 2005;365:1570–6. - PubMed
-
- Lachmann N, Terasaki PI, Budde K, et al. Anti-human leukocyte antigen and donor-specific antibodies detected by luminex posttransplant serve as biomarkers for chronic rejection of renal allografts. Transplantation 2009;87:1505–13. - PubMed
-
- Eng HS, Bennett G, Chang SH, et al. Donor human leukocyte antigen specific antibodies predict development and define prognosis in transplant glomerulopathy. Hum Immunol 2011;72:386–91. - PubMed
Publication types
MeSH terms
Substances
Grants and funding
LinkOut - more resources
Full Text Sources
Other Literature Sources
Medical