. 2019 May 14;27(7):2002-2013.e5.
doi: 10.1016/j.celrep.2019.04.062.

Developmental Apoptosis Promotes a Disease-Related Gene Signature and Independence from CSF1R Signaling in Retinal Microglia

Affiliations

Developmental Apoptosis Promotes a Disease-Related Gene Signature and Independence from CSF1R Signaling in Retinal Microglia

Sarah R Anderson et al. Cell Rep. .

Abstract

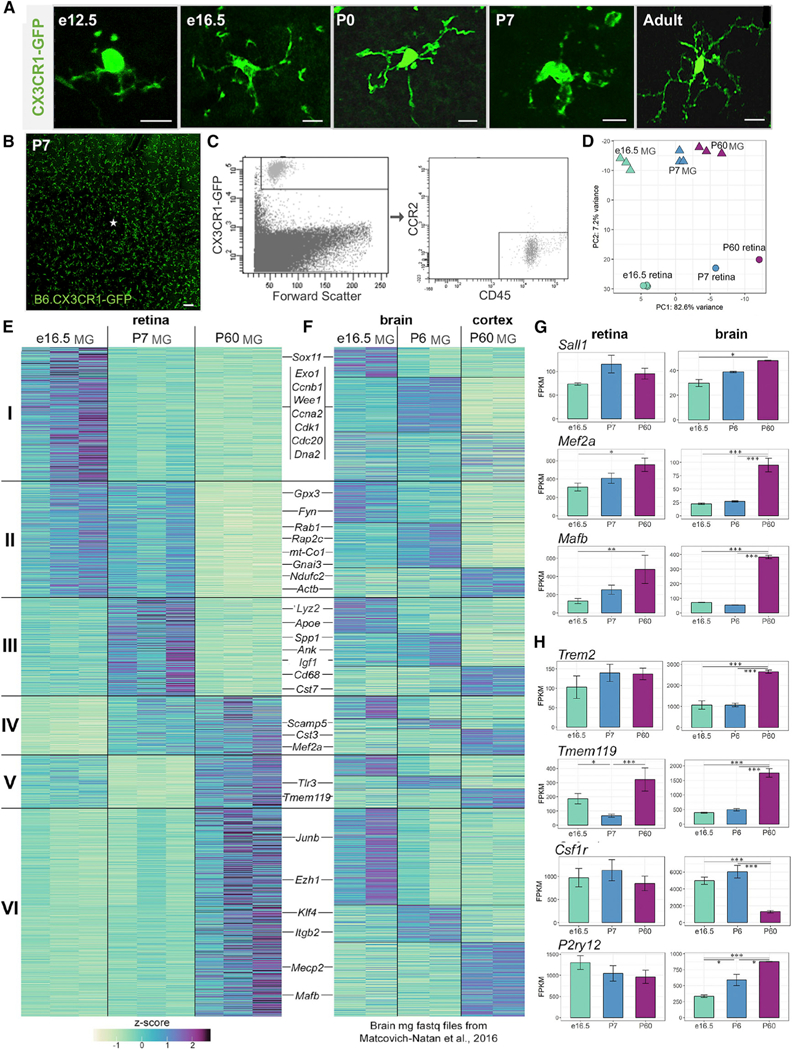
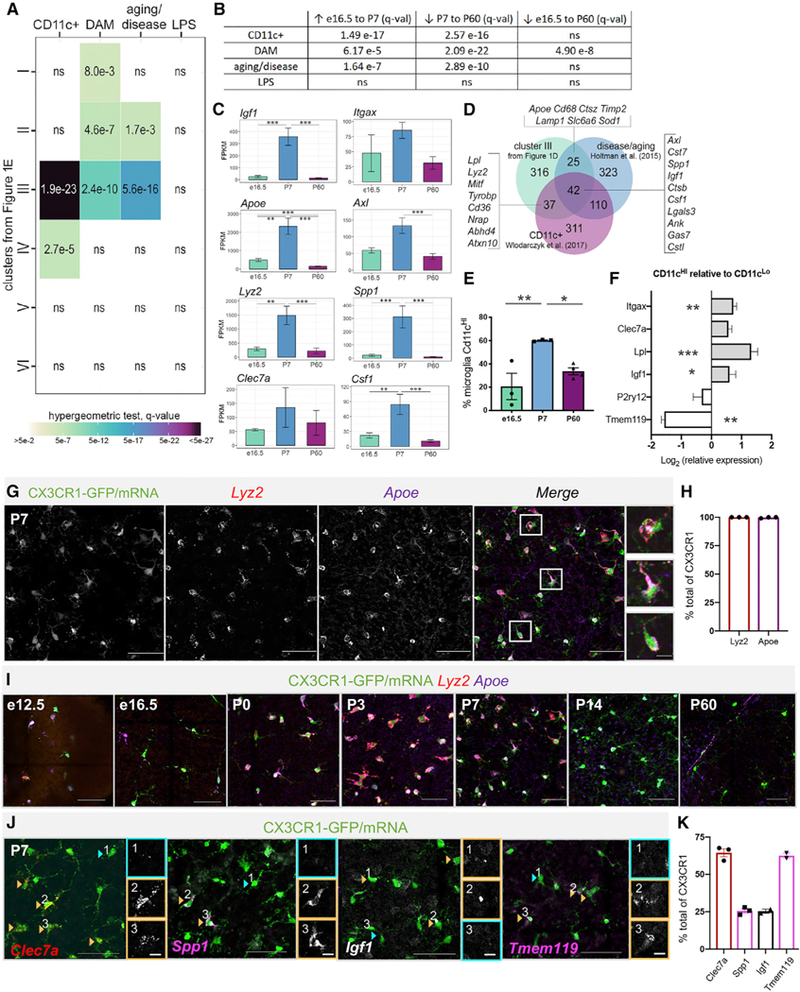
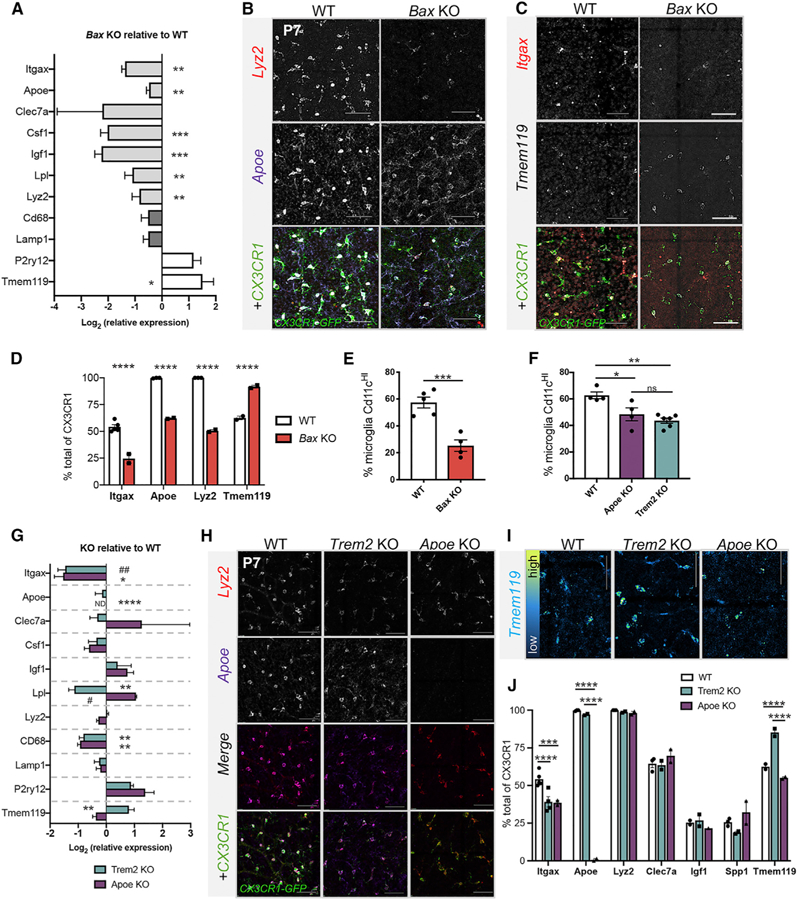
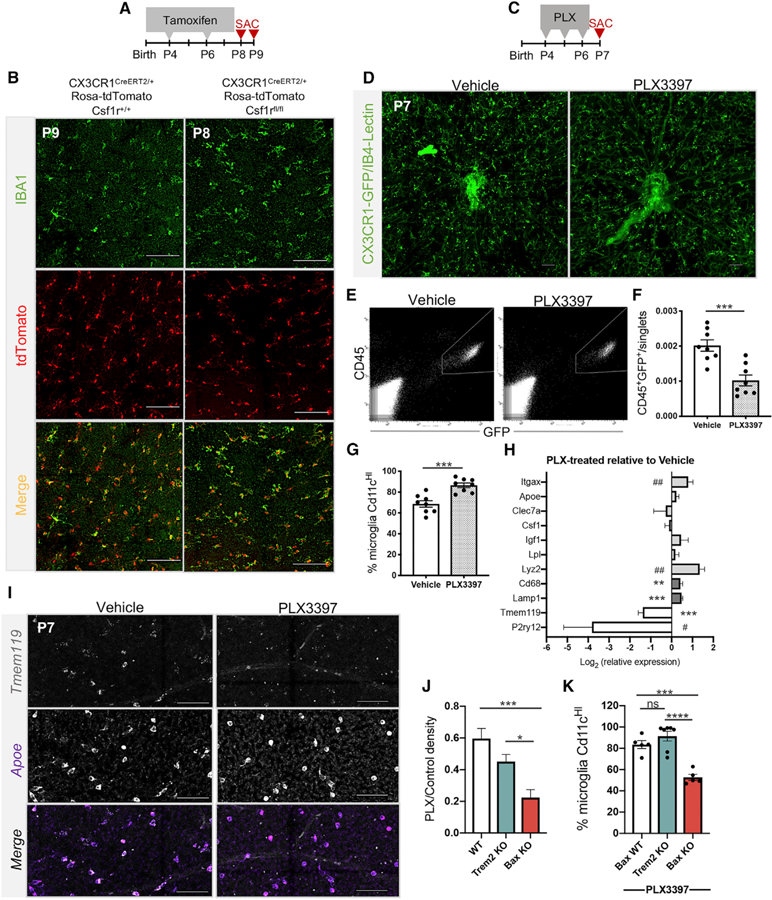
Microglia have important remodeling functions in neurodevelopment, aging, and disease, with evidence for molecular diversity. However, the signaling pathways and environmental cues that drive diverse states of microglia are incompletely understood. We profiled microglia of a discrete developing CNS region, the murine retina. We found distinct transcriptional signatures for retinal microglia across development and peak postnatal density of a population that resembles aging and disease-associated microglia (DAM) and CD11c+ microglia of developing white matter. While TREM2 signaling modulates the expression of select genes, the DAM-related signature is significantly reduced in retinas lacking Bax, a proapoptotic factor required for neuronal death. Furthermore, we found postnatal retinal microglia highly expressing CD11c are resistant to loss or inhibition of colony stimulating factor 1 receptor (CSF1R), while most microglia can be eliminated in Bax knockout retina. Thus, developmental apoptosis promotes a microglia gene signature linked to CSF1R independence that shares features with microglia in developing white matter and in disease.

Keywords: apoptosis; development; disease-associated; microglia; retina; transcriptome.


Conflict of interest statement

DECLARATION OF INTERESTS

The authors declare no competing interests.

Figures

Figure 1
Figure 1. Retinal Microglia Express Core Transcription Factors and Adult Brain Microglial Genes but Have Unique Developmental Transcriptional States
(A) Confocal images of individual microglia in retinal whole mounts. CX3CR1-GFP (green). Scale bar, 10 µm. (B) Retinal whole mount of B6.CX3CR1-GFP at P7. Scale bar, 100 µm. (C) Gating strategy for sorting retinal microglia. (D) Principal component analysis of RNA-seq datasets for whole retina samples (circles) and sorted microglia (MG) samples (triangles) at e16.5 (green), P7 (blue), and P60 (purple). (E) Heatmap of scaled fragments per kilobase of transcript per million mapped reads (FPKM) values for differentially expressed genes, organized into 6 clusters. (F) Brain microglia gene expression compared with the clusters in 1E, organized into 18 sub-clusters. (G and H) Mean FPKM ± SEM for microglial transcription factors (G) and transmembrane proteins (H). *padj ≤ 0.05, **padj≤ 0.01, ***padj ≤ 0.001. See also Figure S1 and Table S1.
Figure 2
Figure 2. Postnatal Retinal Microglia Resemble Aging and Disease-Associated Microglia and CD11c+ Microglia of the Developing White Matter
(A) Comparison by hypergeometric test of retinal microglia clusters (Figure 1E) with upregulated genes from published datasets. (B) GAGE of top 500 upregulated genes from published datasets to all retinal microglia gene counts. ns= not significant. (C) Mean FPKM ± SEM for genes overlapping with disease and aging datasets. *padj≤ 0.05, **padj ≤ 0.01,***padj≤ 0.001. (D) Venn diagram of overlap between cluster III genes from Figure 1E, aging and disease genes, and CD11c+microglia of developing white matter. (E) Average percentage of Cd11cHImicroglia (CD45+GFP+) at e16.5, P7 and P60 by flow cytometry (±SEM; n = 3 each, 2 retinas/sample); One-way ANOVA F(2,7) = 9.714, p = 0.0096 and Tukey’s multiple comparisons. *p ≤ 0.05,**p ≤ 0.01. (F) Log-transformed relative gene expression in CD11cHI versus CD11cLo microglia from the same samples by qPCR. (±SEM; n = 5). Two-tailed paired t test *p ≤ 0.05, **p≤ 0.01, ***p ≤ 0.001. (G) Max projected confocal image of HCR wholemount P7 retina. Scale bar, 50 µm. Inset scale bar, 10 µm. (H) Percent CX3CR1-GFP+ cells expressing Apoe and Lyz2 by HCR (±SEM; n = 3 each). (I) Max projected confocal images of HCR at e12.5, e16.5, P0, P3, P7, P14, and P60. Scale bar, 50µm. (J) Heterogeneous expression by HCR of Clec7a (red), Spp1 (pink), Igf1 (white), and Tmem119 (pink) in Cx3cr1 expressing cells (green) at P7. Orange arrowheads and boxes indicate high expression and blue, low or no expression. Scale bar, 50 µm. Insets are individual channels without Cx3cr1; scale bar, 10 µm. (K) Percent of CX3CR1-GFP+ cells expressing each gene by HCR (±SEM; n ≥ 2). See also Figure S2 and Table S2.
Figure 3.
Figure 3.. Loss of Bax Reduces DAM-Related Gene Expression in Microglia
(A) Log-transformed relative gene expression by qPCR in sorted microglia from Bax KO relative to littermate WT controls. (±SEM; n = 4 KO except Lyz2 n = 2; n = 5 WT) Two-tailed unpaired t test *p ≤ 0.05, **p ≤ 0.01,***p ≤ 0.001. (B and C) Confocal images of HCR retinal wholemounts of P7 WT (left) BaxKO (right) for Lyz2, Apoe, and Cx3cr1 (B) or Itgax, Tmem119, and Cx3cr1 (C). Scale bar, 50 µm. (D) Percent of Cx3cr1+ cells expressing each gene by HCR (±SEM; n ≥ 2). Two-way ANOVA: interaction, F(3,13) = 122.4, p < 0.0001; gene F(3,13) = 190.2, p <0.0001; genotype F(1,13) = 215.5, p < 0.0001 and Sidak’s multiple comparison tests. ****p≤ 0.0001. WT data from Figures 2H, 2K, and S2D. (E) Percent (±SEM) of CD11cHIof total CD45+CD11b+microglia from P7 WT (n = 5) and Bax KO (n = 4). Unpaired t test t(7) = 5.415 ***p = 0.001. (F) Percent (±SEM) of CD11cHI of total CD45+GFP+(WT) or CD45+CD11b+ (KOs) microglia from P7 WT (n = 4), Apoe KO (n = 4), and P6/7 Trem2 KO (n = 6). Oneway ANOVA F(2,11) = 10.33 p = 0.003 and Tukey’s multiple comparisons *p≤ 0.05, +**p≤ 0.01. (G) Log-transformed relative gene expression by qPCR (±SEM) in sorted microglia from KOs relative to WT controls. Apoe KO (n = 3); Trem2 KO (n = 6 except n = 3 for Lyz2, Cd68, Lamp1, and P2ry12); WT (n ≥ 6 except n ≥ 3 Itgax, Lyz2, and Lpl). Two-tailed unpaired t test *p ≤ 0.05, **p ≤ 0.01. ND, not detectable. #, Welch’s correction. (H) (H and I) Max projected confocal images of HCR P7 retinal wholemounts from WT (left), Apoe KO (middle), and Trem2 KO (right) for Lyz2, Apoe, and Cx3cr1 (H) or Tmem119 (I). Tmem119 is pseudo-colored to reflect levels in (I). Scale bar, 50 µm. (J) Percent of Cx3cr1+ cells expressing each gene by HCR (±SEM; n ≥ 2). Two-way ANOVA: interaction, F(12,29) = 59.01, p < 0.0001; gene F(6,29) = 248.0, p < 0.0001; genotype F(2,29) = 67.96, p < 0.0001 and Tukey’s multiple comparison tests. ***p ≤ 0.001, ****p ≤ 0.0001. WT data from Figures 2H, 2K, and S2D.
Figure 4.
Figure 4.. CD11cHI Retinal Microglia Are More Resistant to Loss or Inhibition of CSF1R Signaling
(A) Tamoxifen dosing regimen. (B) Confocal images of retinal wholemounts of control at P9 (tamoxifen at P4, P6, and P8) (left) and homozygous floxed at P8 (tamoxifen at P4 and P6) (right). Scale bars, 100 µm. Experiment repeated twice, n = 4 animals each. (C) PLX3397 (PLX) dosing regimen. (D) Confocal images of retinal wholemounts at P7 from vehicle- (left) and PLX-treated (right) animals. Scale bar, 100 µm. (E) Representative flow cytometry plot and gate for collecting GFP+CD45+ microglia in vehicle- (left) and PLX-treated (right) animals. (F) Percent microglia (CD45+GFP+) of total single cells by flow cytometry. (±SEM; n = 8 each). Two-tailed unpaired t test t(14) = 4.438, ***p = 0.0006. (G) Percent CD11cHIof total CD45+GFP+ microglia by flow cytometry. (±SEM; n = 8 each) Two-tailed unpaired t test t(14) = 4.662, ***p = 0.0004. (H) Log-transformed relative gene expression by qPCR (±SEM) in sorted microglia from PLX-treated retinas relative to vehicle controls. WT (n≥8 except n = 5 Cd68, Lamp1, Lyz2, P2ry12); PLX (n = 9 except n = 8 for Itgax, n = 5 Cd68, Lamp1, Lyz2, P2ry12). Two-tailed unpaired t test *p ≤ 0.05, **p ɛ≤ 0.01, ***p ≤ 0.001. #, Welch’s correction. (I) HCR of vehicle- and PLX-treated retinas. Scale bars, 50µm. (J) Ratio (±SEM) of PLX-treated over genotyped-matched control density (CD45+Cd11b+/singlets). WT (n = 17); Trem2 KO (n = 6); Bax KO (n = 5). One-way BrownForsythe ANOVA F(2,24.29) = 11.76, p = 0.0003 and Games-Howell’s multiple comparisons test. *p ≤ 0.05, ***p ≤ 0.001. (K) Percent (±SEM) of CD11cHImicroglia in total CD45+CD11b=population after PLX by flow cytometry. WT littermates (n = 5), Trem2 KO (n = 7); Bax KO (n = 5). One-way ANOVA F(2,14) = 24.55, p < 0.0001 and Tukey’s multiple comparisons test ***p = 0.0005, ****p < 0.0001. See also Figures S3 and S4.

References

    1. Anderson SR, and Vetter ML (2019). Developmental roles of microglia: A window into mechanisms of disease. Dev. Dyn 248, 98–117. - PMC - PubMed
    1. Anderson SR, Zhang J, Steele MR, Romero CO, Kautzman AG, Schafer DP, and Vetter ML (2019). Complement targets newborn retinal ganglion cells for phagocytic elimination by microglia. J. Neurosci 39, 2025–2040. - PMC - PubMed
    1. Arandjelovic S, and Ravichandran KS (2015). Phagocytosis of apoptotic cells in homeostasis. Nat. Immunol 16, 907–917. - PMC - PubMed
    1. Askew K, and Gomez-Nicola D (2018). A story of birth and death: Insights into the formation and dynamics of the microglial population. Brain Behav. Immun 69, 9–917. - PubMed
    1. Ayata P, Badimon A, Strasburger HJ, Duff MK, Montgomery SE, Loh YE, Ebert A, Pimenova AA, Ramirez BR, Chan AT, et al. (2018). Epigenetic regulation of brain region-specific microglia clearance activity. Nat. Neurosci 21, 1049–1060. - PMC - PubMed

Publication types

Substances