. 2019 May 14;27(7):2063-2074.e5.
doi: 10.1016/j.celrep.2019.04.022.

Acetate Promotes T Cell Effector Function during Glucose Restriction

Affiliations

Acetate Promotes T Cell Effector Function during Glucose Restriction

Jing Qiu et al. Cell Rep. .

Abstract

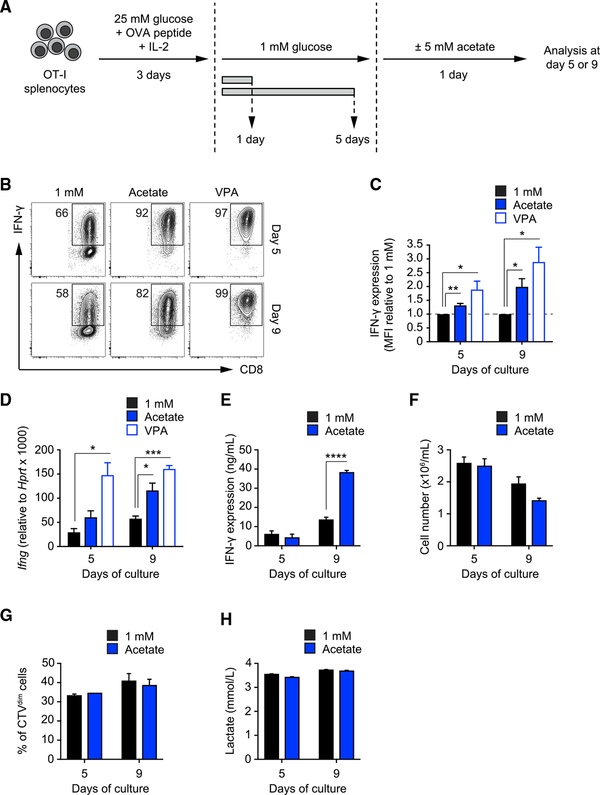
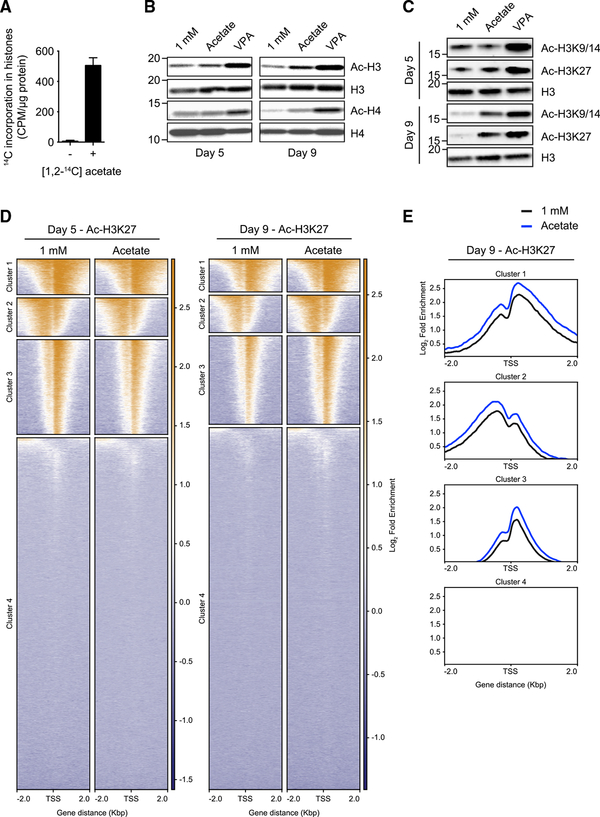
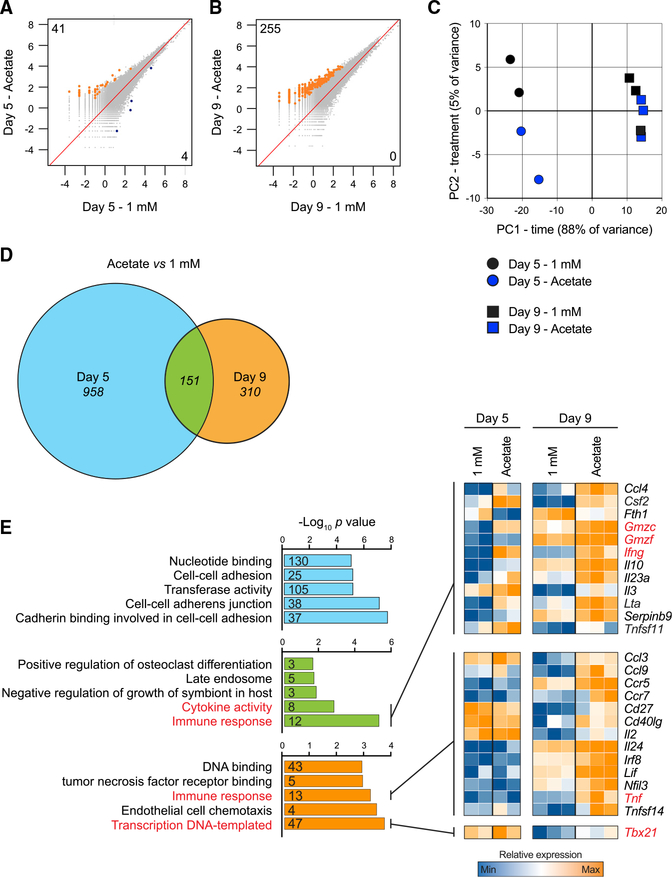
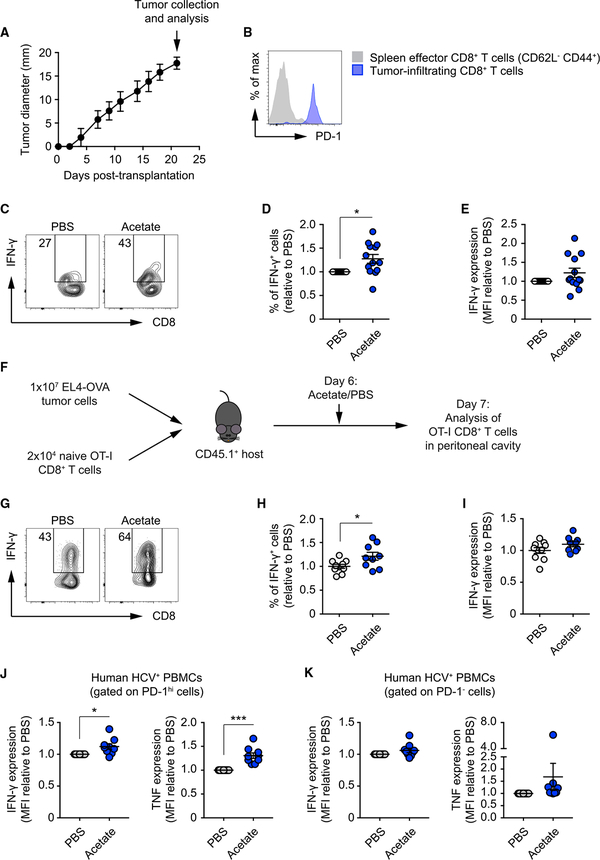
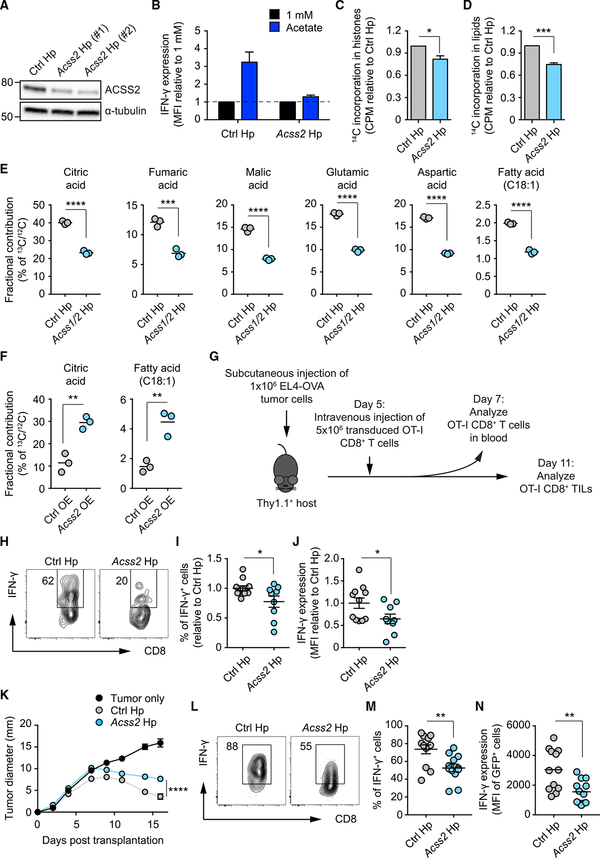
Competition for nutrients like glucose can metabolically restrict T cells and contribute to their hyporesponsiveness during cancer. Metabolic adaptation to the surrounding microenvironment is therefore key for maintaining appropriate cell function. For instance, cancer cells use acetate as a substrate alternative to glucose to fuel metabolism and growth. Here, we show that acetate rescues effector function in glucose-restricted CD8+ T cells. Mechanistically, acetate promotes histone acetylation and chromatin accessibility and enhances IFN-γ gene transcription and cytokine production in an acetyl-CoA synthetase (ACSS)-dependent manner. Ex vivo acetate treatment increases IFN-γ production by exhausted T cells, whereas reducing ACSS expression in T cells impairs IFN-γ production by tumor-infiltrating lymphocytes and tumor clearance. Thus, hyporesponsive T cells can be epigenetically remodeled and reactivated by acetate, suggesting that pathways regulating the use of substrates alternative to glucose could be therapeutically targeted to promote T cell function during cancer.

Keywords: T cell exhaustion; T cell hyporesponsiveness; T cells; acetate; acetyl-CoA synthetase; chromatin remodeling; effector functions; tumor immunity; tumor-infiltrating lymphocytes.


Conflict of interest statement

DECLARATION OF INTERESTS

E.J.P. is a founder of Rheos Medicines and E.L.P. is an SAB member of ImmunoMet and a founder of Rheos Medicines.

Figures

Figure 1.
Figure 1.. Supplemental Acetate Promotes IFN-γ Production in T Cells under Chronic Glucose Restriction
(A) In vitro culture system. Splenic naive OT-I CD8+ T cells were activated with SIINFEKL peptide and IL-2 and maintained for 3 days in medium containing 25 mM glucose. Then T cells were transferred to medium containing 1 mM glucose for an additional 1 or 5 days. 1 day prior to analysis, T cells were treated with or without 5 mM acetate. Analysis was performed on days 5 and 9. (B) FACS analysis of IFN-γ production by T cells cultured as described in (A). Numbers show percentages of IFN-γ+ cells. VPA, valproic acid. FACS plots are representative of n = 4 independent experiments. (C) Quantification of IFN-γ production as mean fluorescent intensity (MFI) of the CD8+ population. Values were normalized to the 1 mM condition. Mean ± SEM, Student’s t test, n = 4 independent experiments. (D) Real-time PCR of Ifng mRNA in cells cultured as described in (A). Values were normalized to Hprt. Mean ± SEM, Student’s t test, n = 3 independent experiments. (E) ELISA quantification of IFN-γ production by T cells cultured as described in (A) upon restimulation of 106 cells with PMA-ionomycin for 4 h. Mean ± SEM, Student’s t test, n = 3 independent experiments. (F) Number of live cells harvested after 24 h of culture under the indicated conditions after seeding 106 cells/mL. Mean ± SEM, n = 2 independent experiments. (G) Analysis of cell proliferation using CellTrace Violet dye. The graph shows the fraction of cells diluting the dye over 24 h of culture under the indicated conditions. Mean ± SEM, n = 2 independent experiments. (H) Quantification of lactate production as a measure of aerobic glycolysis in the medium of cells cultured for 24 h under the indicated conditions. Mean ± SEM, n = 2 independent experiments.
Figure 2.
Figure 2.. Acetate Is Incorporated into His-tones and Enhances Histone Acetylation in Glucose-Restricted T Cells
(A) Quantification of [1,2-14C] acetate-derived 14C incorporation in histones extracted from T cells cultured in 10 mM glucose medium. Mean ± SEM; n = 2 independent experiments. (B) Western blot analysis of global histone acetylation (acetylated histones H3 and H4) in T cells treated as described in Figure 1A. Data are representative of n = 2 independent experiments. (C) Western blot analysis of H3K9–14 and H3K27 acetylation in T cells treated as described in Figure 1A. Data are representative of n = 2 independent experiments. (D) Genome-wide chromatin immunoprecipitation sequencing (ChIP-seq) analysis of acetylation of H3K27 in T cells treated as described in Figure 1A. On the y axis, every line represents the acetylation profile of a specific gene. Genes were clustered according to the H3K27 acetylation profile pattern. Reported on the x axis is the distance from the transcription start site (TSS) of every gene. The bars on the side of each graph represent the fold enrichment, following a color scheme (orange, high enrichment; blue, low enrichment). n = 2 biological replicates. (E) Global representation of the data shown in (D) (day 9) as an enrichment profile. Culture conditions are reported in the color legend. On the y axis, the fold enrichment is shown. Reported on the x axis is the distance from the TSS.
Figure 3.
Figure 3.. Acetate Promotes Chromatin Accessibility in Glucose-Restricted T Cells
(A and B) ATAC-seq analysis of genome-wide chromatin accessibility in T cells cultured as described in Figure 1A. (A) shows comparisons on day 5 post-activation, whereas (B) shows comparisons on day 9 post-activation. Numbers indicate chromatin regions with significantly enhanced (orange, top left corner value) or significantly reduced (blue, bottom right corner value) accessibility. The term of comparison for each analysis is the 1 mM condition, either on day 5 (A) or on day 9 (B). n = 3 biological replicates. Values on the axis show log2 reads per million (RPM). (C) Principal-component analysis (PCA) of RNA-seq data obtained from cells cultured as in Figure 1A and restimulated with PMA-ionomycin for 4 h. n = 2–3 biological replicates. (D) Venn diagram showing the differentially expressed genes (DEGs) on day 5, on day 9, and at both time points in cells cultured in 1 mM glucose versus cells exposed to acetate 1 day prior to analysis. DEGs were filtered on adjusted p values lower than 0.1 and fold changes greater than 30%. n = 2–3 biological replicates. (E) Gene ontology analysis of the DEGs identified from comparison of cells cultured in 1 mM glucose versus cell exposed to acetate. The color-coding refers to (D). The heatmaps show a selection of genes belonging to the identified gene ontology terms. Gene ontology terms and genes of particular interest are highlighted in red. Numbers included in the bars indicate the number of DEGs belonging to each gene ontology term. The top 5 gene ontology terms are shown. Blue, low expression; orange, high expression.
Figure 4.
Figure 4.. Supplemental Acetate Increases IFN-γ Production by TILs
(A) Growth curve of B16 melanoma tumors subcutaneously implanted in C57BL/6 recipient mice. Data show the average of two perpendicular diameters ± range. 14 mice were monitored. (B) FACS analysis of PD-1 expression in splenic CD62LCD44+ CD8+ T effector cells and CD8+ tumor-infiltrating lymphocytes (TILs) isolated on day 21 post-tumor implant. Data are representative of 3 independent experiments. (C) FACS analysis of IFN-γ production by TILs isolated 21 days post-tumor implantation and treated overnight with either PBS or 5 mM acetate. Numbers show percentages of IFN-γ+ cells. FACS plots are representative of 3 independent experiments. (D and E) Quantification of percentages of IFN-γ+ cells (D) and MFI of IFN-γ staining (E) as in (C). Values are normalized to the PBS condition. Mean ± SEM, paired Student’s t test; data were pooled from 3 independent experiments. (F) 1×10⁶ EL4-OVA lymphoma cells were injected intraperitoneally, and 2×10⁴ naive OT-I CD8+ T cells were injected intravenously into CD45.1+ C57BL/6 recipient mice. 6 days later, mice received a single intraperitoneal bolus of 500 mg/kg acetate or PBS. Analysis was performed 1 day later. (G) FACS analysis of IFN-γ production by OT-I CD8+ T cells isolated from the peritoneal cavity of recipient mice. Numbers show percentages of IFN-γ+ cells. FACS plots are representative of 2 independent experiments. (H and I) Quantification of percentages of IFN-γ+ cells (H) and MFI of IFN-γ staining (I) as in (G). Values are normalized to the PBS condition. Mean ± SEM, Student’s t test; data were pooled from 2 independent experiments. (J and K) FACS analysis of IFN-γ (J) and TNF (K) production by PBMCs isolated from the blood of chronically infected HCV patients, treated overnight with either PBS or 5 mM acetate. Data show MFI of IFN-γ and TNF staining. Values are normalized to the PBS counterparts. Mean ± SEM, paired Student’s t test; data from 9 donors.
Figure 5.
Figure 5.. Cell-Intrinsic ACSS2 Expression Contributes to Optimal Effector T Cell Function and Anti-tumor Immunity In Vivo
(A) Western blot analysis of ACSS2 in T cells transduced with either control (Ctrl) luciferase shRNA or Acss2 shRNA. Data are representative of 2 independent experiments. (B) FACS analysis of IFN-γ MFI in T cells cultured in 1 mM glucose, transduced with Ctrl shRNA or Acss2 shRNA, and treated with or without acetate. Values were normalized to the 1 mM glucose condition. Mean ± SEM, n = 2 independent experiments. (C and D) Quantification of [1,2-14C] acetate-derived 14C incorporation in histones (C) and lipids (D) extracted from T cells cultured in 10 mM glucose medium. Values are normalized to Ctrl shRNA. Mean ± SEM, Student’s t test; n = 3 independent experiments. (E and F) Gas chromatography-mass spectrometry (GC-MS) analysis of 13C-acetate-derived 13C fractional contribution in metabolites extracted from T cells transduced with Ctrl shRNA or Acss1/2 shRNA (E), Ctrl empty vector (Ctrl overexpression [OE]), or Acss2 enforced expressor (Acss2-OE) (F). Mean, Student’s t test; n = 3 biological replicates. (G) 1 × 10⁶ EL4-OVA lymphoma cells were injected subcutaneously into Thy1.1+ C57BL/6 recipient mice. 5 days later, mice were intravenously administered 5 × 10⁶ OT-I CD8+ T cells transduced with Ctrl shRNA or Acss2 shRNA. Analysis of blood CD8+ T cells was performed 2 days later. (H) FACS analysis of IFN-γ production by OT-I CD8+ T cells isolated from the blood of recipient mice. Numbers show percentages of IFN-γ+ cells. FACS plots are representative of 2 independent experiments. (I and J) Quantification of percentage of IFN-γ+ cells (I) and MFI of IFN-γ staining (J) as in (H). Values are normalized to the Ctrl shRNA condition. Mean ± SEM, Student’s t test; data were pooled from 2 independent experiments. (K) Growth curve of EL4-OVA lymphoma tumors, subcutaneously implanted in Thy1.1+ C57BL/6 recipient mice, upon administration on day 5 post-implant of PBS or OT-I CD8+ T cells transduced with either Ctrl shRNA or Acss2 shRNA. Data show the average of two perpendicular diameters ± SEM; two-way ANOVA with Tukey’s multiple comparisons test; n = 4 mice/group, representative of 2 independent experiments. (L) FACS analysis of IFN-γ production by OT-I CD8+ TILs isolated from tumors of recipient mice. Numbers show percentages of IFN-γ+ cells of the shRNA-transduced GFP+ population. FACS plots are representative of 3 independent experiments. (M and N) Quantification of percentages of IFN-γ+ cells (M) and MFI of IFN-γ staining (N) as in (L). Mean ± SEM, Student’s t test; data from 3 experiments.

References

    1. Afgan E, Baker D, van den Beek M, Blankenberg D, Bouvier D, Cech M, Chilton J, Clements D, Coraor N, Eberhard C, et al. (2016). The Galaxy platform for accessible, reproducible and collaborative biomedical analyses: 2016 update. Nucleic Acids Res. 44 (W1), W3–W10. - PMC - PubMed
    1. Agarwal P, Raghavan A, Nandiwada SL, Curtsinger JM, Bohjanen PR, Mueller DL, and Mescher MF (2009). Gene regulation and chromatin remodeling by IL-12 and type I IFN in programming for CD8 T cell effector function and memory. J. Immunol 183, 1695–1704. - PMC - PubMed
    1. Allfrey VG, Faulkner R, and Mirsky AE (1964). Acetylation and Methylation of Histones and Their Possible Role in the Regulation of Rna Synthesis. Proc. Natl. Acad. Sci. USA 51, 786–794. - PMC - PubMed
    1. Araki Y, Fann M, Wersto R, and Weng NP (2008). Histone acetylation facilitates rapid and robust memory CD8 T cell response through differential expression of effector molecules (eomesodermin and its targets: perforin and granzyme B). J. Immunol 180, 8102–8108. - PMC - PubMed
    1. Arrigoni L, Al-Hasani H, Ramírez F, Panzeri I, Ryan DP, Santacruz D, Kress N, Pospisilik JA, Bönisch U, and Manke T (2018). RELACS nuclei barcoding enables high-throughput ChIP-seq. Commun. Biol 1, 214. - PMC - PubMed

Publication types