. 2019 May 14;11(5):1068.
doi: 10.3390/nu11051068.

Central Role of Cell Cycle Regulation in the Antitumoral Action of Ocoxin

Affiliations

Central Role of Cell Cycle Regulation in the Antitumoral Action of Ocoxin

Javier Pérez-Peña et al. Nutrients. .

Abstract

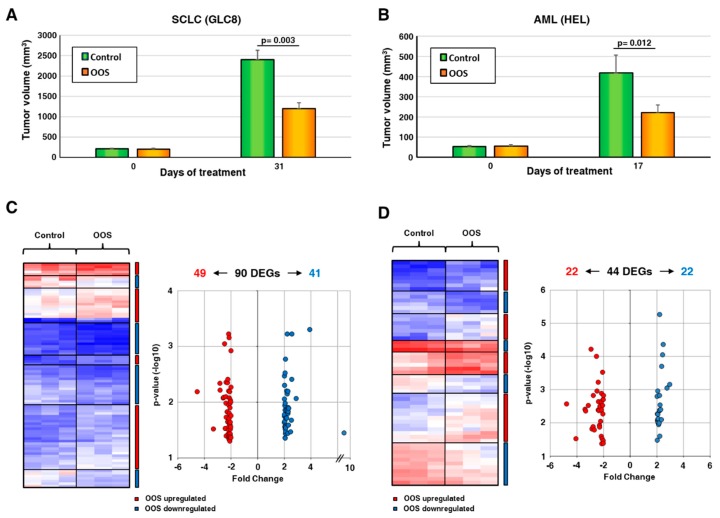
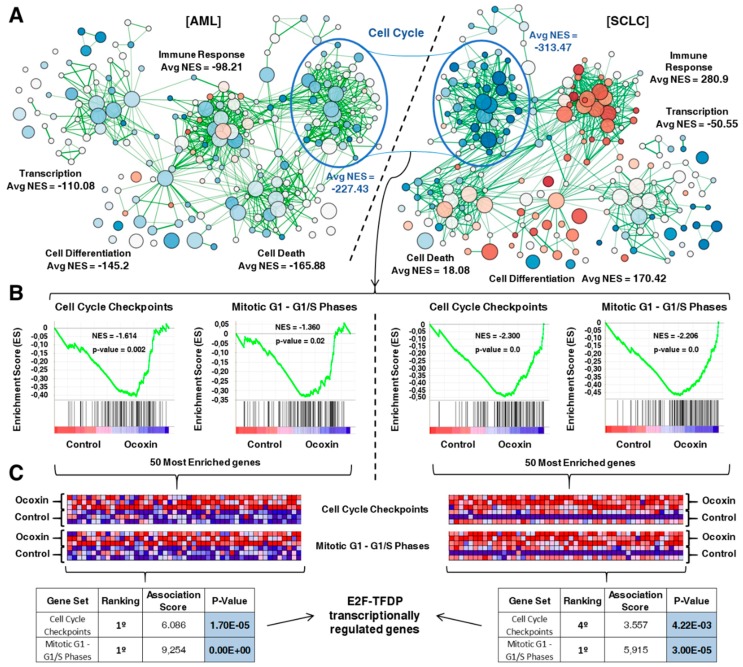
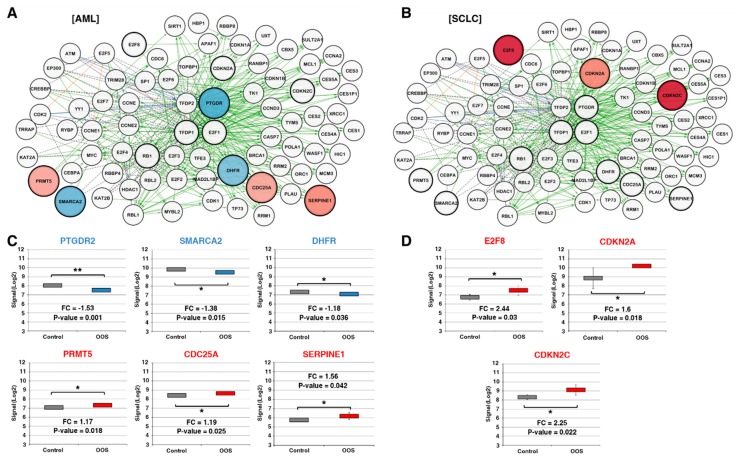
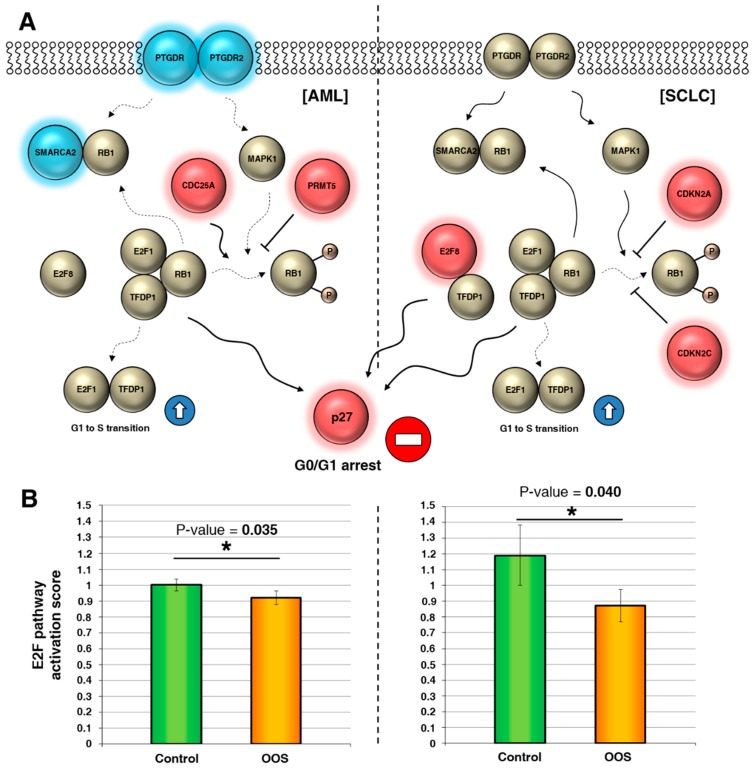
Nutritional supplements which include natural antitumoral compounds could represent safe and efficient additives for cancer patients. One such nutritional supplement, Ocoxin Oral solution (OOS), is a composite formulation that contains several antioxidants and exhibits antitumoral properties in several in vitro and in vivo tumor conditions. Here, we performed a functional genomic analysis to uncover the mechanism of the antitumoral action of OOS. Using in vivo models of acute myelogenous leukemia (AML, HEL cells, representative of a liquid tumor) and small-cell lung cancer (GLC-8, representative of a solid tumor), we showed that OOS treatment altered the transcriptome of xenografted tumors created by subcutaneously implanting these cells. Functional transcriptomic studies pointed to a cell cycle deregulation after OOS treatment. The main pathway responsible for this deregulation was the E2F-TFDP route, which was affected at different points. The alterations ultimately led to a decrease in pathway activation. Moreover, when OOS-deregulated genes in the AML context were analyzed in patient samples, a clear correlation with their levels and prognosis was observed. Together, these data led us to suggest that the antitumoral effect of OOS is due to blockade of cell cycle progression mainly caused by the action of OOS on the E2F-TFDP pathway.

Keywords: acute myeloid leukemia; antioxidants; apoptosis; cell cycle; p27; small-cell lung cancer.


Conflict of interest statement

E.S. is an employee of Catalysis S.L. The research expenses for this study were partially supported by Catalysis S.L. (Madrid, Spain).

Figures

Figure 1
Figure 1
Ocoxin Oral Solution (OOS) transcriptomic modulation. (A). In vivo effect of OOS on the growth of small-cell lung cancer (SCLC) tumor models. Animals were injected with GLC8 cells and, when the tumors were correctly engrafted and growing, were randomized into two groups that were daily treated with PBS (control, green) or OOS (orange). Tumor volumes at the end of the treatment were calculated. Data are represented as mean tumor volume ± SD, and statistical differences are indicated. (B) In vivo effect of OOS on tumor growth of acute myeloblastic leukemia (AML) models. Similarly, animals were injected with HEL cells, and tumor growth was followed after OOS daily treatment. (C) RNA from three different SCLC tumors for each condition was prepared and analyzed by Affymetrix arrays, as described. Differentially Expressed Genes (DEG) with a minimum of two-fold change differential expression and a maximum 0.05 p value after OOS treatment are shown. Overexpressed genes are displayed in shades of pink-red, and downregulated genes in shades of blue. (D) A similar approach was used to analyze AML-derived tumors.
Figure 2
Figure 2
Functional analysis of transcriptomic alterations caused by OOS. (A). Gene-set enrichment expression network designed using Cytoscape to compare control and OOS-treated cells in our two experimental models, AML (left) and SCLC (right). Several cellular functions were clearly deregulated by OOS. Cell Cycle had the highest average normalized enrichement score (Avg NES) in both tumor models. (B) Enrichment score (ES) profile and location of GeneSet members on the rank-ordered list of the two most deregulated cell cycle GeneSets (“Cell Cycle Checkpoints” and “Mitotic G1-G1/S Phases”) in the AML model (left panels). Both ES profiles behaved very similarly in the SCLC model (right panels). (C) Blue-pink diagram of the 50 most OOS-deregulated genes included in “Cell Cycle Checkpoints” and “Mitotic G1-G1/S Phases”. Overexpressed genes are displayed in shades of pink-red, and downregulated genes in shades of blue. PASTAA online tool results are displayed in the table. The highest association score for three of the four pools of genes analyzed correlated the expression of these genes to the E2F pathway.
Figure 3
Figure 3
Components of the E2F transcriptional network are deregulated after OOS treatment. (A). Cytoscape software representation of the E2F transcriptional network, composed of a total of 80 interactors in the AML model. Overexpressed genes are displayed in shades of pink-red, and downregulated genes in shades of blue; the color intensity is proportional to the fold-change values. Black dotted labels define “in complex with” interactions, green solid labels define “controls expression of” interactions, blue labels define “controls state change of” interactions, and orange labels “controls phosphorylation of” interactions. (B) Similarly, E2F transcription network is shown in SCLC. (C) Statistically significant deregulated E2F pathway genes in AML or in SCLC (D). Names in red indicate overexpression after OOS treatment, while those in blue are indicative of OOS downregulation. * indicate statistically significant differences.
Figure 4
Figure 4
OOS downregulates the E2F pathway. (A) Interactions among E2F pathway genes deregulated by OOS in AML (left) or SCLC (right), represented in a flow chart network. Overexpressed genes after OOS treatment are displayed in shades of pink-red, and downregulated genes in shades of blue. (B) OOS contributes significantly to block the activation of the E2F1–TFDP1 pathway mediated by its regulators in both tumor models. E2F pathway activation scores were estimated as described in the Material and Methods section. * indicate statistically significant differences.
Figure 5
Figure 5
E2F–TFDP route has prognostic relevance in AML patients. (A) Within OOS-deregulated genes, two of them (PTGDR and SMARCA2) had the highest expression in AML compared to other tumor types, while SERPINE1 had the second lowest expression (data from TCGA patients). (B) Prognostic relevance of the expression of PTGDR, SMARCA2, and SERPINE1 individually in AML patients. PTGDR expression is significantly related with worse relapse-free survival in AML patients. The green line corresponds to patients with low amounts of the corresponding protein, while the red line indicates higher levels. (C) The PTGDR/SERPINE1 expression ratio significantly correlates with worse relapse-free survival in AML patients. The combination of high expression of PTGDR and low expression of SERPINE1 is depicted in red, while the combination of low PTGDR expression and high SERPINE1 expression is shown in green. ** and *** indicate statistically significant differences.

References

    1. Fridlender M., Kapulnik Y., Koltai H. Plant derived substances with anti-cancer activity: From folklore to practice. Front Plant Sci. 2015;6:799. doi: 10.3389/fpls.2015.00799. - DOI - PMC - PubMed
    1. Greenwell M., Rahman P.K. Medicinal Plants: Their Use in Anticancer Treatment. Int. J. Pharm. Sci. Res. 2015;6:4103–4112. - PMC - PubMed
    1. Moudi M., Go R., Yien C.Y., Nazre M. Vinca alkaloids. Int. J. Prev. Med. 2013;4:1231–1235. - PMC - PubMed
    1. Mukhtar E., Adhami V.M., Mukhtar H. Targeting microtubules by natural agents for cancer therapy. Mol. Cancer Ther. 2014;13:275–284. doi: 10.1158/1535-7163.MCT-13-0791. - DOI - PMC - PubMed
    1. Slichenmyer W.J., Von Hoff D.D. New natural products in cancer chemotherapy. J. Clin. Pharmacol. 1990;30:770–788. doi: 10.1002/j.1552-4604.1990.tb01873.x. - DOI - PubMed

MeSH terms