. 2019 May 14;11(5):878.
doi: 10.3390/polym11050878.

Morphology on Reaction Mechanism Dependency for Twin Polymerization

Affiliations

Morphology on Reaction Mechanism Dependency for Twin Polymerization

Janett Prehl et al. Polymers (Basel). .

Abstract

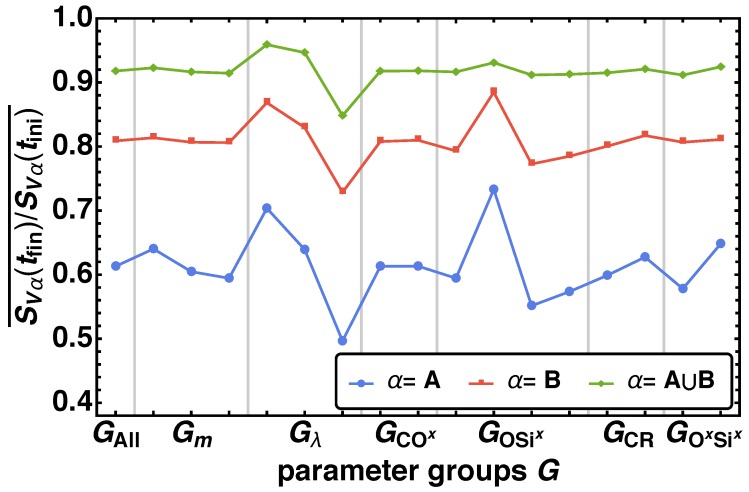
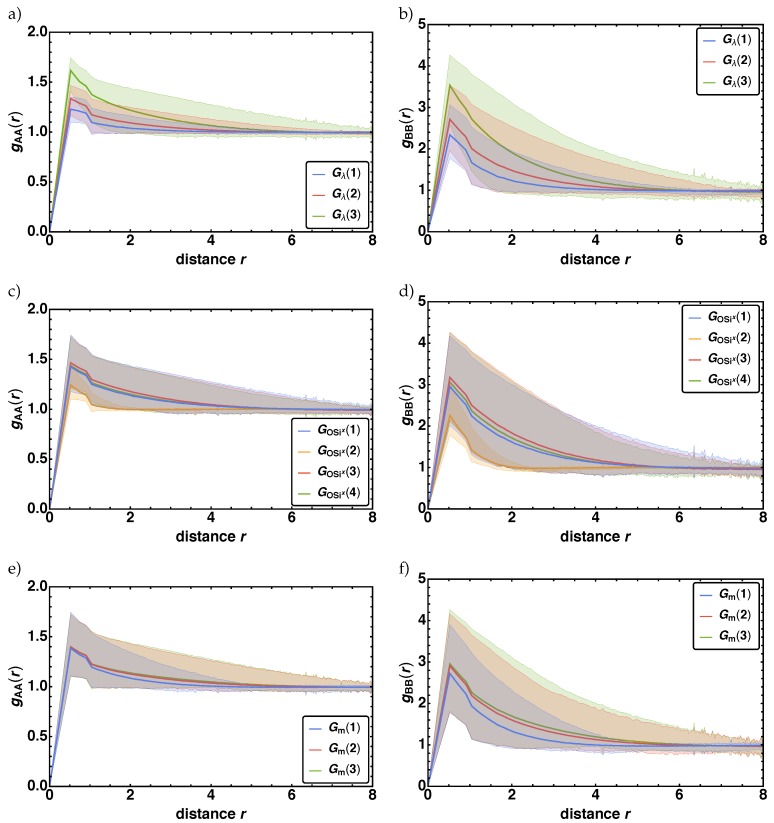
An in-depth knowledge of the structure formation process and the resulting dependency of the morphology on the reaction mechanism is a key requirement in order to design application-oriented materials. For twin polymerization, the basic idea of the reaction process is established, and important structural properties of the final nanoporous hybrid materials are known. However, the effects of changing the reaction mechanism parameters on the final morphology is still an open issue. In this work, the dependence of the morphology on the reaction mechanism is investigated based on a previously introduced lattice-based Monte Carlo method, the reactive bond fluctuation model. We analyze the effects of the model parameters, such as movability, attraction, or reaction probabilities on structural properties, like the specific surface area, the radial distribution function, the local porosity distribution, or the total fraction of percolating elements. From these examinations, we can identify key factors to adapt structural properties to fulfill desired requirements for possible applications. Hereby, we point out which implications theses parameter changes have on the underlying chemical structure.

Keywords: Monte Carlo method; percolation; porosity; radial distribution function; reactive bond fluctuation model; specific surface area; twin polymerization.


Conflict of interest statement

The authors declare no conflict of interest.

Figures

Figure 1
Figure 1
The chemical structure of the typical twin monomer 2,2-spiro[4H-1,3,2-benzodioxasiline] is shown in (a), and its reactive bond fluctuation (rBFM) representation in 2D in (b). It is represented by two bead types (A,B) and five different reaction centers (O,C,R,Ox,Six, with x={1,2}) as illustrated in (c,d). In (d) all possible states of the reaction centers and all possible bond vector types are given in an exemplary 2D-cutout of the cubic lattice. A corresponding 3D representation is given in Figure 2. Reaction centers with a solid square are bonded, with a dashed square are non-bonded and with darker filling are blocked. Note that to make it easier to differentiate between the reaction centers that are all placed in the center of the beads, here they are plotted next to each other.
Figure 2
Figure 2
Exemplary snapshots of a reduced 3D cubical lattice of reduced size 24×24×24 at (a) tini and (b) tfin for the parameter combination (I) (see Equation (9)) and two corresponding cutouts of size 6×6×6 (c): tini; (d): tfin) that are magnified to show the actual existing bond vectors. The colors are chosen in analogy to Figure 1. In (c) only twin monomer structures are observed (see Figure 1b). As over reaction time bonds may cleave and form, a final structure emerge as depict in (d), where a small organic (gray gray) and inorganic (red bonds) network emerge. Note that some initial bonds (green) may survive till the end. The origin of both sub cubes is at position {6,6,6} within the large 3D cubes. Note that to make it easier to differentiate between the bond vector types that are connected to the center of the beads, here they are plotted next to each other.
Figure 3
Figure 3
The acid catalyzed reaction scheme of the typical twin monomer 2,2-spiro[4H-1,3,2-benzodioxasiline] (1) is shown. 1twin polymerizes to a phenolic resin (2) and a silica network (3).
Figure 4
Figure 4
The time development of the bond fractions BFξ of all bond vector types ξ={COx, OSix, CR, SixOx} in (a,c) and of the non-bonded reaction centers ξ={C–, O–, R–, Ox–, Six–} in (b,d) are given for the two exemplary parameter combinations (I) and (II) (ad). Note that in (d) the curve for ξ=C– is plotted thicker, as it falls on top of the curve for R– and Ox–.
Figure 5
Figure 5
Distributions of the bond fractions BFξ at tfin for the non-bonded reactions centers ξ={O–, Six–} in (ad), and the bond vector type ξ=OSix in (e,f) for the two parameter combinations GOSix (left column) and Gλ (right column).
Figure 6
Figure 6
Averaged bond fractions BFξ¯ at tfin for all non-bonded reaction center ξ={O–, C–, R–, Ox–, Six–} and bond vector types ξ={COx, CR, OSix, SixOx} over the parameter groups G(i) specified in Table 3.
Figure 7
Figure 7
Averaged mean nearest-neighbor contacts n^αβ(tfin)/n^αβ(tini)¯ for all parameter groups G(i) for the bead type combinations αβ={AA, AB, BB}.
Figure 8
Figure 8
The averaged relative specific surface area SVα(tfin)/SVα(tini)¯ is given for the parameter groups G(i) (see Table 3).
Figure 9
Figure 9
The arithmetic mean, i.e., averaged (thick colored line), the minimum (lowest thin colored line) and the maximum (highest thin colored line) radial distribution function gβα(r) over radial distance r are given for ba = fAA, BBg in (a,c,e) and (b,d,f) and for the parameter groups Gλ,GOSix, and Gm in (a,b), (c,d), and (e,f). Each subgroup i is highlighted with a different color.
Figure 10
Figure 10
The local porosity distributions μα(Φα,K) for K={8,12,24} and α={A, B, A∪B} are given over the local porosity Φα for the two parameter combinations (I) and (II). In (a,b) the initial and in (c,d) the final distributions are shown.
Figure 11
Figure 11
In a) the averaged mean values of the local porosity distribution μα(Φα,K)¯ and in b) the averaged variances (μα(Φα,K)μα(Φα,K))2¯ for different lengths K={4,6,8,12} of the measurement cells for α={A, B, A∪B} are shown over the parameter groups G(i). Note that for K>12 all variances are 0 and thus are not shown here.
Figure 12
Figure 12
The averaged total fraction of percolating measurement cells θα,d(K) with θα,d(K)0 and 1 are given over the parameter groups G(i) (see Table 3). The results are shown in (a) for α=A∪B, K=6, and d={x,y,z,3,c}, whereas in (b) for α={A, B} and d=0.

References

    1. Higgins B.A., Brittain W.J. Polycarbonate carbon nanofiber composites. Eur. Polym. J. 2005;41:889–893. doi: 10.1016/j.eurpolymj.2004.11.040. - DOI
    1. Chemtob A., Belon C., Croutxé-Barghorn C., Rigolet S., Vidal L., Brendlé J., Mandle J., Blanchard N. Tandem Cationic and Sol–Gel Photopolymerizations of a Vinyl Ether Alkoxysilane. Polym. Eng. Sci. 2011;51:1466–1475. doi: 10.1002/pen.21951. - DOI
    1. Ni L., Moreau N., Chemtob A., Croutxé-Barghorn C. Organic–inorganic tandem route to polymer nanocomposites: kinetic products versus thermodynamic products. J. Sol-Gel Sci. Technol. 2012;64:500–509. doi: 10.1007/s10971-012-2882-8. - DOI
    1. Rodrígez-Tobías H., Morales G., Rodríguez-Fernández O., Acuña P. Mechanical and UV-Shielding Properties of In Situ Synthesized Poly(acrylonitrile-butadiene-styrene)/Zinc Oxide Nanocomposites. J. Appl. Polym. Sci. 2013;127:4708–4718. doi: 10.1002/app.38092. - DOI
    1. Wang Y., Jabarin S.A. Novel preparation method for enhancing nanoparticle dispersion and barrier properties of poly(ethylene terephthalate) and poly(m-xylylene adipamide) J. Appl. Polym. Sci. 2013;129:1455–1465. doi: 10.1002/app.38853. - DOI