

The utility of multivariate outlier detection techniques for data quality evaluation in large studies: an application within the ONDRI project
- PMID: 31092212
- PMCID: PMC6521365
- DOI: 10.1186/s12874-019-0737-5
The utility of multivariate outlier detection techniques for data quality evaluation in large studies: an application within the ONDRI project
Abstract
Background: Large and complex studies are now routine, and quality assurance and quality control (QC) procedures ensure reliable results and conclusions. Standard procedures may comprise manual verification and double entry, but these labour-intensive methods often leave errors undetected. Outlier detection uses a data-driven approach to identify patterns exhibited by the majority of the data and highlights data points that deviate from these patterns. Univariate methods consider each variable independently, so observations that appear odd only when two or more variables are considered simultaneously remain undetected. We propose a data quality evaluation process that emphasizes the use of multivariate outlier detection for identifying errors, and show that univariate approaches alone are insufficient. Further, we establish an iterative process that uses multiple multivariate approaches, communication between teams, and visualization for other large-scale projects to follow.
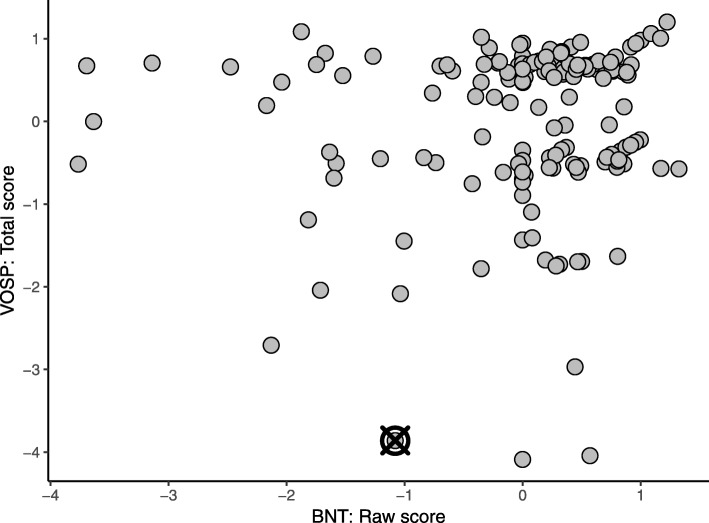
Methods: We illustrate this process with preliminary neuropsychology and gait data for the vascular cognitive impairment cohort from the Ontario Neurodegenerative Disease Research Initiative, a multi-cohort observational study that aims to characterize biomarkers within and between five neurodegenerative diseases. Each dataset was evaluated four times: with and without covariate adjustment using two validated multivariate methods - Minimum Covariance Determinant (MCD) and Candès' Robust Principal Component Analysis (RPCA) - and results were assessed in relation to two univariate methods. Outlying participants identified by multiple multivariate analyses were compiled and communicated to the data teams for verification.
Results: Of 161 and 148 participants in the neuropsychology and gait data, 44 and 43 were flagged by one or both multivariate methods and errors were identified for 8 and 5 participants, respectively. MCD identified all participants with errors, while RPCA identified 6/8 and 3/5 for the neuropsychology and gait data, respectively. Both outperformed univariate approaches. Adjusting for covariates had a minor effect on the participants identified as outliers, though did affect error detection.
Conclusions: Manual QC procedures are insufficient for large studies as many errors remain undetected. In these data, the MCD outperforms the RPCA for identifying errors, and both are more successful than univariate approaches. Therefore, data-driven multivariate outlier techniques are essential tools for QC as data become more complex.
Keywords: Minimum covariance determinant; Multivariate outliers; Principal component analysis; Quality control; Visualization.
Conflict of interest statement
Ethics approval and consent to participate
The Ontario Neurodegenerative Disease Research Initiative has been reviewed and approved by the Baycrest Research Ethics Board. The Baycrest Research Ethics Board operates in compliance with the Tri-Council Policy Statement, ICH/GCP Guidelines and Part C, Division 5 of the Food and Drug Regulations of Health Canada. All ONDRI participants provided written and informed consent.
Consent for publication
Not applicable.
Competing interests
SS is the Chief Scientific Officer of ADMdx, a medical diagnostics company specializing in neuroimaging of neurodegenerative disorders.
Publisher’s Note
Springer Nature remains neutral with regard to jurisdictional claims in published maps and institutional affiliations.
Figures


References
-
- Barchard KA, Verenikina Y. Improving data accuracy: selecting the best data checking technique. Comput Hum Behav. 2013;29:1917–1922. doi: 10.1016/j.chb.2013.02.021. - DOI
-
- Rahbar MH, Wyatt G, Sikorskii A, Victorson D, Ardjomand-Hessabi M. Coordination and Management of Multisite Complementary and Alternative Medicine (CAM) therapies: experience from a multisite reflexology intervention trial. Contemp Clin Trials. 2011;32:620–629. doi: 10.1016/j.cct.2011.05.015. - DOI - PMC - PubMed
Publication types
MeSH terms
Grants and funding
LinkOut - more resources
Full Text Sources
Medical
