

Diagnostic accuracy of capnovolumetry for the identification of airway obstruction - results of a diagnostic study in ambulatory care
- PMID: 31092254
- PMCID: PMC6521502
- DOI: 10.1186/s12931-019-1067-1
Diagnostic accuracy of capnovolumetry for the identification of airway obstruction - results of a diagnostic study in ambulatory care
Abstract
Background: One of the known weaknesses of spirometry is its dependence on patients' cooperation, which can only partially be alleviated by educational efforts. Therefore, procedures less dependent on cooperation might be of value in clinical practice. We investigated the diagnostic accuracy of ultrasound-based capnovolumetry for the identification of airway obstruction.
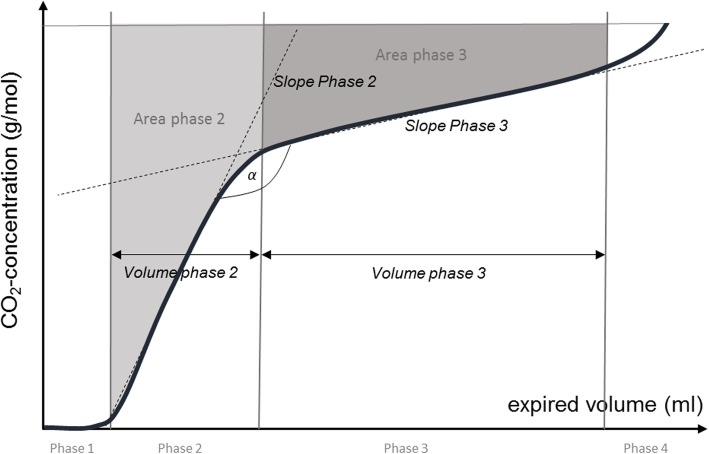
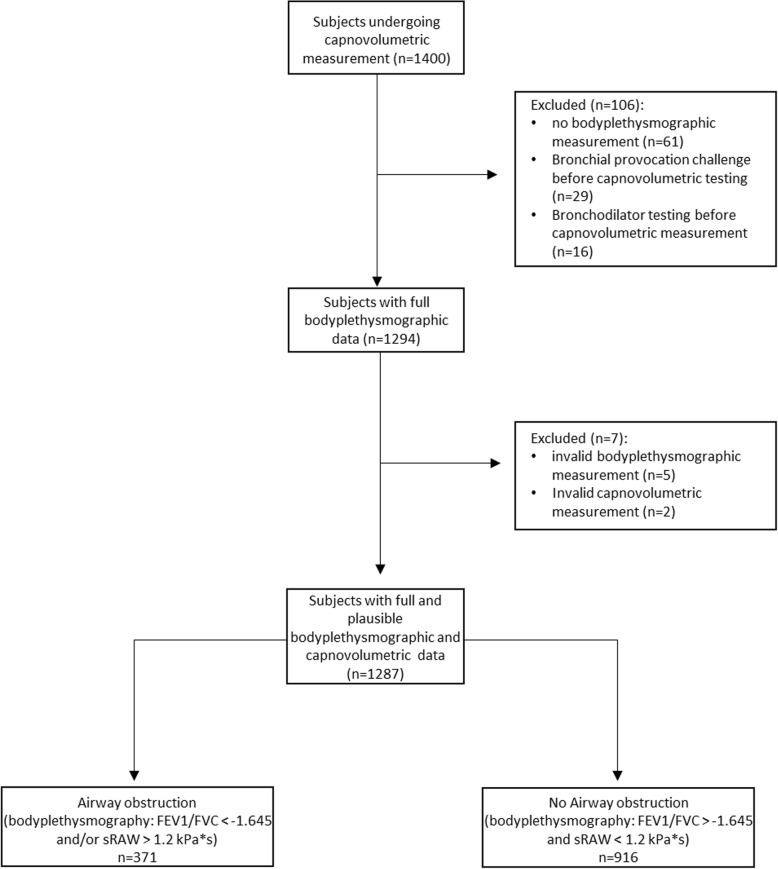
Methods: Consecutive patients from a pulmonary outpatient clinic were included in the diagnostic study. As reference standard, the presence of airway obstruction was evaluated via spirometry and bodyplethysmography. Capnovolumetry was performed as index test with an ultrasound spirometer providing a surrogate measure of exhaled carbon dioxide. Receiver operating characteristic (ROC) analysis was performed using the ratio of slopes of expiratory phases 3 and 2 (s3/s2) ≥ 0.10 as primary capnovolumetric parameter for the recognition of airway obstruction. Logistic regression was performed as secondary analysis to identify further useful capnovolumetric parameters. The diagnostic potential of capnovolumetry to identify more severe degrees of airway obstruction was evaluated additionally.
Results: Of 1400 patients recruited, 1287 patients were included into the analysis. Airway obstruction was present in 29% of patients. The area under the ROC-curve (AUC) of s3/s2 was 0.678 (95% CI 0.645, 0.710); sensitivity of s3/s2 ≥ 0.10 was 47.7 (95% CI 42.7, 52.8)%, specificity 79.0 (95% CI 76.3, 81.6)%. When combining this parameter with three other parameters derived from regression analysis (ratio area/volume phase 3, slope phase 3, volume phase 2), an AUC of 0.772 (95% CI 0.743, 0.801) was obtained. For severe airway obstruction (FEV1 ≤ 50% predicted) sensitivity of s3/s2 ≥ 0.10 was 75.9 (95% CI 67.1, 83.0)%, specificity 75.8 (95% CI 73.3, 78.1)%; for very severe airway obstruction (FEV1 ≤ 30% predicted) sensitivity was 86.7 (95% CI 70.3, 94.7)%, specificity 72.8 (95% CI 70.3, 75.2)%. Sensitivities increased and specificities decreased considerably when the combined capnovolumetric score was used as index test.
Conclusions: Capnovolumetry by way of an ultrasound spirometer had a statistically significant albeit moderate potential for the recognition of airway obstruction in a heterogeneous population of patients typically found in clinical practice. Diagnostic accuracy of the capnovolumetric device increased with the severity of airway obstruction.
Trial registration: The study is registered under DRKS00013935 at German Clinical Trials Register (DRKS).
Keywords: Airway obstruction; Area under the curve (AUC); Asthma; COPD; Capnovolumetry; Diagnostic study; ROC analysis; Sensitivity; Specificity.
Conflict of interest statement
Ethics approval and consent to participate
The study was approved by the Ethical Committee of the Technical University of Munich (TUM). The study protocol was registered in the German Clinical Trials Register (DRKS00013935).
Consent for publication
Not applicable.
Competing interests
The Institute of General Practice and Health Services Research (Munich, Germany) received a grant from Ganshorn Medizin Electronic GmbH during the conduct of the study.
Publisher’s Note
Springer Nature remains neutral with regard to jurisdictional claims in published maps and institutional affiliations.
Figures

References
MeSH terms
LinkOut - more resources
Full Text Sources
Medical
Research Materials
