. 2019 May 15;8(6):35.
doi: 10.1038/s41389-019-0141-3.

Transcriptional and functional consequences of TP53 splice mutations in colorectal cancer

Affiliations

Transcriptional and functional consequences of TP53 splice mutations in colorectal cancer

Jørgen Smeby et al. Oncogenesis. .

Abstract

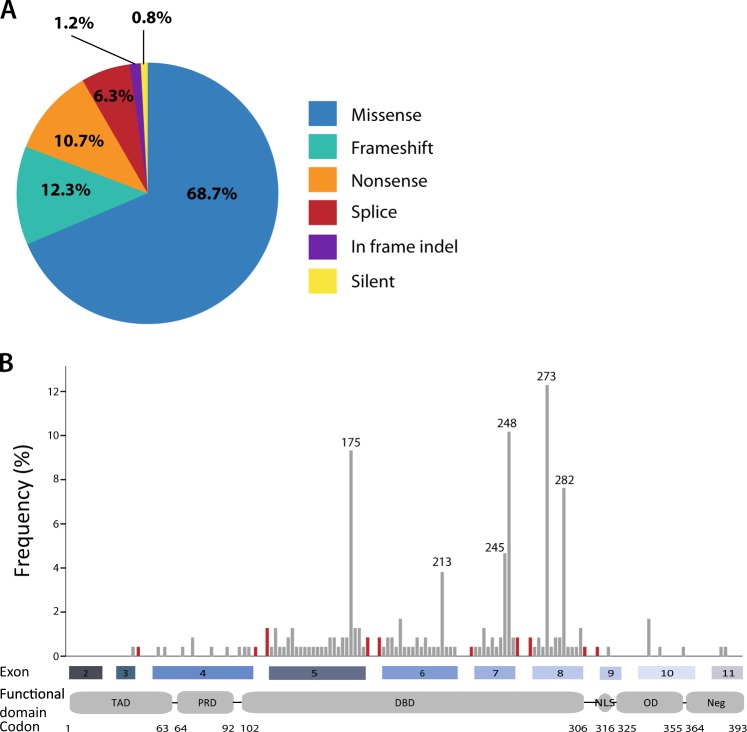
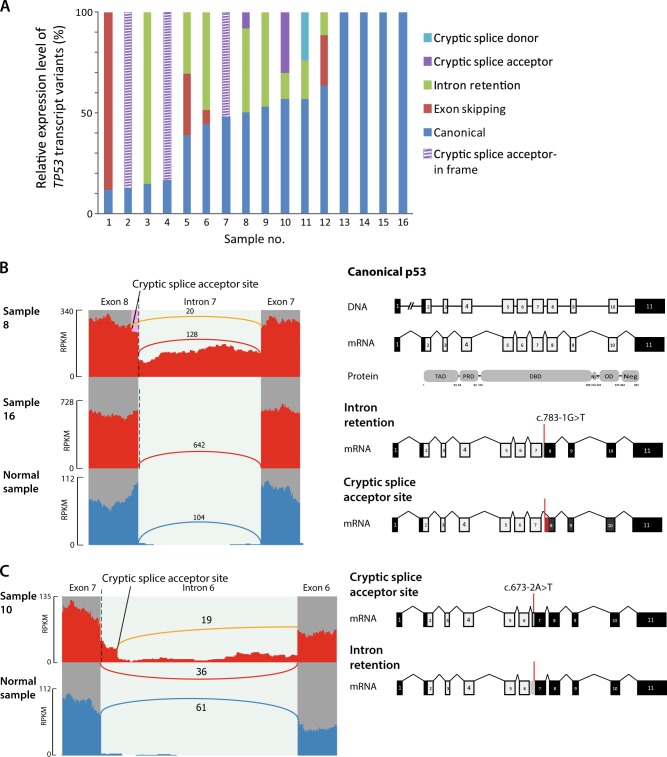
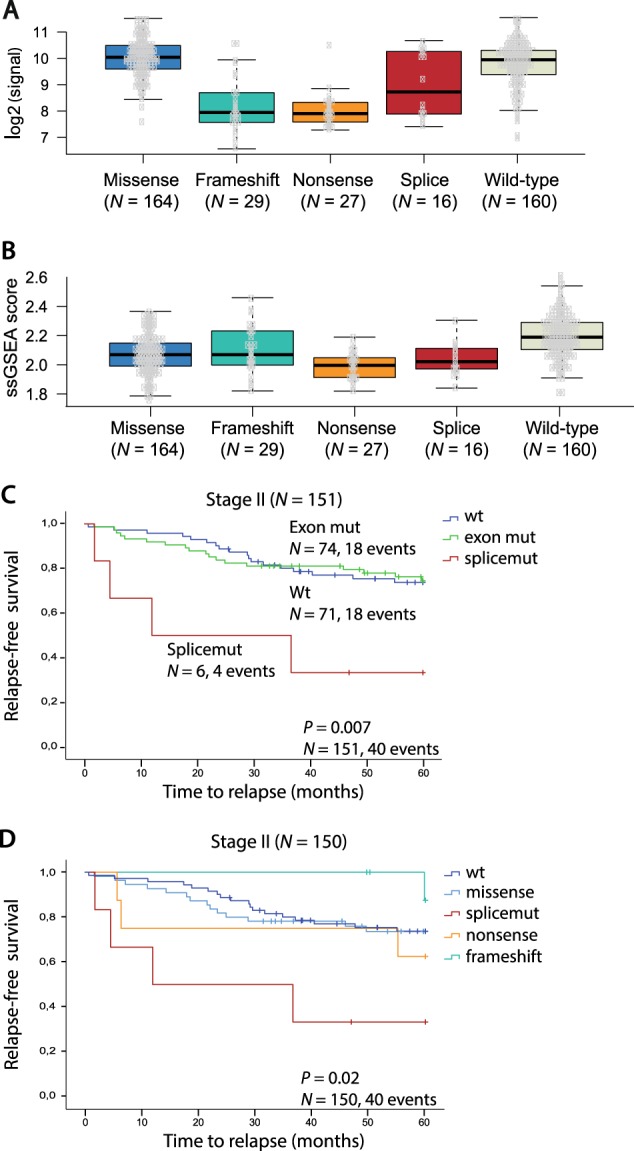
TP53 mutations are common in colorectal cancer (CRC). Most TP53 sequencing studies have been restricted to coding regions, but recent studies have revealed that splice mutations can generate transcript variants with distinct tumorigenic and prognostic properties. Here, we performed unrestricted sequencing of all coding sequences and splice regions of TP53 in a single-hospital series of 401 primary CRCs. TP53 splice mutations were detected in 4% of the cases (N = 16), considerably more frequent than reported in major databases, and they were mutually exclusive to exon mutations. RNA sequencing revealed high-level expression of aberrant transcript variants in the majority of splice mutated tumors (75%). Most variants were predicted to produce truncated TP53 proteins, including one sample expressing the potentially oncogenic and druggable p53ψ isoform. Despite heterogeneous transcript structures, downstream transcriptional profiling revealed that TP53 splice mutations had similar effects on TP53 target gene expression and pathway activity as exonic mutations. Intriguingly, TP53 splice mutations were associated with worse 5-year relapse-free survival in stage II disease, compared to both TP53 wild-type and exon mutations (P = 0.007). These data highlight the importance of including splice regions when examining the biological and clinical consequences of TP53 mutations in CRC.


Conflict of interest statement

The authors declare that they have no conflict of interest.

Figures

Fig. 1
Fig. 1. TP53 mutation spectrum in primary colorectal cancers.
a Proportion of TP53 mutation types, plotted as the percentage of the total number of detected mutations (N = 252). b Frequency and distribution of TP53 splice (red) and exon (gray) mutations at each position along the gene (codon number is indicated below). The frequency is calculated relative to all mutations included in this plot (N = 236; exon mutations encompassing multiple codons, i.e. indels, are excluded). Frequency of splice mutations represents all mutations affecting the relevant splice region; see Table 1 for details. TAD transactivation domain, PRD proline-rich domain, DBD DNA-binding domain, NLS nuclear localization domain, OD oligomerization domain, Neg negative-regulation domain
Fig. 2
Fig. 2. Transcript variants in TP53 splice mutated colorectal cancers.
a Estimated relative expression levels of TP53 transcript variants in 16 splice mutated samples. Samples are ordered according to the relative expression level of the canonical splicing variant. Canonical splicing, cryptic splice sites and exon skipping events were quantified in the Sashimi plots, while intron retention values are the median depth of the relevant intronic region as measured by IRFinder. b Sashimi plots from two tumor samples with point mutation in the canonical splice acceptor site of intron 7 (marked with a dashed line) compared with a normal sample. Reads spanning exon junctions are represented by arcs, and each arc is labeled with the number of supporting reads. The arc representing an aberrant splicing event is colored in orange. Heights of bars reflect the read depth at each genomic position (reading frame right to left). Schematic visualization of the canonical TP53 transcript variant is shown in the top panel, and the two aberrant variants caused by the splice site mutation below, with coding sequences in light gray and noncoding sequences in black. In sample 8, 20 junction reads span transcripts using a cryptic acceptor site located 24 basepairs into exon 8, while 106 reads retain intron 7 (median depth of intron 7 as measured by IRFinder). Contrastingly, in both sample 16 and the normal sample all junction reads between exon 7 and exon 8 span the canonical splice sites. The transcript variant retaining intron 7 is predicted to generate a premature stop codon. The usage of an alternative splice acceptor site will lead to loss of nine amino acids in the 5′ part of exon 8 followed by disturbed reading frame but no generation of a premature stop codon. c Sashimi plot visualizing aberrant splicing variants in a sample with a TP53 mutation in the splice acceptor site of intron 6 compared with a nonmatched normal colonic mucosa sample. The transcript variant using a cryptic splice acceptor site located 49 basepairs upstream of the canonical splice site is identical with the p53ψ isoform, which is truncated due to the introduction of a premature stop codon. The aberrant transcript due to intron retention contains a premature stop codon in intron 6. Sashimi plots for the remaining samples with TP53 splice mutations are shown in Supplementary Fig. 1
Fig. 3
Fig. 3. Transcriptional consequences and prognostic associations of TP53 splice mutations.
a TP53 gene expression levels according to mutation type. Due to small sample sizes, in frame indels and silent mutations were not included. b TP53 signature score according to mutation type. Due to small sample sizes, in frame indels and silent mutations were not included. ssGSEA single-sample gene set enrichment analysis. c Kaplan−Meier survival curve showing 5-year relapse-free survival (RFS) for patients with TP53 wt, exon mutations and splice mutations in CRC stage II. d 5-year RFS according to TP53 mutation type in CRC stage II. Due to small sample size, in frame indels and silent mutations (N= 1) were not included

References

    1. Fearon ER, Vogelstein B. A genetic model for colorectal tumorigenesis. Cell. 1990;61:759–767. doi: 10.1016/0092-8674(90)90186-I. - DOI - PubMed
    1. Lothe RA, et al. Molecular genetic studies of tumor suppressor gene regions on chromosomes 13 and 17 in colorectal tumors. J. Natl. Cancer Inst. 1992;84:1100–1108. doi: 10.1093/jnci/84.14.1100. - DOI - PubMed
    1. TCGA. Comprehensive molecular characterization of human colon and rectal cancer. Nature. 2012;487:330–337. doi: 10.1038/nature11252. - DOI - PMC - PubMed
    1. Bouaoun L, et al. TP53 variations in human cancers: new lessons from the IARC TP53 database and genomics data. Hum. Mutat. 2016;37:865–876. doi: 10.1002/humu.23035. - DOI - PubMed
    1. Leroy B, Anderson M, Soussi T. TP53 mutations in human cancer: database reassessment and prospects for the next decade. Hum. Mutat. 2014;35:672–688. doi: 10.1002/humu.22552. - DOI - PubMed