. 2019 May 15;10(1):2168.
doi: 10.1038/s41467-019-10175-3.

Biomimetic electromechanical stimulation to maintain adult myocardial slices in vitro

Affiliations

Biomimetic electromechanical stimulation to maintain adult myocardial slices in vitro

Samuel A Watson et al. Nat Commun. .

Abstract

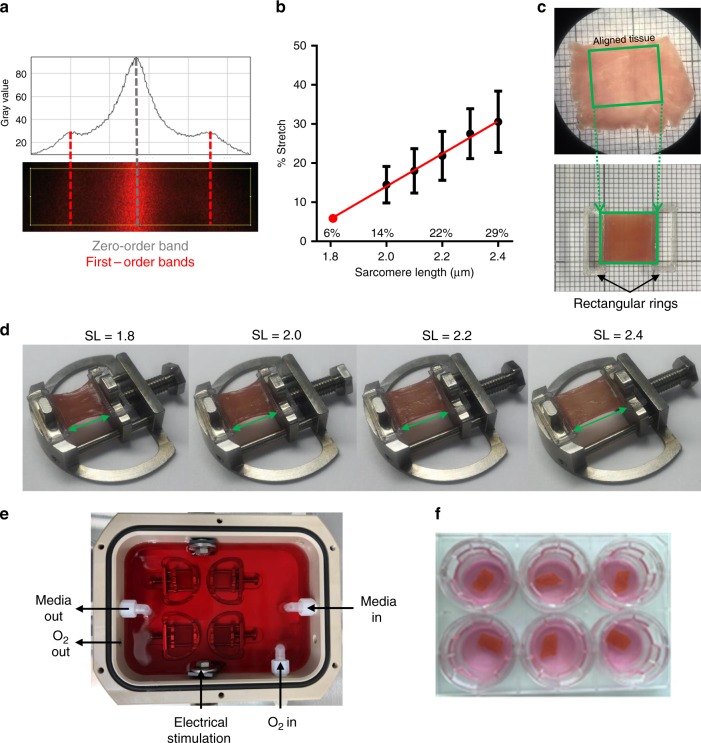
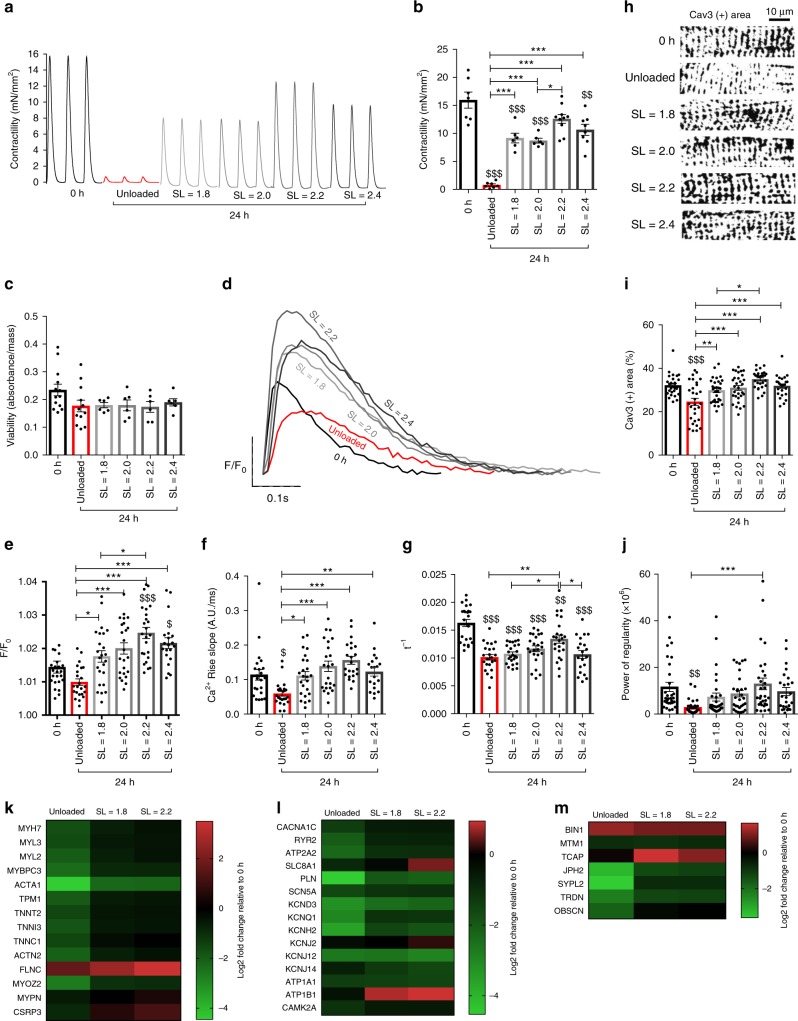
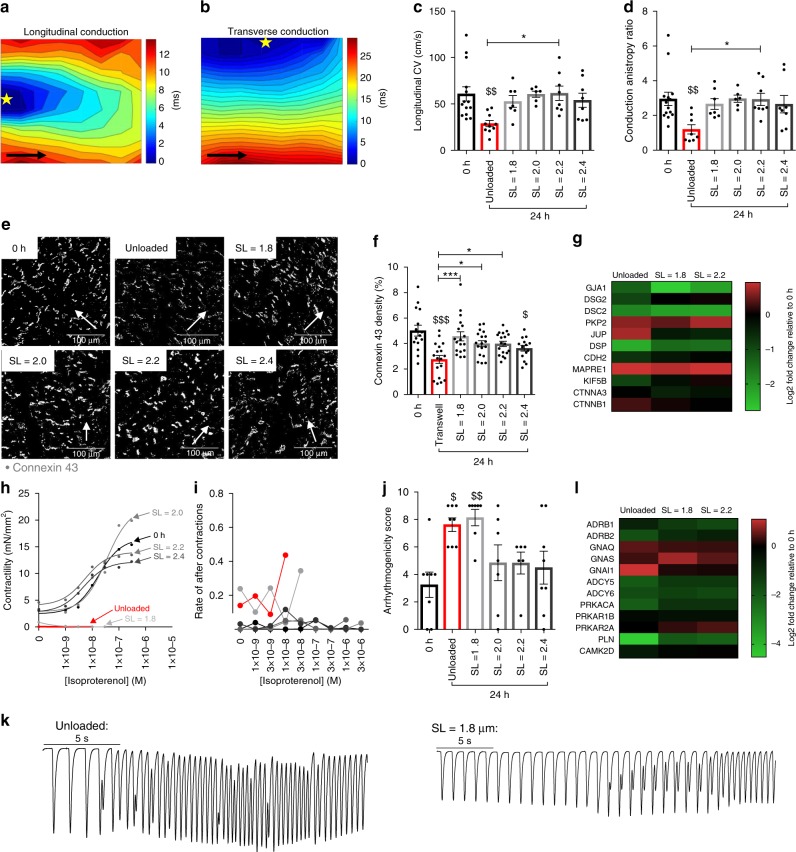
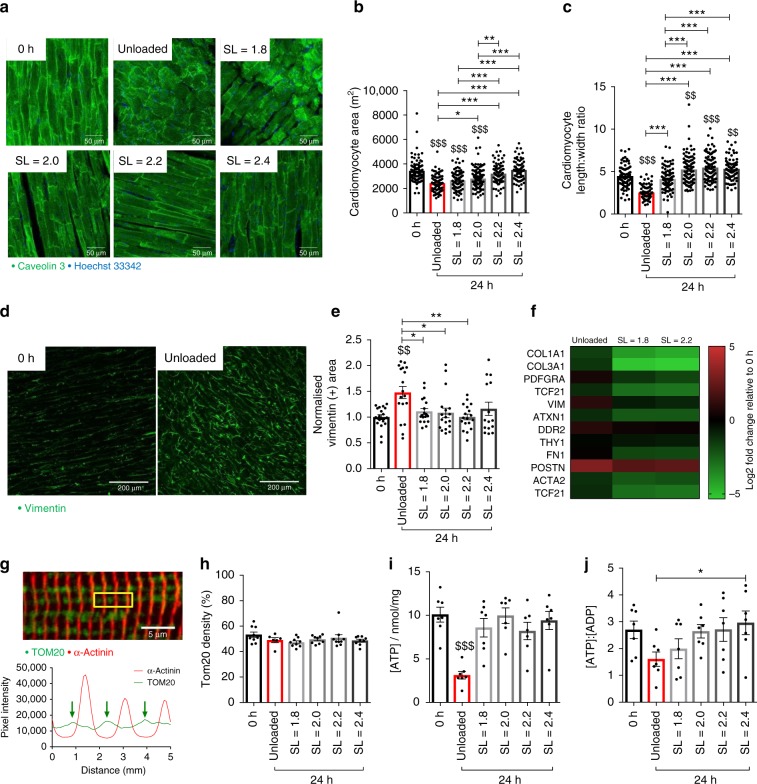
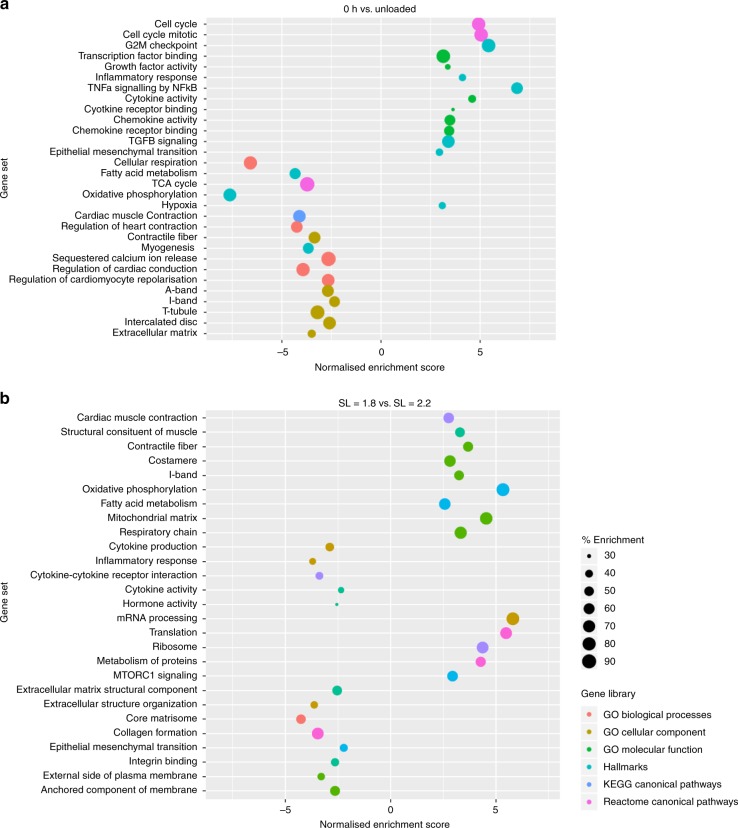
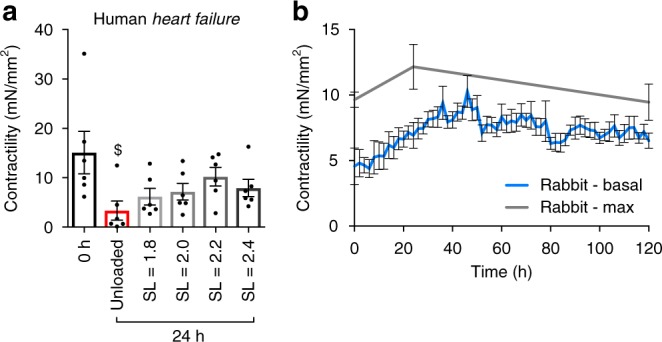
Adult cardiac tissue undergoes a rapid process of dedifferentiation when cultured outside the body. The in vivo environment, particularly constant electromechanical stimulation, is fundamental to the regulation of cardiac structure and function. We investigated the role of electromechanical stimulation in preventing culture-induced dedifferentiation of adult cardiac tissue using rat, rabbit and human heart failure myocardial slices. Here we report that the application of a preload equivalent to sarcomere length (SL) = 2.2 μm is optimal for the maintenance of rat myocardial slice structural, functional and transcriptional properties at 24 h. Gene sets associated with the preservation of structure and function are activated, while gene sets involved in dedifferentiation are suppressed. The maximum contractility of human heart failure myocardial slices at 24 h is also optimally maintained at SL = 2.2 μm. Rabbit myocardial slices cultured at SL = 2.2 μm remain stable for 5 days. This approach substantially prolongs the culture of adult cardiac tissue in vitro.


Conflict of interest statement

The authors declare no competing interests.

Figures

Fig. 1
Fig. 1
Application of electromechanical stimulation to rat myocardial slices. a Assessment of laser diffraction pattern. Peaks correspond to diffraction bands—the bright, central band corresponds to a zero-order band (grey), while the smaller bands on the left and right correspond to the less intense first-order bands (red). The distance between the zero-order and first-order band can be measured and used to calculate sarcomere length. b Percentage stretch required to set the average diastolic rat myocardial slice sarcomere length. Rat myocardial slices were progressively stretched until a diffraction pattern equivalent to SL = 2.0 μm was achieved. The % stretch was then measured using calipers. This was repeated at 0.1-μm intervals until SL = 2.4 μm. A linear regression was used to estimate SL (r2 = 0.4776, y = 41.67 × −69.26) (SL = 2.0 N = 11, SL = 2.1 N = 16, SL = 2.2 N = 14, SL = 2.3 N = 15 and SL = 2.4 N = 12). c Top—rat myocardial slice visualised using a macroscope. The slice is placed on a mm grid and the green rectangle highlights the aligned portion of the myocardial slice. Bottom—custom-made 3D-printed plastic rectangular rings are attached to opposite ends of the aligned portion of the myocardial slice using surgical glue. Rings are attached perpendicular to myofibril orientation. d Myocardial slice attached to the posts of a custom-made stretcher using rings. Images show the different stretches required to achieve SL = 1.8–2.4 μm in rat myocardial slices. e Custom-made culture chamber. Myocardial slices are superfused with culture media. Media was oxygenated directly in the culture chamber. Field stimulation was provided via carbon electrodes. f Six-well plate with Transwell inserts. Unloaded myocardial slices placed on a porous membrane and each well filled with 1 mL of culture media. N = number of myocardial slices. Mean ± standard error is shown on graphs. Source data are provided as a Source Data file
Fig. 2
Fig. 2
Structure–function relationships: contractility, Ca2+ handling and T-tubular structure in rat myocardial slices cultured for 24 h. a Representative traces of rat myocardial slice contraction in all conditions. b Contractility of rat myocardial slices cultured for 24 h (0 h and unloaded N = 7, SL = 1.8 and 2.0 N = 6, SL = 2.2 N = 10 and SL = 2.4 N = 8). c Viability of rat myocardial slices cultured for 24 h assessed via CellTitre96 assay (0 h N = 13, unloaded N = 12 and SL = 1.8–2.4 N = 6). d Representative Ca2+ transients acquired with Fluo-4 loading and optical mapping. e Ca2+ transient amplitude of rat myocardial slices cultured for 24 h (0 h, SL = 1.8, 2.0 and 2.2 N = 24/6, unloaded N = 23/6, SL = 2.4 N = 20/6). f Rate of Ca2+ rise of rat myocardial slices cultured for 24 h (0 h, unloaded and SL = 2.0 N = 23/6, SL = 1.8 N = 24/6, SL = 2.2 N = 22/6 and SL = 2.4 N = 19/6). g Rate of Ca2+ decay of rat myocardial slices cultured for 24 h (0 h, SL = 1.8, 2.0 and 2.2 N = 24/6, unloaded N = 23/6 and SL = 2.4 N = 20/6). h Representative caveolin 3 staining of rat myocardial slices cultured for 24 h. i T-tubule density of rat myocardial slices cultured for 24 h (0 h, unloaded, SL = 1.8–2.2 N = 30/6, SL = 2.4 N = 25/6). j T-tubule power of the regularity of rat myocardial slices cultured for 24 h (0 h, unloaded, SL = 1.8–2.2 N = 30/6, SL = 2.4 N = 25/6). k Expression of genes associated with the sarcomere (N = 3). l Expression of genes associated with excitation–contraction coupling (N = 3). m Expression of genes associated with t-tubule stability (N = 3). Gene expression data from rat myocardial slices cultured for 24 h and expressed relative to 0 h rat myocardial slice gene expression. N = number of myocardial slices. For Ca2+-handling data, N = number of regions analysed/number of myocardial slices. For t-tubule analysis, N = number of cardiomyocytes analysed/number of myocardial slices. Black dots represent individual data points. Mean ± standard error is shown on graphs. One-way analysis of variance (ANOVA) was used to determine whether there were any statistically significant differences between the means of groups. $, $$, $$$ = p value < 0.05, 0.01 and 0.001, respectively compared with 0 h. *, **, *** = p value < 0.05, 0.01 and 0.001, respectively, between the two groups highlighted by a bar. Source data are provided as a Source Data file
Fig. 3
Fig. 3
Conduction, connexins, β-adrenergic stimulation and arrhythmogenesis in rat myocardial slices cultured for 24 h. a, b Representative images of longitudinal and transverse conduction maps of a 0 h rat myocardial slice. Black arrows show myocardial fibre direction. Yellow star = location of the stimulating electrode. Area of conduction map: 4.9 × 4.9 cm. c Longitudinal conduction velocity of rat myocardial slices cultured for 24 h (0 h N = 14, unloaded N = 10, SL = 1.8 N = 7, SL = 2.0 N = 6, SL = 2.2 and SL = 2.4 N = 8). d Conduction anisotropy ratio of rat myocardial slices cultured for 24 h (0 h N = 14, unloaded, SL = 2.2 and 2.4 N = 8, SL = 1.8 N = 7 and SL = 2.0 N = 6). e Representative images of rat myocardial slices stained for connexin 43. White arrow shows the longitudinal axis of cardiomyocytes. f Connexin 43 density in rat myocardial slices cultured for 24 h (0 h and SL = 2.4 N = 15/6, unloaded, SL = 1.8–2.2 N = 18/6). g Expression of genes associated with connexin 43 regulation and localisation at the intercalated disc (N = 3). h Isoproterenol dose response of rat myocardial slices cultured for 24 h (0 h, SL = 2.0–2.4 μm N = 7, unloaded N = 4 and SL = 1.8 μm N = 5). i Rate of aftercontractions with increasing concentration of isoproterenol of rat slices cultured for 24 h (0 h N = 8, unloaded, SL = 1.8–2.2 N = 6 and SL = 2.4 N = 7). j Arrhythmogenicity score of rat myocardial slices cultured for 24 h (0 h, unloaded, SL = 2.4 N = 8, SL = 1.8 and 2.0 N = 7 and SL = 2.2 N = 6). k Representative trace of an unloaded and SL = 1.8-μm rat myocardial slice developing a sustained tachyarrhythmia. l Expression of genes associated with the β-adrenergic stimulation (N = 3). Gene expression data from rat myocardial slices cultured for 24 h and expressed relative to 0 h rat myocardial slice gene expression N = number of myocardial slices. For Cx43 analysis, N = number of regions analysed/number of myocardial slices. Black dots represent individual data points. Mean ± standard error is shown on graphs. One-way analysis of variance (ANOVA) was used to determine whether there were any statistically significant differences between the means of groups. $, $$, $$$ = p value < 0.05, 0.01 and 0.001, respectively, compared with 0 h. *, **, *** = p value < 0.05, 0.01 and 0.001, respectively, between the two groups highlighted by a bar. Source data are provided as a Source Data file
Fig. 4
Fig. 4
Cell morphology, mitochondria and metabolism in rat myocardial slices cultured for 24 h. a Representative images of the morphology of rat myocardial slices cultured for 24 h. Scale bar = 50 μm. b Average cardiomyocyte area (0 h, SL = 1.8 and 2.2 N = 90/6, unloaded N = 76/6, SL = 2.0 N = 135/6 and SL = 2.4 N = 75/6). c Cardiomyocyte length-to-width ratio of rat myocardial slices cultured for 24 h (0 h, SL = 1.8–2.2 N = 90/6, unloaded N = 76/6 and SL = 2.4 N = 75/6). d Representative images of cardiac fibroblasts on the surface of rat myocardial slices cultured for 24 h. Scale bar = 250 μm. e Quantification of stromal cell proliferation on rat myocardial slices cultured for 24 h (values are expressed as normalised vimentin + area of rat myocardial slices cultured for 24 h) (N = 18/6, except SL = 2.4 N = 15/6). f Expression of genes associated with cardiac fibroblasts and myofibroblasts (N = 3). g Top—representative image of a rat myocardial slice stained with TOM20 (mitochondria) and α-actinin (sarcomeric apparatus). Scale bar = 5 μm. Bottom—profile plot of dual staining. h TOM20 density of rat myocardial slices cultured for 24 h (N = 9, except unloaded N = 6). i Concentration of adenosine triphosphate (ATP) of rat myocardial slices cultured for 24 h (N = 7). j) ATP:ADP ratio of rat myocardial slices cultured for 24 h (N = 7). Gene expression data from rat myocardial slices cultured for 24 h and expressed relative to 0 h rat myocardial slice gene expression. N = number of myocardial slices. For cardiomyocyte morphology analysis, N = number of cardiomyocytes analysed/number of myocardial slices. Black dots represent individual data points. Mean ± standard error is shown on graphs. One-way analysis of variance (ANOVA) was used to determine whether there were any statistically significant differences between the means of groups. $, $$, $$$ = p value < 0.05, 0.01 and 0.001, respectively, compared with 0 h. *, **, *** = p value < 0.05, 0.01 and 0.001, respectively, between the two groups highlighted by a bar. Source data are provided as a Source Data file
Fig. 5
Fig. 5
Electromechanical regulation of gene expression in rat myocardial slices cultured for 24 h. a Gene set enrichment analysis for unloaded rat myocardial slices compared with 0 h. A positive normalised enrichment scores equate to an enrichment of that gene set in unloaded slices. Gene sets on the Y axis, normalised enrichment score on the X axis, size of each point correlates with % enrichment (% of genes in a gene set that are enriched) and the colour of the point correlates with the gene set source (N = 3). b Gene set enrichment analysis for SL = 2.2 μm vs. SL = 1.8-μm rat myocardial slices. A positive normalised enrichment score equates to an enrichment of that gene set in SL = 2.2-μm slices. Gene sets on the Y axis, normalised enrichment score on the X axis, size of each point correlates with % enrichment (% of genes in a gene set that are enriched) and the colour of the point correlates with the gene set source (N = 3). SL = sarcomere length, GO = gene ontology, KEGG = Kyoto Encyclopaedia of Genes and Genomes. Source data are provided as a Source Data file
Fig. 6
Fig. 6
Electromechanical stimulation of human myocardial slices for 24 h and chronic culture of rabbit myocardial slices for 5 days (120 h). a Contractility of human heart failure myocardial slices cultured for 24 h (N = 6). b Contractility of rabbit myocardial slices cultured for 5 days—0 h (N = 6), 24 h (N = 11) and 120 h (N = 6) (grey) and the basal contractility was measured every 2 h during the 5-day experiments (N = 6) (blue). N = number of myocardial slices. Black dots represent individual data points. Mean ± standard error is shown on graphs. One-way analysis of variance (ANOVA) was used to determine whether there were any statistically significant differences between the means of groups. $, $$, $$$ = p value < 0.05, 0.01 and 0.001, respectively compared with 0 h. *, **, *** = p value < 0.05, 0.01 and 0.001, respectively, between the two groups highlighted by a bar. Source data are provided as a Source Data file

References

    1. Lee J, et al. Identification of cell-specific soluble mediators and cellular targets during cell therapy for the treatment of heart failure. Regen. Med. 2008;3:953–962. doi: 10.2217/17460751.3.6.953. - DOI - PubMed
    1. Zhang J, Wei X, Zeng R, Xu F, Li X. Stem cell culture and differentiation in microfluidic devices toward organ-on-a-chip. Futur. Sci. OA. 2017;3:FSO187. doi: 10.4155/fsoa-2016-0091. - DOI - PMC - PubMed
    1. Watson SA, et al. Preparation of viable adult ventricular myocardial slices from large and small mammals. Nat. Protoc. 2017;12:2623–2639. doi: 10.1038/nprot.2017.139. - DOI - PubMed
    1. Camelliti P, et al. Adult human heart slices are a multicellular system suitable for electrophysiological and pharmacological studies. J. Mol. Cell. Cardiol. 2011;51:390–398. doi: 10.1016/j.yjmcc.2011.06.018. - DOI - PubMed
    1. Bussek A, et al. Tissue slices from adult mammalian hearts as a model for pharmacological drug testing. Cell. Physiol. Biochem. 2009;24:527–536. doi: 10.1159/000257528. - DOI - PubMed

Publication types