

doi: 10.1038/s41598-019-43742-1.
Optimizing Silicon photomultipliers for Quantum Optics
Affiliations
- PMID: 31092863
- PMCID: PMC6520486
- DOI: 10.1038/s41598-019-43742-1
Item in Clipboard
Optimizing Silicon photomultipliers for Quantum Optics
Sci Rep.
.
Abstract
Silicon Photomultipliers are potentially ideal detectors for Quantum Optics and Quantum Information studies based on mesoscopic states of light. However, their non-idealities hampered their use so far. An optimal mode of operation has been developed and it is presented here, proving that this class of sensors can actually be exploited for the characterization of both classical and quantum properties of light.
Conflict of interest statement
The authors declare no competing interests.
Figures
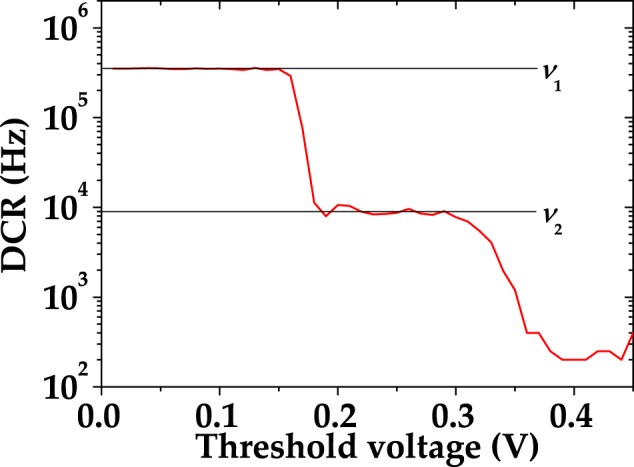
Threshold scan of SiPM performed at room temperature with no impinging light.
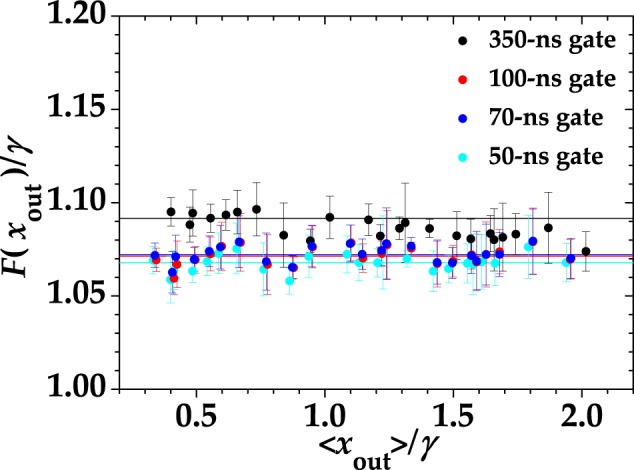
Fano factor for Poissonian statistics as a function of the mean output of the detector. Different colors correspond to different integration gate widths: black to 350-ns gate, red to 100-ns gate, blue to 70-ns gate, and cyan to 50-ns gate. Dots: experimental data; lines: fitting linear curves in which ε is the only fitting parameter.

Cross-talk probability as a function of the length of the gate for . Dots + error bars: experimental data; red and blue curves: theoretical fitting curves for short and long times, respectively.
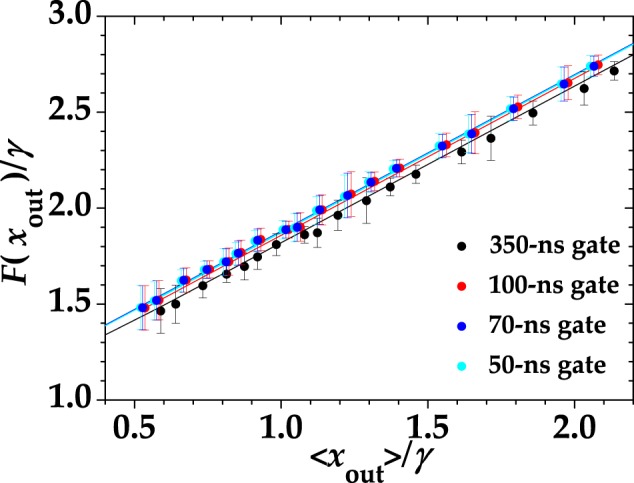
Fano factor for multi-mode thermal statistics as a function of the mean output of the detector. Different colors correspond to different integration gate widths: black to 350-ns gate, red to 100-ns gate, blue to 70-ns gate and cyan to 50-ns gate. Dots: experimental data; lines: fitting curves with fitting parameters 〈x〉dc and μ, while ε is fixed from the plots in Fig. 2.
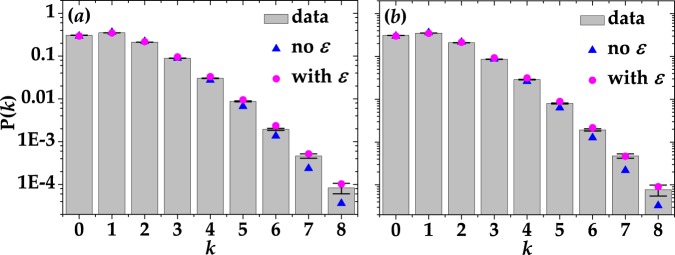
Reconstructed P(k) distributions in the case of coherent light for two choices of gate widths: 100 ns in panel (a) and 50 ns in panel (b). Gray columns + black error bars: experimental data; magenta dots: theoretical fitting curves in case the detector is affected by cross talk; blue triangles: theoretical curves in the absence of cross talk. The values of the χ2 per degree of freedom are: 34.47 and 28.02 in the absence of cross talk and 25.19 and 23.07 in the presence of it, respectively.

Reconstructed P(k) distributions in the case of multi-mode thermal light for 100-ns (a) and 50-ns (b) gate width. Gray columns + black error bars: experimental data; magenta dots: theoretical fitting curves in case the detector is affected by cross talk; blue triangles: theoretical curves in the absence of cross talk. In the presence of cross-talk effect, the values of the number of modes are μ = 1.5148 ± 0.5387 and μ = 1.4790 ± 0.5201, respectively. The corresponding χ2 per degree of freedom is 14.24 in (a) and 14.79 in (b). On the contrary, in the absence of cross-talk effect we got μ = 1.3972 ± 0.0113 in panel (a) and μ = 1.3733 ± 0.0113 in panel (b). The corresponding χ2 per degree of freedom is 10.85 in (a) and 11.91 in (b). The contribution of dark counts is not considered in the theoretical fitting curves.
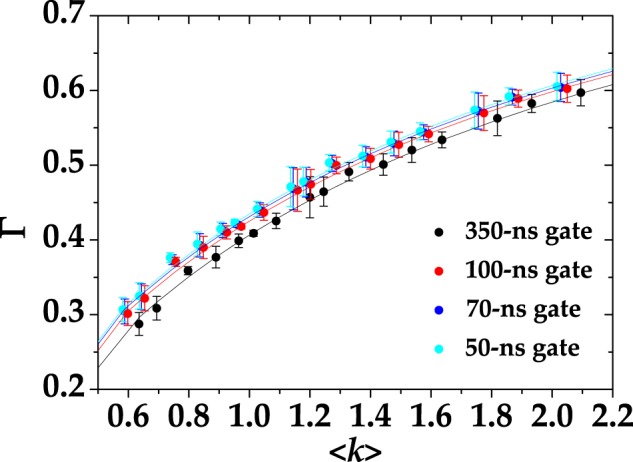
Experimental correlation coefficient Γ (dots + error bars) as a function of 〈k〉 for pseudo-thermal light together with theoretical fitting curves (lines). Different colors correspond to different gate widths, namely 350 ns (black), 100 ns (red), 70 ns (blue), and 50 ns (cyan). The fitting parameter is μ, while ε is fixed from the plots in Fig. 2 and 〈m〉dc from the values reported in Table 2. The fitting parameter obtained in the four cases is shown in Table 3.
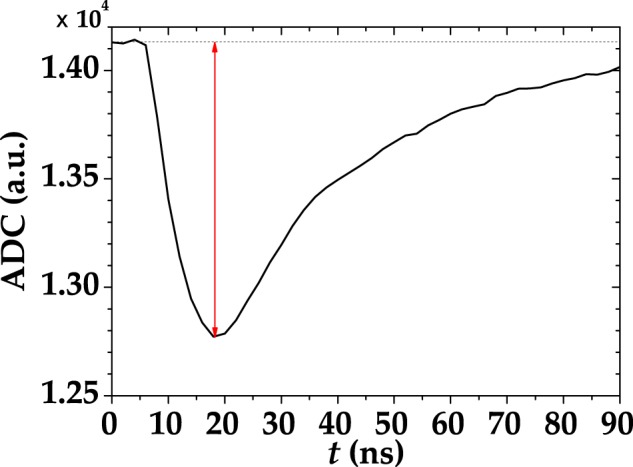
A single-shot detector signal, acquired with the peak-and-hold circuit, is indicated as black curve. The red arrow indicates that in this case the height of the peak was extracted shot-by-shot.
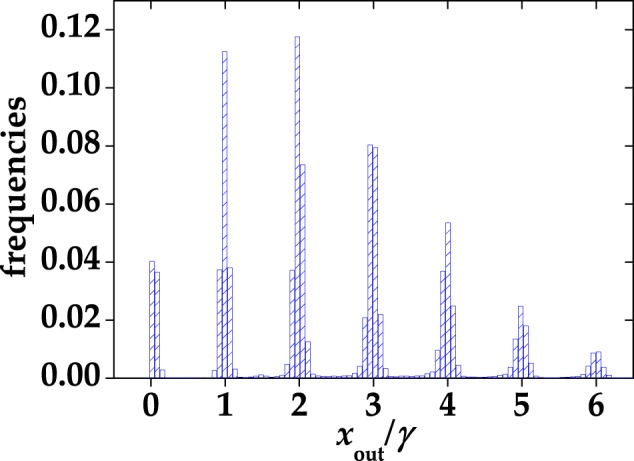
Normalized pulse-height spectrum corresponding to a coherent state with 〈m〉 = 2.56, obtained by applying the peak-and-hold acquisition system to the signal output.
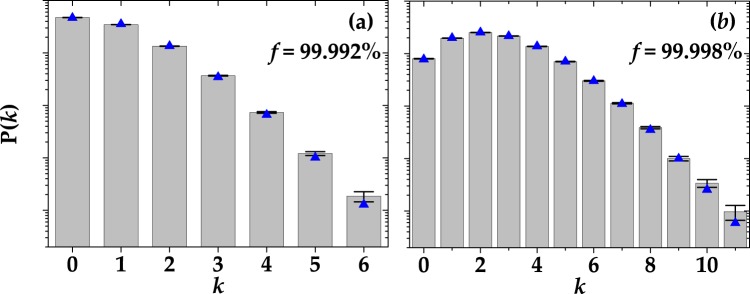
Reconstructed P(k) distributions in the case of coherent light acquired with the peak-and-hold circuit to the output signal. (a) Coherent light with 〈m〉 = 0.76. (b) Coherent light with 〈m〉 = 2.56. Gray columns + black error bars: experimental data; blue triangles: theoretical curves in the absence of cross talk. The corresponding χ2 per degree of freedom is 8.31 in (a) and 1.33 in (b). The values of fidelity are also shown.
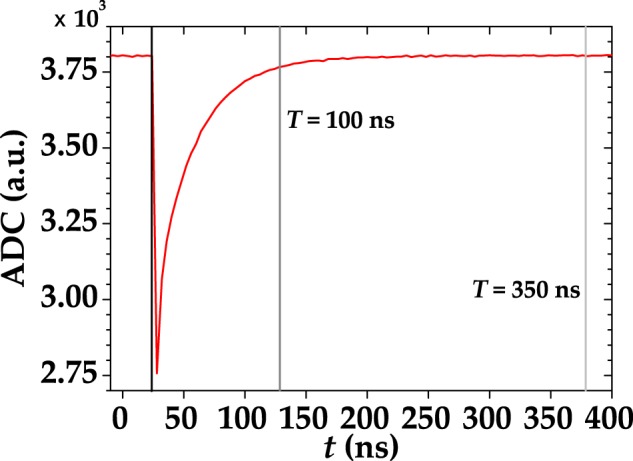
A single-shot detector signal, acquired with the digitizer, is indicated as red curve together two possible integration gates, T. The gate ending with the vertical gray line is 100-ns long, whereas the one ending with the vertical light gray line is 350-ns long.
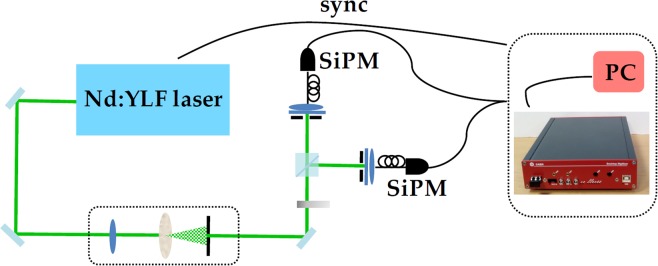
Experimental setup for the measurement of coherent and multi-mode thermal states. See the text for details.
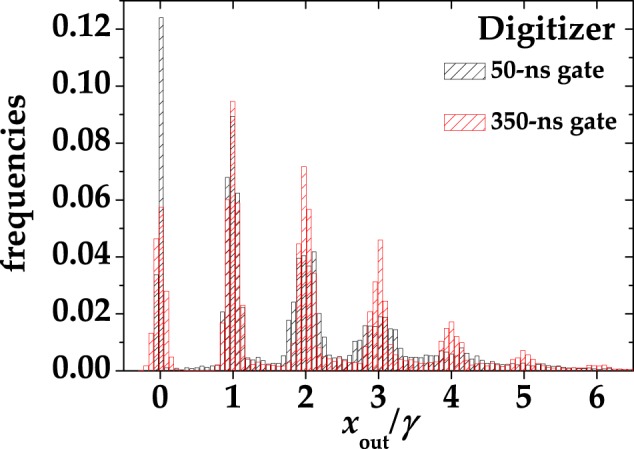
Normalized pulse-height spectra corresponding to a multi-mode thermal state with acquired with the digitizer and then integrated over different gate widths. Black: 50-ns gate; red: 350-ns gate.

Signal-to-noise ratio S/N for the digitized signals in Fig. 13 as a function of the integration time, T.
References
-
- Akindinov AV, Martemianov AN, Polozov PA, Golovin VM, Grigoriev EA. New results on MRS APDs. Nucl. Instr. and Meth. in Phys. Res. A. 1997;387:231–234. doi: 10.1016/S0168-9002(96)01201-6. - DOI
-
- Bondarenko G, et al. Limited Geiger-mode silicon photodiode with high gain. Nucl. Physics. B (proc. Suppl.) 1998;61B:347–352. doi: 10.1016/S0920-5632(97)00585-9. - DOI
-
- Saveliev V, Golutvin V. Silicon avalanche photodiodes on the base of Metal- Resistor-Semiconductor, MRS structures. Nucl. Instrum. Methods A. 2000;442:223. doi: 10.1016/S0168-9002(99)01225-5. - DOI
-
- Piemonte C. A new silicon photomultiplier structure for blue light detection. Nucl. Instrum. Methods A. 2006;568:224. doi: 10.1016/j.nima.2006.07.018. - DOI
-
- Renker, D. & Lorenz, E. Advances in solid state photon detectors. J. Instrum. 4, P04004, and references therein (2009).
LinkOut - more resources
Full Text Sources
