. 2019 May 15;9(1):7457.
doi: 10.1038/s41598-019-43845-9.

Low-cost, sub-micron resolution, wide-field computational microscopy using opensource hardware

Affiliations

Low-cost, sub-micron resolution, wide-field computational microscopy using opensource hardware

Tomas Aidukas et al. Sci Rep. .

Abstract

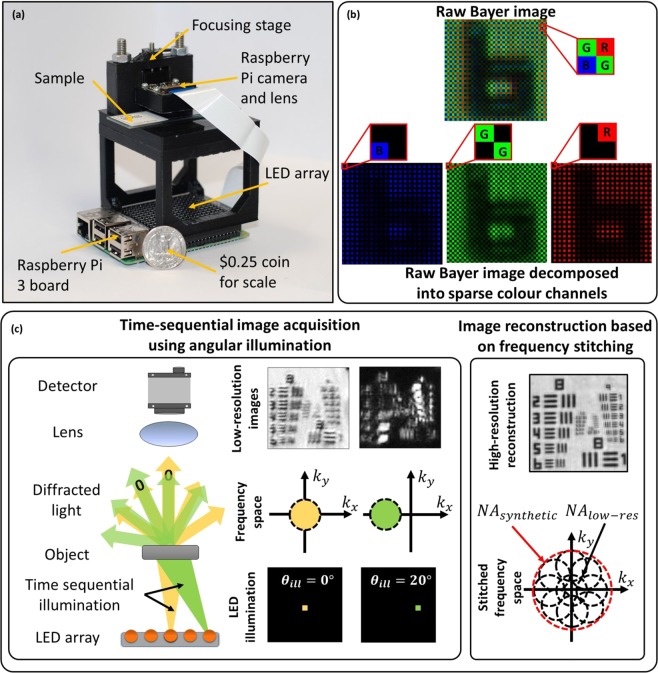
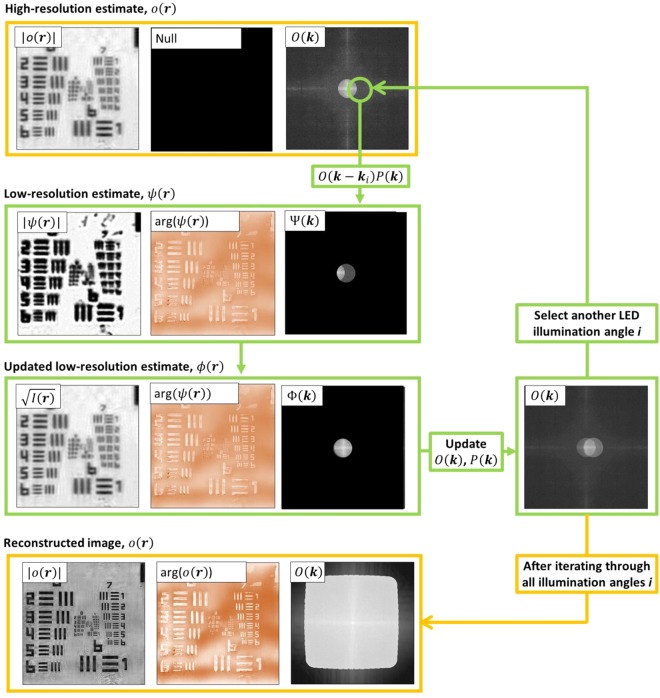
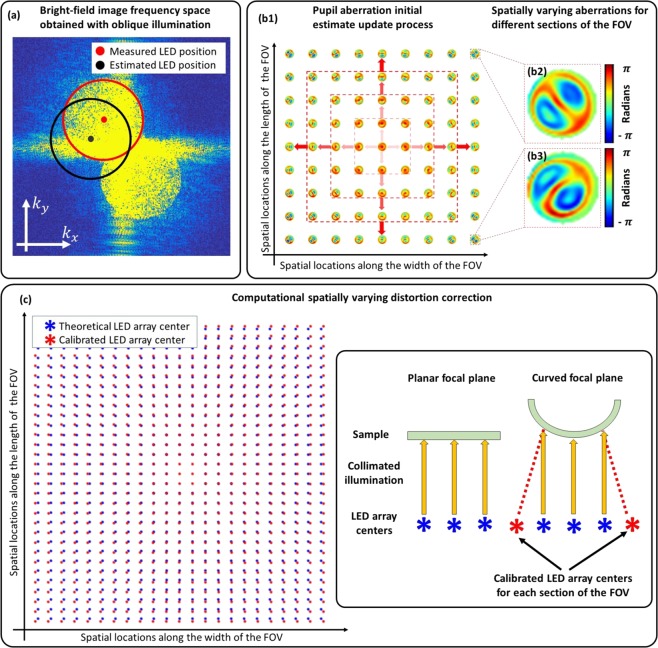
The revolution in low-cost consumer photography and computation provides fertile opportunity for a disruptive reduction in the cost of biomedical imaging. Conventional approaches to low-cost microscopy are fundamentally restricted, however, to modest field of view (FOV) and/or resolution. We report a low-cost microscopy technique, implemented with a Raspberry Pi single-board computer and color camera combined with Fourier ptychography (FP), to computationally construct 25-megapixel images with sub-micron resolution. New image-construction techniques were developed to enable the use of the low-cost Bayer color sensor, to compensate for the highly aberrated re-used camera lens and to compensate for misalignments associated with the 3D-printed microscope structure. This high ratio of performance to cost is of particular interest to high-throughput microscopy applications, ranging from drug discovery and digital pathology to health screening in low-income countries. 3D models and assembly instructions of our microscope are made available for open source use.


Conflict of interest statement

The authors declare no competing interests.

Figures

Figure 1
Figure 1
(a) Experimental setup next to a quarter US dollar for scale. Raspberry Pi 3 single-board computer board (placed at the bottom) enables wireless image acquisition and data transfer without the need for a PC. (b) Bayer color filter array indicating RGGB pixel arrangement. (c) In FPM several low-resolution images are obtained in time sequence, each illuminated with a corresponding to the object illuminated from a different angle. Angular diversity enables to obtain multiple frequency regions, which can be stitched together into a single high-resolution, wide-field image.
Figure 2
Figure 2
(a) Diagram illustrating what is meant by the overlap percentage between adjacent frequency regions. (b) Demosaiced and sparsely-sampled reconstruction accuracy for different sampling factors showing that a factor of two is required when using DR and SSR methods; 70% overlap area in the frequency domain. (c) Demosaiced and sparse reconstruction accuracy for different frequency overlap percentages. As expected, accuracy improves as overlap increases. (d) Reconstruction convergence plots for object amplitude and pupil phase (70% overlap and sampling factor of 2), indicating better performance of demosaiced reconstruction. (e) Frequency spectra of monochrome and color sensor images showing frequency replicates introduced by the Bayer filter and how it distorts the circular boundary. The boundary becomes undistorted only for a sampling factor of 3. (f) Reconstructed simulated images.
Figure 3
Figure 3
Reconstructions of a USAF resolution chart. (a1a4) Incoherent raw images. (b1b9) Demosaiced reconstructions and (c1c9) sparsely-sampled reconstructions together with line profiles of the smallest resolved USAF target bars. The maximum achieved resolution using the blue LED was 780 nm based on group 10 element 3. (d1d3) Reconstructed images with RGB LEDs used in parallel for illumination demonstrating the reduced reconstruction quality due to the spectral overlap between the color channels. The respective color channels are indicated by the red, green and blue borders of the left, middle and right images.
Figure 4
Figure 4
(a) Reconstructed and (b) raw lung carcinoma images. (c1,d1) are the captured raw, low-resolution images and (c2,c3,d2,d3) intensity and phase reconstructions for two different segments of the FOV. (c4,d4) Recovered pupils with aberrations.
Figure 5
Figure 5
Diagram of a single FPM reconstruction algorithm iteration n. It starts by initializing a high-resolution image estimate o0(r), which was an interpolated experimental brightfield image. For each illumination angle, a region of the high-resolution estimate spectrum, corresponding to illumination angle i is low-pass filtered to produce an estimate of the low-resolution image: ψn(i). A new estimate, φn(i) is obtained by replacing the amplitude of ψn(i) with the amplitude of the demosaiced recorded image, I, while retaining the phase of ψn(i). The low-resolution spectrum is added into the high-resolution spectrum using eqs (6) and (7) to yield the updated object spectrum and pupil functions On+1(k) and Pn+1(k). The whole process continues till spectrum regions corresponding to all illumination angles are updated. An example of the reconstructed spectrum is shown at the bottom of the figure.
Figure 6
Figure 6
(a) Frequency space of a brightfield image obtained using an oblique illumination angle. Blue and green dots indicate initial and corrected LED positions respectively by using circle fitting. (b1) Aberrations recovered from each section are used as initial estimates for neighboring sections, starting from the center of the FOV towards the edges. (b2,b3) Examples of recovered aberrations throughout the full-FOV indicating spatially-varying aberrations. (c) Implementing LED calibration on each segment across the FOV enabled us to find the spatially varying distortion by measuring the global LED position shift.

References

    1. Petti CA, Polage CR, Quinn TC, Ronald AR, Sande MA. Laboratory Medicine in Africa: A Barrier to Effective Health Care. Clin. Infect. Dis. 2006;42:377–382. doi: 10.1086/499363. - DOI - PubMed
    1. Imwong M, et al. High-throughput ultrasensitive molecular techniques for quantifying low-density malaria parasitemias. J. Clin. Microbiol. 2014;52:3303–9. doi: 10.1128/JCM.01057-14. - DOI - PMC - PubMed
    1. Mendlovic D, Lohmann AW, Zalevsky Z. Space–bandwidth product adaptation and its application to superresolution: examples. J. Opt. Soc. Am. A. 1997;14:563. doi: 10.1364/JOSAA.14.000563. - DOI
    1. Konda, P. C. Multi-Aperture Fourier Ptychographic Microscopy: Development of a high-speed gigapixel coherent computational microscope. Retrieved from http://theses.gla.ac.uk/9015/ (2018).
    1. McConnell G, et al. A novel optical microscope for imaging large embryos and tissue volumes with sub-cellular resolution throughout. Elife. 2016;5:1–15. doi: 10.7554/eLife.18659. - DOI - PMC - PubMed

Publication types