. 2019 Jun;570(7759):107-111.
doi: 10.1038/s41586-019-1212-5. Epub 2019 May 15.

Tracing the origin of adult intestinal stem cells

Affiliations

Tracing the origin of adult intestinal stem cells

Jordi Guiu et al. Nature. 2019 Jun.

Abstract

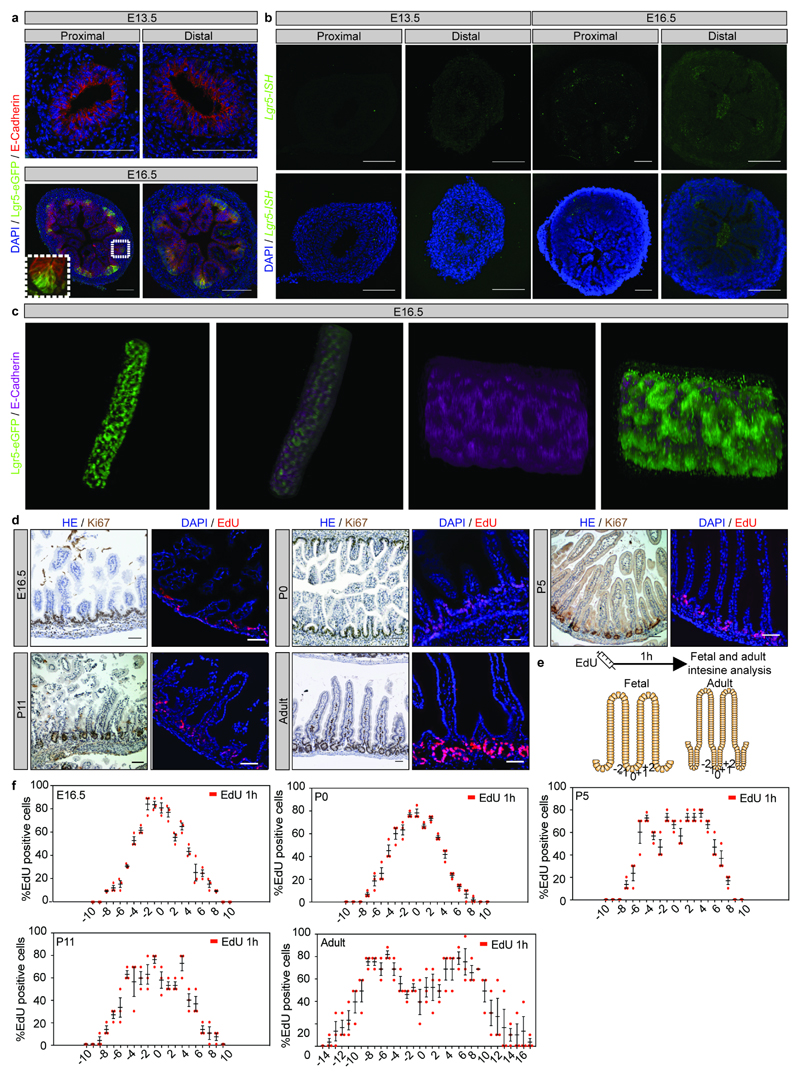
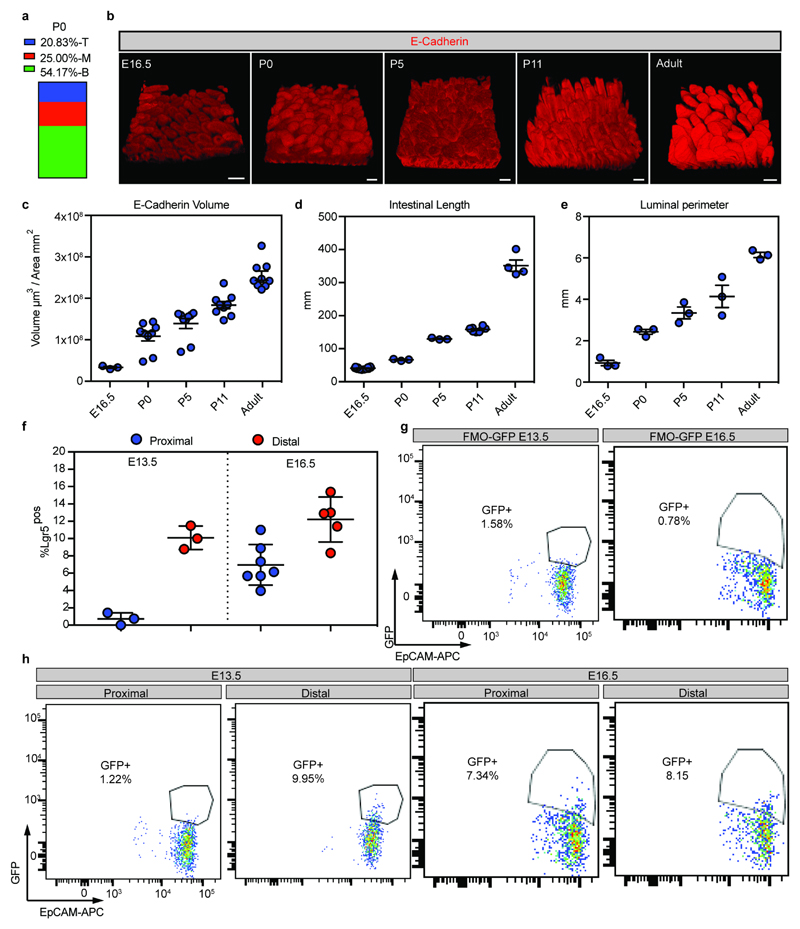
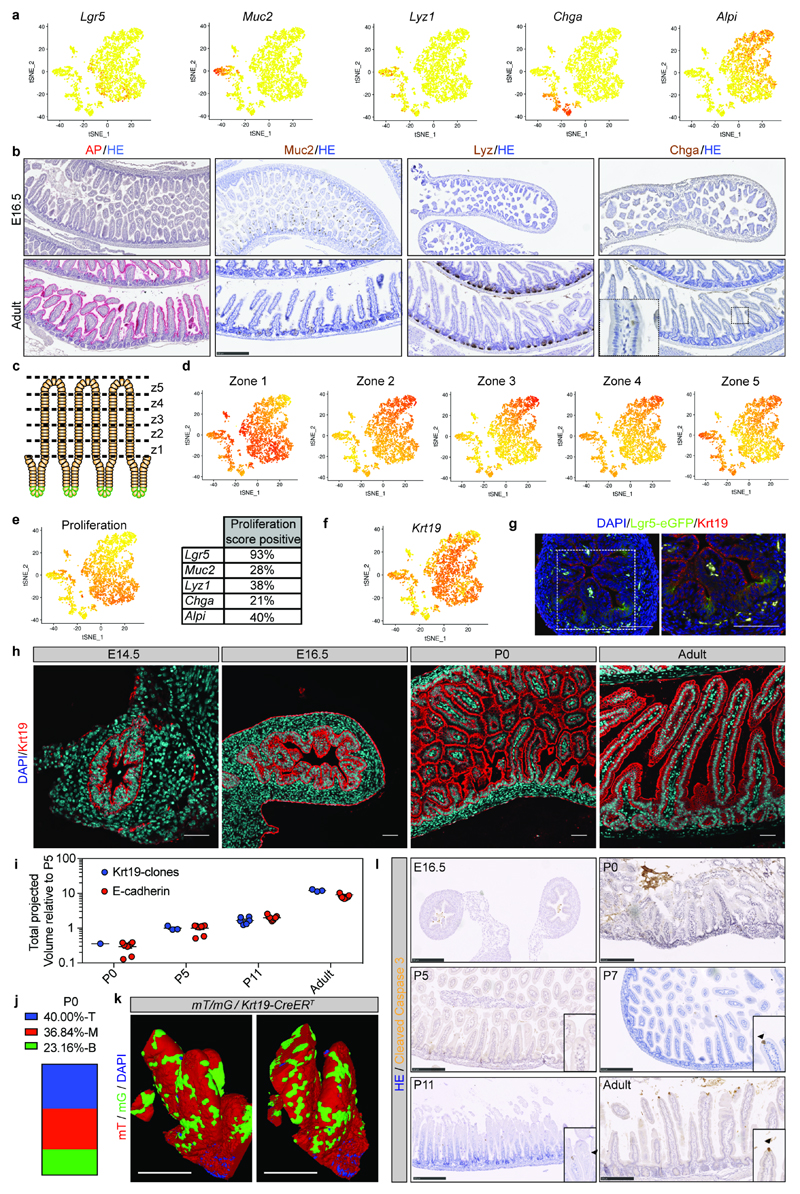
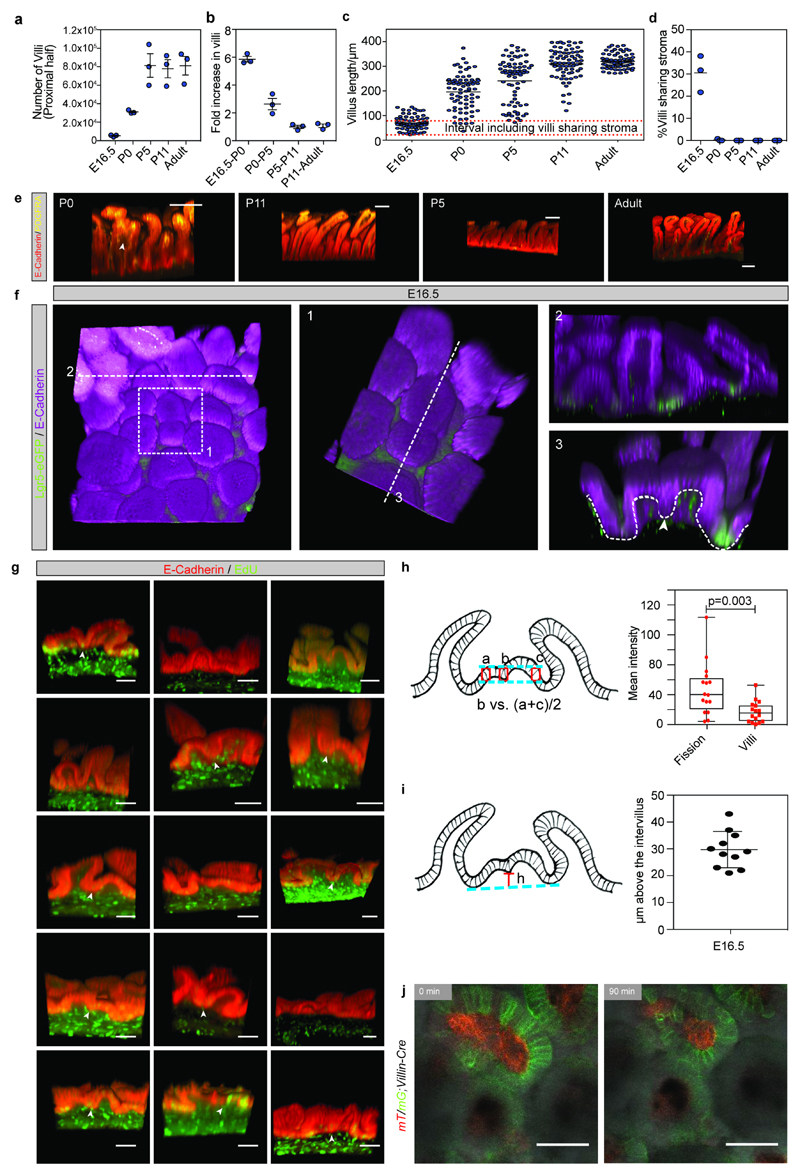
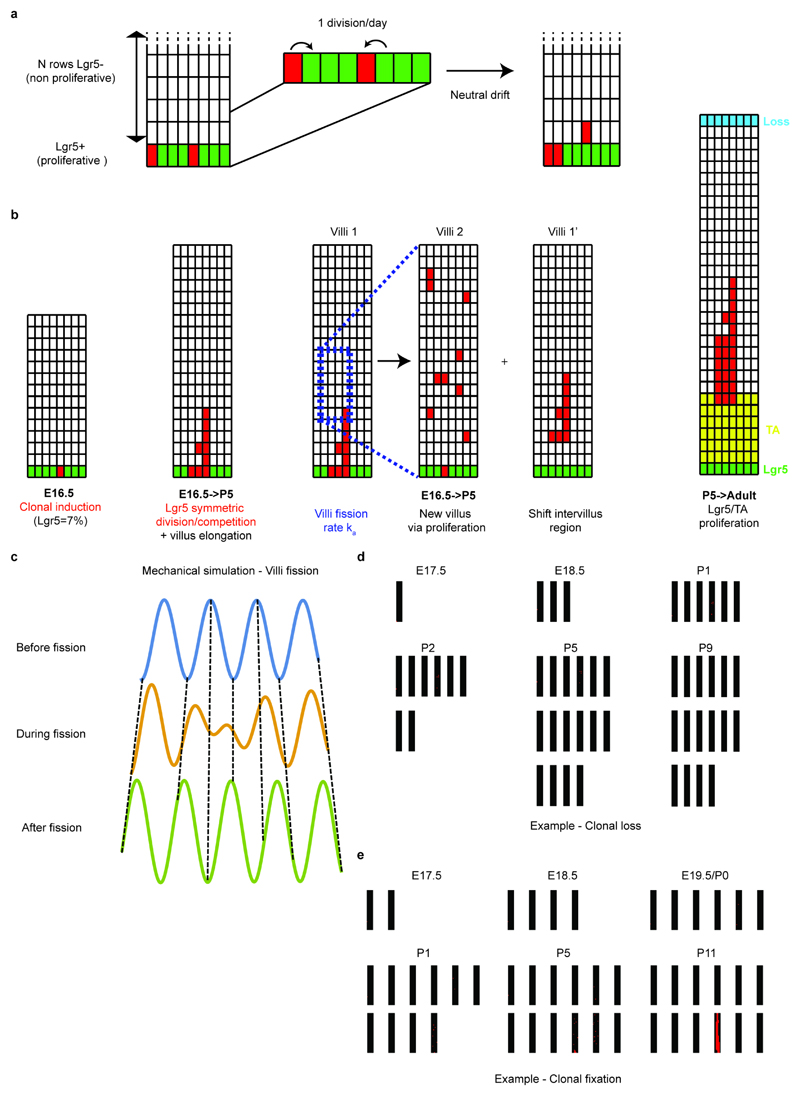
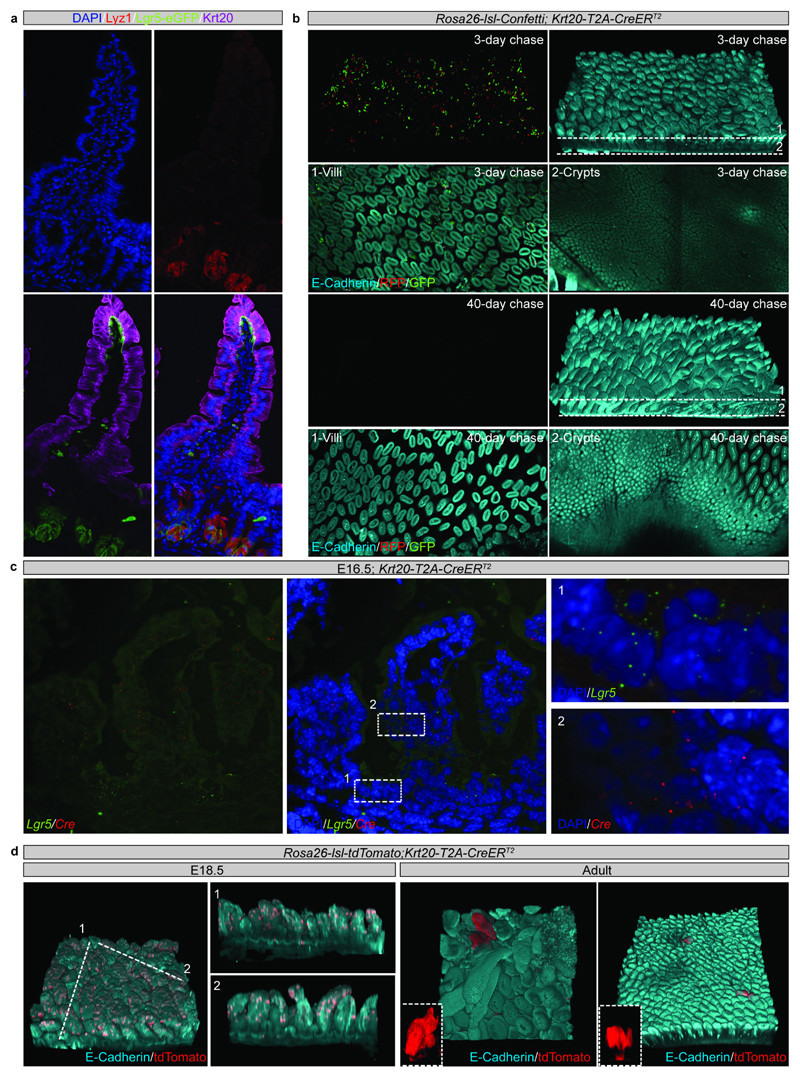
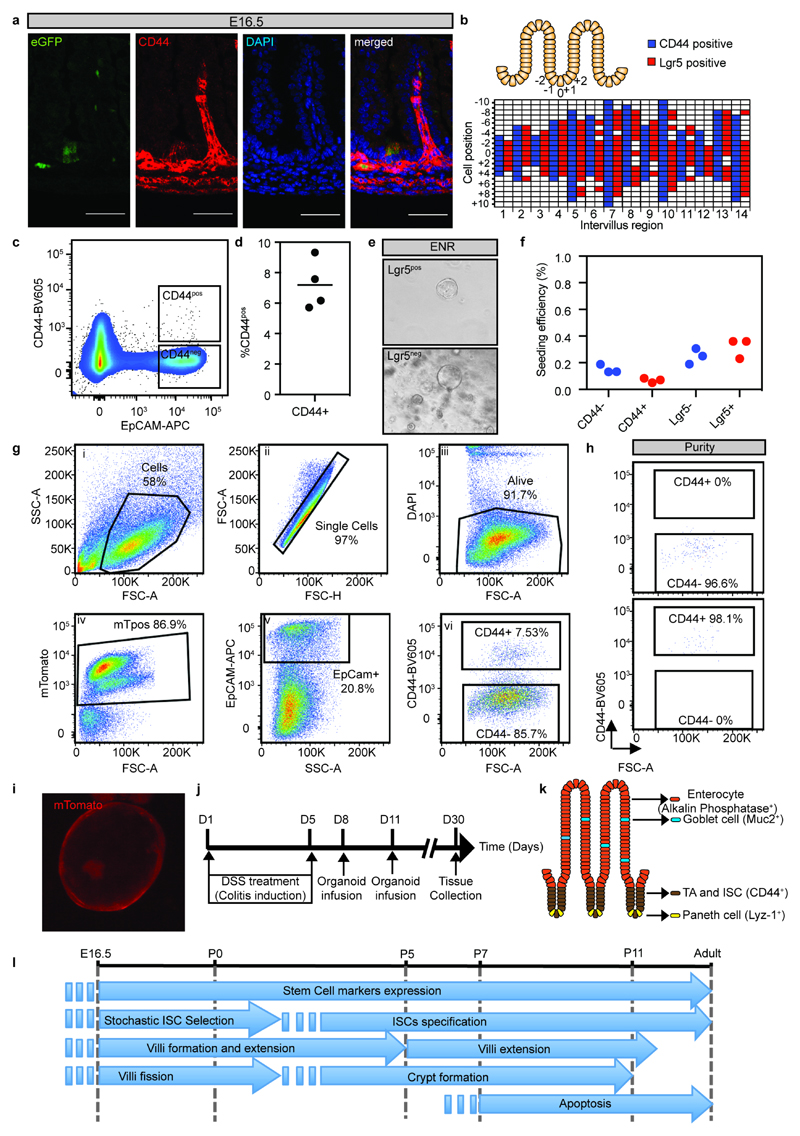
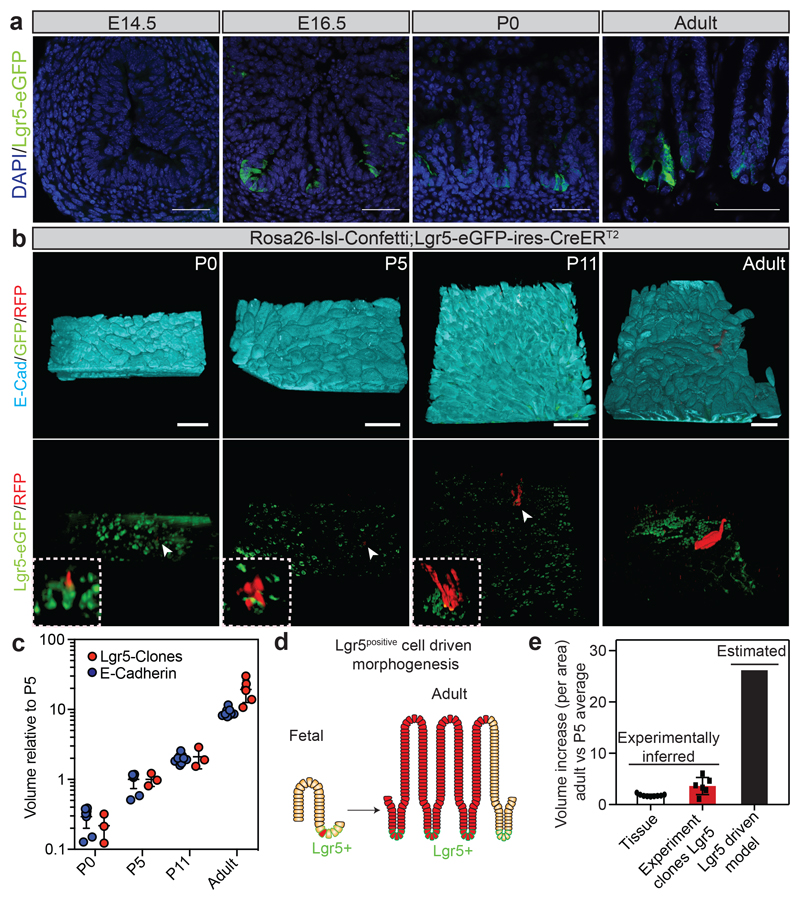
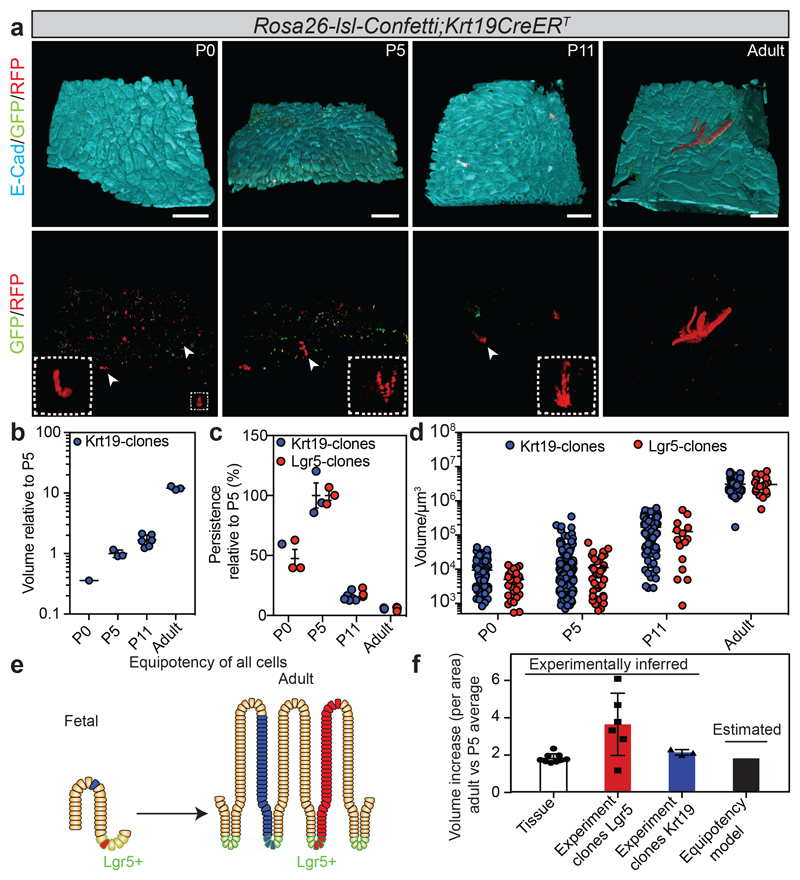
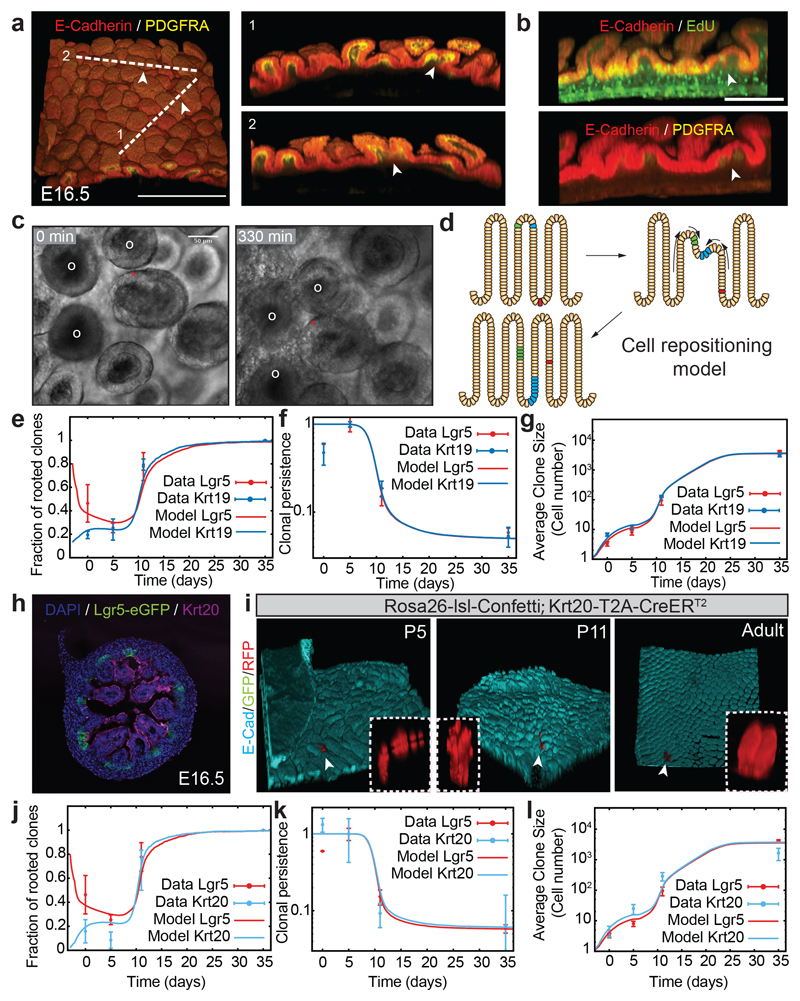
Adult intestinal stem cells are located at the bottom of crypts of Lieberkühn, where they express markers such as LGR51,2 and fuel the constant replenishment of the intestinal epithelium1. Although fetal LGR5-expressing cells can give rise to adult intestinal stem cells3,4, it remains unclear whether this population in the patterned epithelium represents unique intestinal stem-cell precursors. Here we show, using unbiased quantitative lineage-tracing approaches, biophysical modelling and intestinal transplantation, that all cells of the mouse intestinal epithelium-irrespective of their location and pattern of LGR5 expression in the fetal gut tube-contribute actively to the adult intestinal stem cell pool. Using 3D imaging, we find that during fetal development the villus undergoes gross remodelling and fission. This brings epithelial cells from the non-proliferative villus into the proliferative intervillus region, which enables them to contribute to the adult stem-cell niche. Our results demonstrate that large-scale remodelling of the intestinal wall and cell-fate specification are closely linked. Moreover, these findings provide a direct link between the observed plasticity and cellular reprogramming of differentiating cells in adult tissues following damage5-9, revealing that stem-cell identity is an induced rather than a hardwired property.


Conflict of interest statement

Competing financial interests

The authors declare no competing financial interests.

Figures

Extended Data Figure 1
Extended Data Figure 1. Lgr5 positive cells and proliferative cells are restricted to the intervillus regions.
a) Detection of E-Cadherin (red) and GFP (Lgr5-DTR-eGFP) at E13.5 and E16.5 in proximal and distal small intestine. Tissue is counterstained with DAPI (cyan). A representative picture from each time point and intestinal segment is shown (n=3 animals analyzed). b) In situ hybridization of endogenous Lgr5 at E13.5 and E16.5 in proximal and distal small intestine. Tissue is counterstained with DAPI (cyan). A representative picture of at each time point and intestinal segment is shown (n=3 animals analyzed). c) Detection of E-cadherin (magenta) and GFP (Lgr5-DTR-eGFP) in intestinal whole-mount at E16.5 in proximal small intestine. A representative picture from n=3 independent samples is shown. d) Detection of Ki67 and EdU (red) following a 1-hour pulse at the indicated time points (left and right panels, respectively). Three animals were analyzed at each time point and a representative picture is shown. Scale bars: 50μm. e-f) Quantification of number and location of EdU+ cells as depicted (e) from at least 10 intervillus regions per mouse at E16.5, P5, P11, Adult, and 20 intervillus regions per mouse at P0 up to position 10 and position 17 (adult). Samples from three animals were analyzed at each time point. Bars represent the mean + S.E.M.
Extended Data Figure 2
Extended Data Figure 2. Lgr5-derived clones are located in intervillus regions and qualitative/quantitative morphological analysis of the intestine from fetal to adult stages.
a) Quantification of the localization of labeled clones at P0 following labeling at E16.5 in Rosa26-lsl-Confetti/Lgr5-eGFP-ires-CreERT2 animals. Villi containing clones were divided in three equal regions (T: top, M: mid, B: bottom) based on the z-projections in the 3D to determine the clone localization at P0 (n=24 clones). b) Detection of E-cadherin (red) in whole mounts at the indicated time points. Scale bars: 100μm. A minimum of three animals were analyzed at each time point and representative pictures are shown (E16.5 n=3, P0 n=9, P5 n=9, P11 n=9, Adult n=9 independent animals) c) Measurements of the total epithelial volume/unit area based on detection of E-cadherin relative to the area of the intestine was assessed (samples from b). Dots represent independent biological samples and lines represent the mean±S.E.M. d) Length of the small intestine at E16.5 (n=12), P0 (n=3), P5 (n=3), P11 (n=8) and Adult (n=4). Dots represent individual animals and lines represent the mean±S.E.M. e) Luminal perimeter of the small intestine at E16.5, P0, P5, P11 and Adult. Dots represent individual animals (n=3) and lines represent the mean±S.E.M. f-h) Quantification of GFP as a proxy of Lgr5 in proximal and distal small intestine at E13.5 (n=3 animals both proximal and distal) and E16.5 (n=7 animals proximal and n=5 animals distal) small intestines (f). Fluorescence minus one (GFP) controls used to establish the positive gates are shown in (g). h) Representative FACS dot plot illustrating the gating strategy to quantify the size of the Lgr5-DTR-eGFPpositive population (Gate: DAPInegCD31negCD45negEpCAMpos). Dots represent measurement in individual animals and lines represent the mean±S.E.M.
Extended Data Figure 3
Extended Data Figure 3. Characterisation of the fetal small intestinal epithelium.
a) tSNE plots from sc-RNAseq of epithelial cells from the proximal small intestine showing expression of ISC (Lgr5) and differentiation markers (Muc2, Lyz1, ChgA, Alpi). Darker color indicates higher normalized gene expression. Each dot represents independent cells, a total of 3509 cells are shown. b) Detection of differentiation markers at E16.5 and adult small intestine. Tissue is counterstained with HE. Scale bars: 250μm. Samples from n=3 animals were analysed at each time point and representative images are shown. c-d) (c) Cartoon depicting that adult villi are transcriptionally zonated in five regions from the bottom to the top (z: zone). (d) tSNE plots showing the enrichment of villi clusters in the sc-RNAseq from E16.5 small intestine. e) tSNE plot showing the enrichment of a proliferation signature in specific cell populations (left panel) and fraction of cells in each subpopulation scoring positive for the proliferation gene signature (right panel). Darker color in tSNE plot indicates higher expression levels of the proliferation gene signature. f) tSNE plot showing expression of Keratin 19 (Krt19). Darker color indicates higher normalized gene expression levels. g) Detection of Krt19 (red) and GFP (Lgr5-DTR-eGFP) at E16.5 in proximal small intestine. Tissue is counterstained with DAPI (cyan). Scale bars: 50μm. Samples from three animals were analyzed and a representative picture is shown. h) Detection of (Krt19, red) at different time points in tissue from the small intestine. Tissue is counterstained with DAPI (cyan). Scale bars: 50μm. Samples from three animals were analyzed per time point and representative pictures are shown. i) Relative volume (projected) of Krt19-clones and epithelium based on E-Cadherin. E-Cadherin is also shown in Figure 1c and Krt19-clones are also shown in Figure 2. (Krt19-clones, biologically independent samples: P0 n=1; P5 n=3, P11 n=6, Adult n=3; E-Cadherin biologically independent samples: P0 n=9, P5 n=9, P11 n=9, Adult n=9) j) Quantification of the localization of labeled clones at P0 following administration of 4-hydroxytamoxifen at E16.5 in Rosa26-lsl-Confetti/Krt19-CreERT animals. Villi containing clones were divided in three equal regions (T: top, M: mid, B: bottom) based on the z-projection in 3D to determine where clones were located at P0 (n=27). k) Detection of GFP (green) and RFP (red) in whole mounts from the proximal part of the small intestine isolated from mT/mG/Krt19CreERT animals at P0 following induction at E16.5. A representative picture of n=3 biologically independent samples is shown. Scale bars: 25μm l) Apoptotic cells were detected by cleaved caspase3. Arrowheads demarcate positive cells in inserts. Samples from 3 animals were analyzed per time point and representative pictures are shown. Scale bars: 250μm.
Extended Data Figure 4
Extended Data Figure 4. Villi formation and parameter description of villi fissions.
a) Total number of villi (projected) in the proximal half of the small intestine based on equal density along the length. Samples from 3 animals were analyzed per time point. Each dot represents an animal and lines represent the mean±S.E.M. b) The fold change in villi numbers between the indicated time points based on 3 samples analyzed per time point. Each dot represents an independent sample and lines represent the mean±S.E.M. c) Villus height at the different time points. The demarcated red lines indicate the interval containing villi with sharing stroma. The length was assessed in 25 villi per animal and in 3 animals per time point. Dots represent independent measurements and lines represent the mean. d) Quantification of the number of villi sharing stroma in 3 animals per indicated time point (E16.5 n=233, P0 n=412, P5 n=406, P11 n=412, Adult n=129 villi were counted). Dots represent the percentage of villi sharing stroma in each independent animal and the line the mean. e) Detection E-cadherin (red) and PDGFRA (yellow) in whole mounts indicating villi with sharing stroma (arrowhead). Samples from 3 animals were analyzed per time point and representative pictures are shown. Scale bars: 100μm. f) Detection of E-cadherin (magenta) and GFP (Lgr5-DTR-eGFP) in E16.5 intestinal whole-mount. Boxed area (1) indicate a villus undergoing fissioning shown in higher magnification. Transversal sections (a and 3) illustrating villi surrounded by Lgr5-expressing cells (2) and villus with shared mesenchyme (3). Arrowhead indicates that pockets formed in a fissioning villus are Lgr5 negative, dashed line outline the epithelium. Samples from 3 animals were analyzed and a representative picture is shown. g) Detection of EdU incorporation (green) in the epithelium (E-cadherin, red) following a 1-hour chase in E16.5 intestinal whole-mounts. Arrowheads indicating proliferative cells at the edge of putative villi undergoing fission. These are detected in 11 out of 16 structures. Representative pictures from 3 animals analyzed are shown. Scale bars: 50μm h) Quantification of EdU intensity in the fissioning areas compared to the surrounding villi at the same height quantified as depicted in the cartoon based on thresholded intensity in the demarcated boxes. n=16 independent villi sharing stroma were quantified. Min to max quartiles, dots represent fluorescent ratio of the independent villi sharing stroma quantified. Paired t-test was applied. i) Height of the proliferative fissioning areas compared to the surrounding intervillus regions were quantified as depicted in the cartoon. n=11 independent villi sharing stroma were quantified. j) Pictures showing the start and end points from live-imaging of villi undergoing fission (Supplementary Video 6). In mT/mG;Villin-Cre animals, where the epithelium is shown Green (mG) and remaining cells in red (mT). A representative fission event from 5 analyzed animals ishown. Scale bar: 50μm.
Extended Data Figure 5
Extended Data Figure 5. Outline of the model and typical outputs from simulations
a) Schematics of the model for the renewal of intervillus Lgr5+ cells. Based on proliferation data, we assume that the classical model of symmetrically dividing and competing Lgr5+ cells holds embryonically, with a division rate once a day. The “losing” cell is expelled into the TA compartment, displacing all cells above it by one position. b) Schematics of the model for the dynamics of differentiated cells on the villus. The model dynamics are separated into two phases. A first one occurs from E16.5 to P5: Lgr5+ cells are the only proliferative cells, and villi fission occurs as a stochastic event, resulting in the duplication of a villus sub-region into a whole new intervillus/villus grid, and a resulting shift of cells along the existing villus. A second phase occurs after P5, where the dynamics are similar to adulthood, with rapidly dividing TA cells (occupying 1/5 of the villus at the bottom) and cell loss at the top. Proliferation of TAs is again exclusively along the top/bottom axis, resulting in unidirectional displacement of all cells above the dividing cell. c) Three snapshots from a numerical simulation of the epithelium as a growing elastic sheet on a growing elastic media. The growth is assumed to be quasi-static, so that the epithelium wishes to maintain a deformation at a given wavelength, minimizing the elastic energy of the sheet+substrate. Where the system grows (top to bottom panels), this results in de novo villi formation from local deformations of the epithelial sheet, resulting in villus and intervillus regions to shift places via tissue bending (dashed lines serve as a guide for the eye to represent how a cell in a given position x can change height z). d-e) Two sets of snapshots from two numerical simulations of an E16.5 Lgr5 tracing, according to the rules outlined in a-b). Each black box represents an intervillus/villus grid, with the number increasing in time due to random villi fission. Red squares indicate the labeled cells at E16.5 (initially in the bottom-most layer of Lgr5+ cells). Panel d) displays an example of a clone, which becomes lost in time, despite having participated to villi fission between E18.5 and P1. Panel e) displays an example of a clone, which becomes fixed within one of the villi having formed de novo during the simulation (while the labeled cell in the original intervillus/villus region of induction got shifted away from the intervillus by an event of villi fission between E16.5 and E17.5).
Extended Data Figure 6
Extended Data Figure 6. Clone size distributions based on simulation using the cell repositioning model.
a) Normalized total number of intestinal villi in time (purple, same as Extended Data Figure 4a) vs. fitted trend for the villi formation rate (green line), which we use in the numerical simulations. Samples from 3 animals were analyzed per time point. Error bars represent the mean±S.E.M. b) Cumulative distribution of clone sizes (induced at E16.5) at P0 in the Lgr5 (red) compared to the Krt19 (blue) tracing also depicted in Figure 2d. c) Cumulative distribution of clone sizes (induced at E16.5) at P5 in the Lgr5 (red) compared to the Krt19 (blue) tracing also depicted in Figure 2d. d) Comparison between experimental (dots) and theoretical cumulative distribution of Lgr5 clone sizes (induced at E16.5), at P0 (purple), P5 (red) and P11 (cyan). e) Comparison between experimental (dots) and theoretical cumulative distribution of Krt19 clone sizes (induced at E16.5), at P0 (purple), P5 (red) and P11 (cyan). For all panels, clone size was inferred from clonal volume (Supplementary Table 2), using average single-cell measurements volume as a conversion factor.
Extended Data Figure 7
Extended Data Figure 7. Theoretical controls and sensitivity analysis.
a-c) Comparison between experimental data (dots and error bars) and theoretical predictions (thick lines) for the time evolution of the clonal rootedness (a), average clone size (b) and clonal persistence (c), both for the Krt19 (cyan) and the Lgr5 (green) tracings from E16.5. Here, the theoretical prediction corresponds to the case of villi fission, following exactly the same model in extended data Figure 6, but stopping at P1 instead of at P5. This shows that fetal fission is enough to explain the bulk of the equipotency between Lgr5 and Krt19 clones. d-f) Comparison between experimental data (dots and error bars) and theoretical predictions (thick lines) for the time evolution of the clonal rootedness (d), average clone size (e) and clonal persistence (f), both for the Krt19 (cyan) and the Lgr5 (green) tracings from E16.5. Here, the theoretical prediction corresponds to the case of no new villi formation occurring, showing a very poor fit for the clonal persistence and size to the data. g-i) Comparison between experimental data (dots and error bars) and theoretical predictions (thick lines) for the time evolution of the clonal rootedness (g), average clone size (h) and clonal persistence (i), both for the Krt19 (cyan) and the Lgr5 (green) tracings from E16.5. Here, the theoretical prediction corresponds to the case of villi fission occurring as in the model of Figure 3, but without shift of cells upon villi fission (see schematics of Extended Data Figure 5), showing a very poor fit for the clonal persistence to the data. j) Cartoon illustrating that current vilification model suggests that villi emerge from the intervillus region. k-m) Comparison between experimental data (dots and error bars) and theoretical predictions (thick lines) for the time evolution of the clonal rootedness (k), average clone size (l) and clonal persistence (m), both for the Krt19 (cyan) and the Lgr5 (green) tracings from E16.5. Here, the theoretical prediction corresponds to the case of villi formation occurring only from existing crypts, showing a very poor fit for the clonal persistence to the data. n) Single cell volume of villi cells and intervillus/crypts cells. Total E-Cadherin volume of villi and intervilli/crypts and subsequently divided by the number of DAPI positive nuclei to estimate the single cell volume. E16.5 villi n=8, E16.5 intervilli n=10, P0 villi n=6, P0 intervilli n=3, P5 villi n=11, P5 intervilli n=4, P11 villi n=4, P11 intervilli n=4, Adult villi n=7, Adult intervilli n=4 independent pictures were analyzed. o) Sensitivity analysis on the influence of differential Lgr5- and Lgr5+ cellular volume on the model prediction (considering either that all cells have the same volume, continuous lines and panels a-n, or the differential volume measured at E16.5 in Supplementary theory note, dashed lines). For panels a-i,k-m, P0 n=3, P5 n=3, P11 n=3, Adult n=6 independent samples were analyzed for Lgr5, P0 n=1; P5 n=3, P11 n=6, Adult n=3 independent samples for Krt19. Error bars indicate the mean±S.E.M.
Extended Data Figure 8
Extended Data Figure 8. Postnatal lineage tracing
a) Detection of E-Cadherin (Cyan) and clones (Red) induced at P0 either randomly (Krt19CreERT) or in the intervillus region (Lgr5-eGFP-ires-CreERT2). Samples from 3 animals were analyzed per time point and representative images are shown. b) Relative volume of clones (projected) induced either randomly (Krt19CreERT) or in the intervillus region (Lgr5-eGFP-ires-CreERT2) as assessed by quantitative clonal analysis following induction at P0. Samples from 3 animals were analyzed per time point and dots represent individual samples and lines indicate the mean±S.E.M. c) Theoretical labelled cell fraction of the Lgr5 clones induced at P0, using the same model dynamics as the E16.5 induction. Expansion of the Lgr5 clones is represented by the thick red line, normalized by the Krt19 tracing (blue, indicative of global tissue growth), and normalized by its P5 value. This displays a net two-fold increase between P5 and P11, consistent with the results of the experimental P0 tracing.
Extended Data Figure 9
Extended Data Figure 9. The contribution of Krt20 expressing cells during development and homeostasis.
a) Detection of Keratin 20 (Krt20, magenta), Lysozyme1 (Lyz1, red) and GFP (Lgr5-DTR-eGFP) in adult mouse intestine. Tissue is counterstained with DAPI (cyan). Representative picture of n=3 biologically independent samples is shown. b) Detection of E-cadherin (E-cad, cyan), GFP (green) and RFP (red) in tissue whole mounts from the proximal part of the small intestine isolated from Rosa26-lsl-Confetti/Krt20-T2A-CreERT2 animals at 3- and 40-days post label induction with 4-hydroxytamoxifen. Samples from 3 animals were analyzed per time point and representative images are shown. c) In situ hybridization of Lgr5 (Green) and Cre (Red) at E16.5 in proximal E16.5 small intestine. Tissue is counterstained with DAPI (cyan). Samples from 3 animals were analyzed per time point and representative images are shown. d) Detection of E-cadherin (E-cad, cyan) and tdTomato (red) in tissue whole mounts from the proximal part of the small intestine isolated from Rosa26-lsl-tdTomato/Krt20-T2A-CreERT2 animals at E18.5 and adulthood following administration of 4-hydroxytamoxifen at E16.5. Representative pictures of n=2 samples are shown.
Extended Data Figure 10
Extended Data Figure 10. Testing intestinal epithelial cells for equipotency.
a) Detection of Lgr5-eGFP (green) and CD44 (red) in the E16.5 small intestine isolated from Lgr5-eGFP-ires-CreERT2 E16.5 animals. Tissue was counterstained with DAPI (blue). Samples from 3 animals were analyzed and a representative image is shown Scale bars: 50μm. b) Cartoon depicting the positions used to quantify the pattern of CD44 and Lgr5 expression. Quantifications of the localization of CD44 and Lgr5 positive cells. A total of 14 intervillus regions (x-axis) were quantified up to position +/- 10 (y-axis). c-d) Representative FACS dot plot illustrating the gating strategy used to quantify CD44. Dots represent the quantification in individual animals (n=4). e) Spheroids forming from cells isolated based on DAPInegEpCAMposLgr5-eGFPpos and DAPInegEpCAMposLgr5-eGFPneg from the proximal half of the small intestine from mice at E16.5. Representative pictures of n=3 biologically independent samples. f) Quantification of spheroid seeding efficiency following isolation based on either CD44 or Lgr5 (n=3 animals per condition). g-i) Gating strategy for purification of villus and intervillus cells for transplantation. The gating hierarchy of the panels is number i-vi (g), example of purity is indicated (h), mT/mG derived organoid is shown in (i). Spheroids were generated from a pool of n=6 biologically independent samples. j-k) Outline for transplantation experiment. Briefly, experimental colitis was induced in RAG2-/- animals by administration of DSS in the drinking water. Organoids from the different cultures were subsequently infused into lumen of the animals (j) and engrafted regions were immunostained for lineage and stem cell markers depicted (k). l) Scheme summarizing the main findings of this work.
Figure 1
Figure 1. Fetal Lgr5 progeny contribute to the adult intestinal epithelium, but are insufficient to sustain intestinal growth during development.
a) Detection of Lgr5-eGFP (green) and DAPI (blue) at the indicated time points. Scale bars: 100μm. Representative pictures of n=3 biologically independent samples at each time point are shown. b) Detection of E-cadherin (E-cad, cyan), GFP (green) and RFP (red) in tissue whole mounts from the proximal part of the small intestine isolated from Rosa26-lsl-Confetti/Lgr5-eGFP-ires-CreERT2 animals at P0 (n=3 animals), P5 (n=3 animals), P11 (n=3 animals) and adulthood (n=6 animals) following induction at E16.5 by the administration of 4-hydroxytamoxifen. White arrowheads indicate the clones depicted in the white dashed boxes at higher magnifications. Scale bars: 250 μm. c) Relative volume (projected) of clones from (b) and epithelium based on E-Cadherin (Animals analysed: P0 n=9, P5 n=9, P11 n=9, Adult n=9). Dots and lines indicate independent samples and mean±S.E.M, respectively. d-e) Model based on Lgr5 cells driven morphogenesis and assessment of the observed and predicted clonal expansion (Experiment clones Lgr5, P5 n=3, Adult n=6; Tissue, P5 n=9, Adult n=9). Error bars indicate the mean±S.E.M.
Figure 2
Figure 2. Random distribution of intestinal stem cell precursors in the fetal epithelium
a) Detection of E-cadherin (E-cad, cyan), GFP (green) and RFP (red) in tissue whole mounts from the proximal part of the small intestine isolated from Rosa26-lsl-Confetti/Krt19CreERT animals at P0 (n=1 animal), P5 (n=3 animals), P11 (n=6 animals) and adulthood (n=3 animals) following induction at E16.5 by the administration of 4-hydroxytamoxifen. White arrowheads indicate the clones depicted in the white dashed boxes at higher magnifications. Scale bars: 250 μm. b) Relative volume (projected) of clones from the Krt19CreERT induction (from a). Each dot represents one animal and the line the mean. c) Relative number of clones (Projected persistence). Each dot represents an independent biological sample at the indicated time point (from 1b and 2a). Lines indicate the mean±S.E.M. d) Volume (μm3) of individual clones (Krt19-CreERT: P0 n=94, P5 n=244, P11 n=103, P36-Adult n=42; Lgr5-eGFP-ires-CreERT2: P0 n=28, P5 n=39, P11 n=15, Adult n= 18). Lines indicate the mean. e) Model based on morphogenesis relying on equipotent stem cells randomly distributed in the tissue. f) Assessment of the observed and predicted clonal expansion (Experiment clones Krt19, P5 n=3, Adult n=3; Experiment clones Lgr5, P5 n=3, Adult n=6; Tissue P5 n=9, Adult n=9). Error bars indicate the mean±S.E.M.
Figure 3
Figure 3. Villi fission is required to explain epithelial expansion
a) Detection of E-cadherin (red) and PDGFRA (yellow) in intestinal whole-mount during villi formation. A representative picture at E16.5 (n=3 animals). Arrowheads indicate villi with shared mesenchyme. Scale bar: 250 μm. b) Detection of EdU (green top), PDGFRA (yellow, bottom) and E-cadherin (red) in intestinal whole mounts following a 1-hour EdU pulse at E16.5. Arrowhead indicate proliferative cells at the edge of putative branching villus (n=3 animals). Scale bar: 100 μm. c) Pictures showing the start and end-points from live-imaging of a villus undergoing fission (red star) (Supplementary Video 5). White circles are reference villi. Three animals analysed. Scale bar: 50μm. d) Model for cell repositioning based on villi emerging from the intervillus regions or through villus fission. Clones from villi can hereby recolonize the intervillus region and vice versa. e-g) Simulation of the clonal dynamics (Lgr5- and Krt19 derived) using the cell repositioning model to predict the fraction of clones rooted in the intervillus region called rootedness (e), clonal persistence (Experimentally obtained data is also shown in Figure 2c) (f) and mean clone size (g). (Lgr5 data: P0 n=3, P5 n=3, P11 n=3, P36-Adult n=6 analyzed animals; Krt19 data: P0 n=1; P5 n=3, P11 n=6, Adult n=3 analyzed animals). Error bars indicate the mean±S.E.M. h) Detection of Keratin 20 (Krt20, magenta), GFP (Lgr5-DTR-eGFP) and DAPI (cyan) at E16.5 in proximal small intestine. A representative picture of n=3 independent biological samples is shown. i) Detection of E-cadherin (E-cad, cyan), GFP (green) and RFP (red) in tissue whole mounts from the proximal part of the small intestine isolated from Rosa26-lsl-Confetti/Krt20Cre-T2A-CreERT2 animals at P5 (n=4 animals), P11 (n=3 animals), and Adulthood (n=5 animals) following induction at E16.5 by the administration of 4-hydroxytamoxifen. White arrowheads indicate the clones depicted in the white dashed boxes at higher magnifications. j-l) Simulation of the clonal dynamics (Krt20-derived) using the cell repositioning model to predict the fraction of clones with a rooted in the intervillus region (j), clonal persistence (Experimentally obtained data is also shown in Figure 2g) (k) and mean clone size (l). Lgr5 data P0 n=3, P5 n=3, P11 n=3, Adult n=6 animals analyzed and Krt20 data, P0 n=3, P5 n=4, P11 n=3, Adult n=5 animals analyzed. Line and error bars indicate the mean±S.E.M.
Figure 4
Figure 4. Villus and intervillus cells are equipotent and have the same regenerative potential.
a) Formation of spheroids from epithelial cells isolated based on DAPInegEpCAMposCD44pos and DAPInegEpCAMposCD44neg from the proximal half of the small intestine from mice at E16.5. A representative picture of n=3 independent samples is shown. b) Spheroids following treatment with Wnt3a. A representative picture of n=3 independent samples is shown. c) Formation of spheroids from epithelial cells isolated based on DAPInegCD44pos and DAPInegCD44neg from the proximal half of the human fetal small intestine (8 weeks of gestation). A representative picture of n=2 independent samples is shown. d) Engraftment of spheroids derived from DAPInegEpCAMposCD44pos and DAPInegEpCAMposCD44neg obtained from E16.5 mT/mG animals. Four out of six mice were engrafted with CD44neg-derived cells and five out of five in CD44pos-derived cells. Scale bars: 10mm. A representative picture of independent engraftments is shown (CD44neg n=4; CD44pos n=5) e) Detection of CD44v6, Lyz1, Muc2 and ALPI in serial section of the engrafted patches (red). Scale bars: 50μm. A representative picture of independent engraftments is shown (CD44neg n=4; CD44pos n=5)

Comment in

References

    1. Clevers H. The intestinal crypt, a prototype stem cell compartment. Cell. 2013;154:274–284. doi: 10.1016/j.cell.2013.07.004. - DOI - PubMed
    1. Barker N, et al. Identification of stem cells in small intestine and colon by marker gene Lgr5. Nature. 2007;449:1003–1007. - PubMed
    1. Shyer AE, Huycke TR, Lee C, Mahadevan L, Tabin CJ. Bending gradients: how the intestinal stem cell gets its home. Cell. 2015;161:569–580. doi: 10.1016/j.cell.2015.03.041. - DOI - PMC - PubMed
    1. Nigmatullina L, et al. Id2 controls specification of Lgr5+ intestinal stem cell progenitors during gut development. The EMBO journal. 2017;36:869–885. doi: 10.15252/embj.201694959. - DOI - PMC - PubMed
    1. Tetteh PW, et al. Replacement of Lost Lgr5-Positive Stem Cells through Plasticity of Their Enterocyte-Lineage Daughters. Cell stem cell. 2016;18:203–213. doi: 10.1016/j.stem.2016.01.001. - DOI - PubMed

Publication types

Substances