. 2019 Jun;570(7761):380-384.
doi: 10.1038/s41586-019-1213-4. Epub 2019 May 15.

Mitochondrial fragmentation drives selective removal of deleterious mtDNA in the germline

Affiliations

Mitochondrial fragmentation drives selective removal of deleterious mtDNA in the germline

Toby Lieber et al. Nature. 2019 Jun.

Abstract

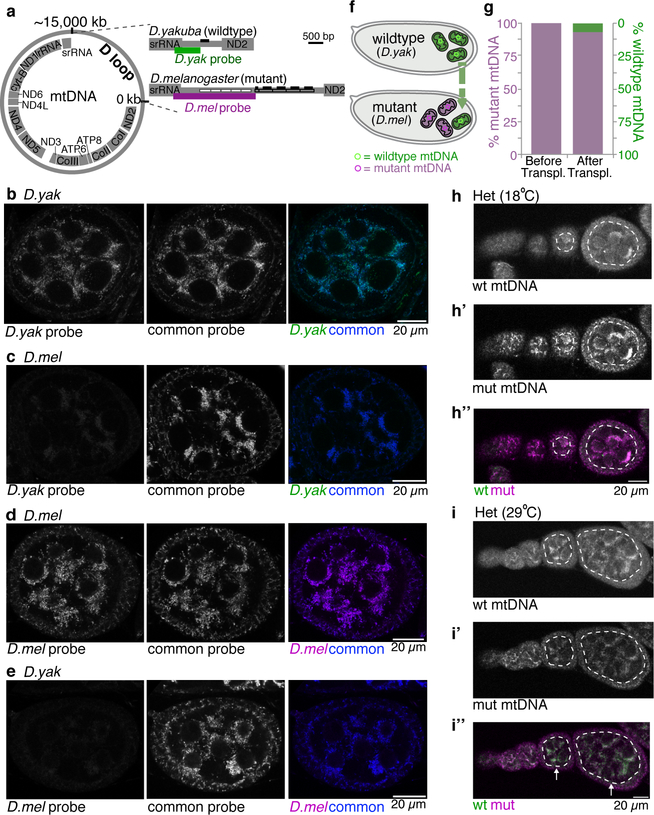
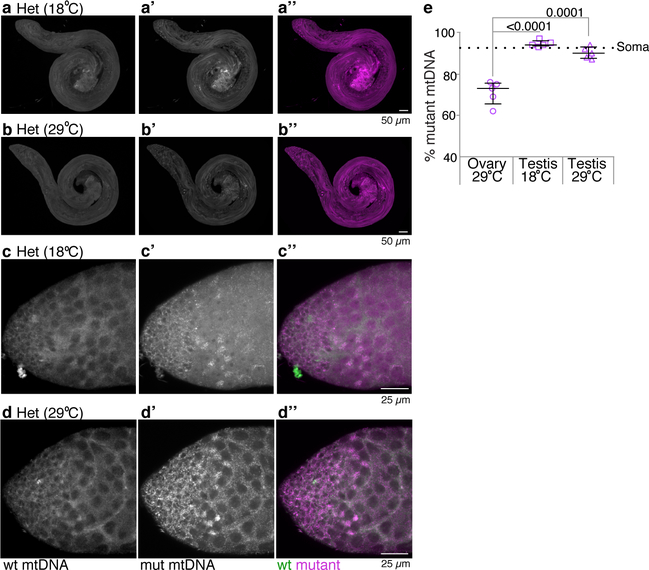
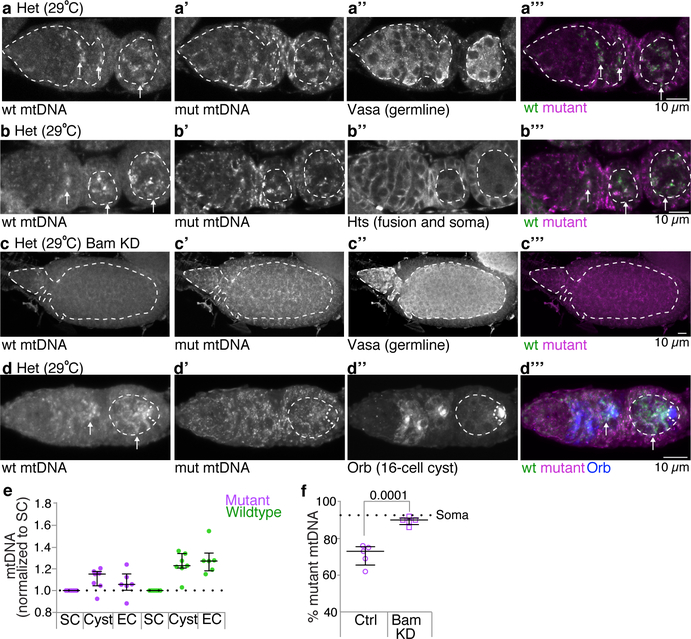
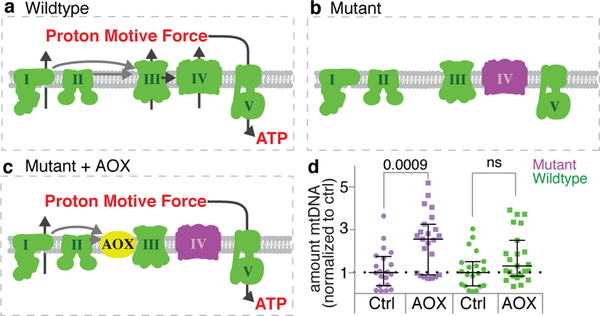
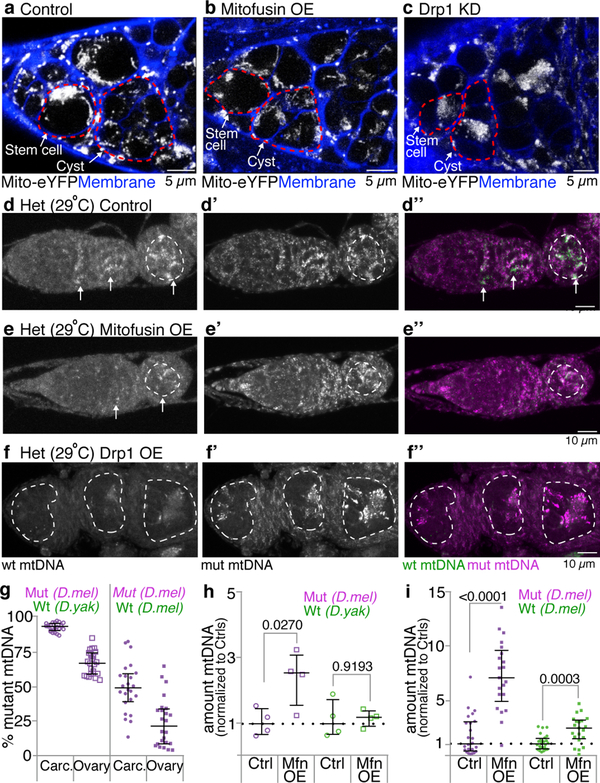
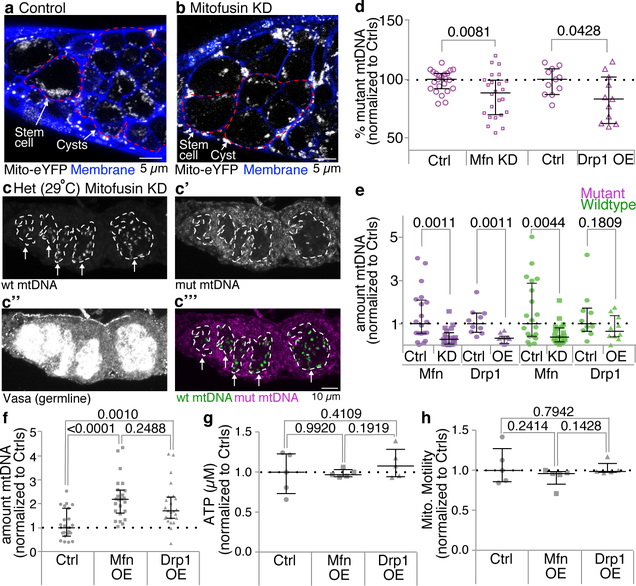
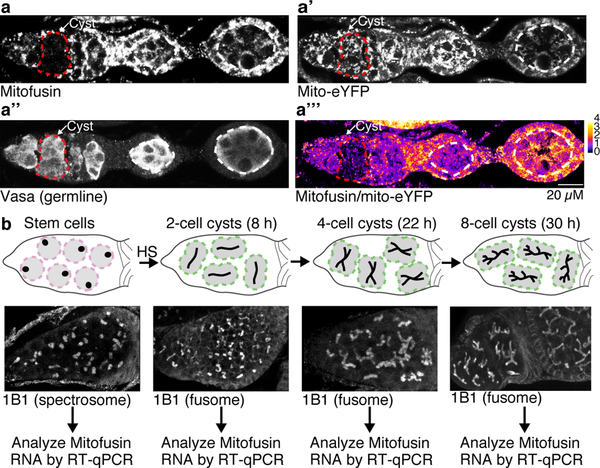
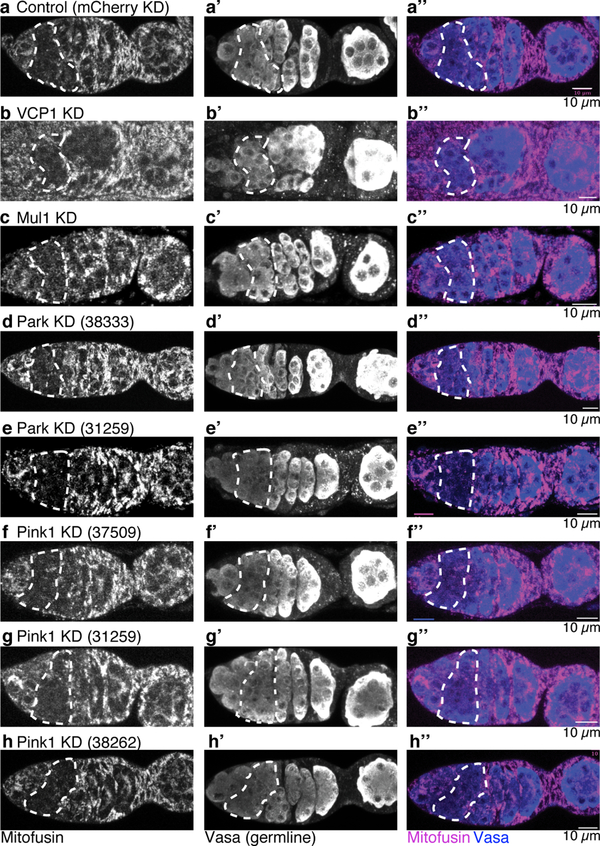
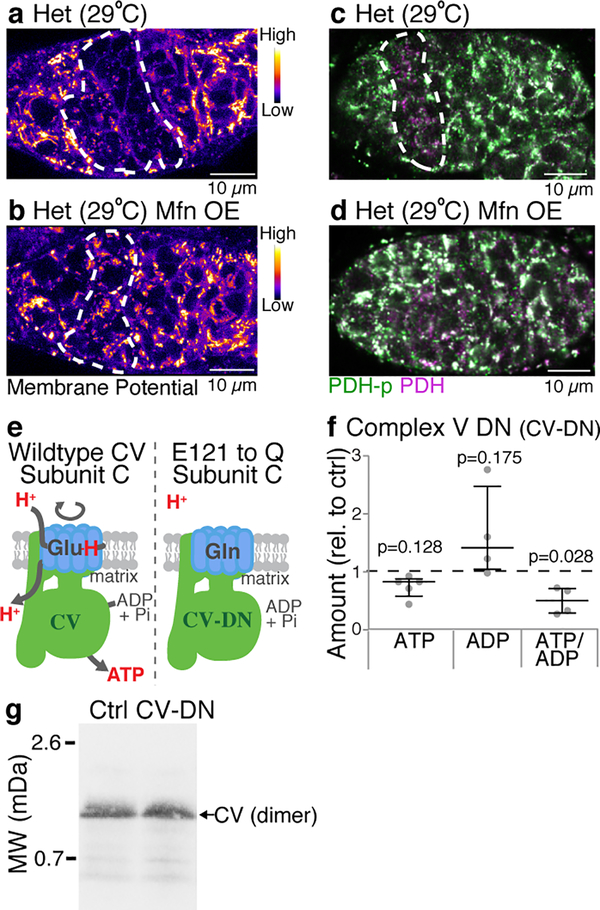
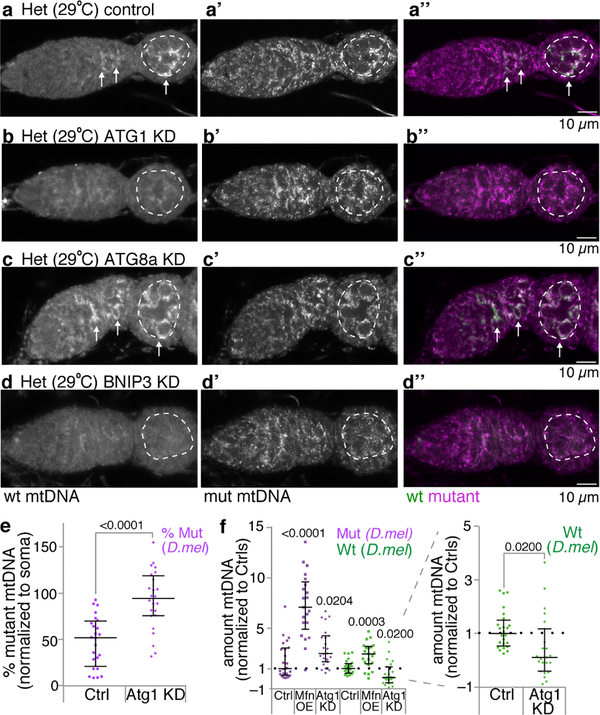
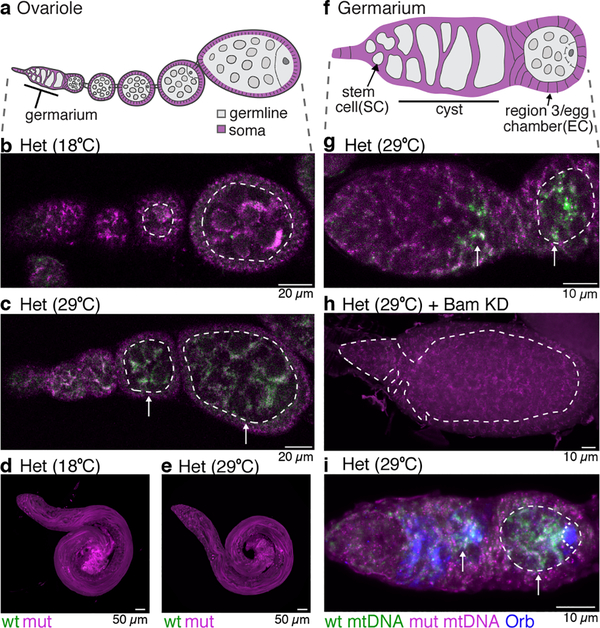
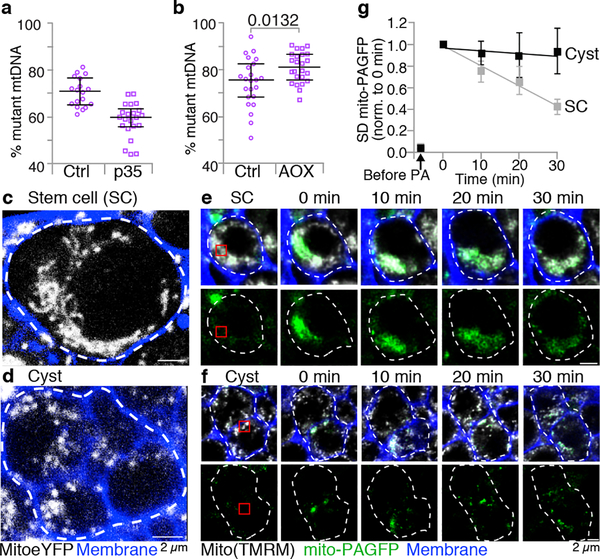
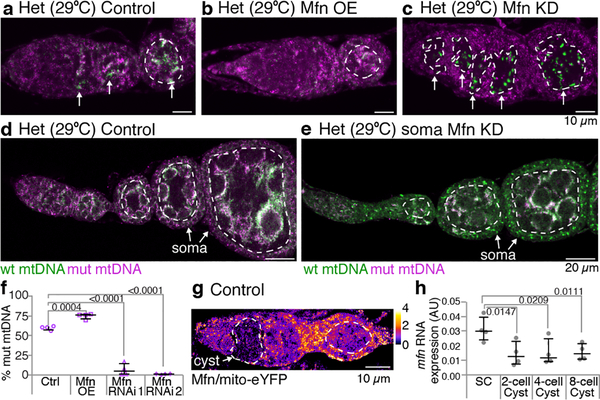
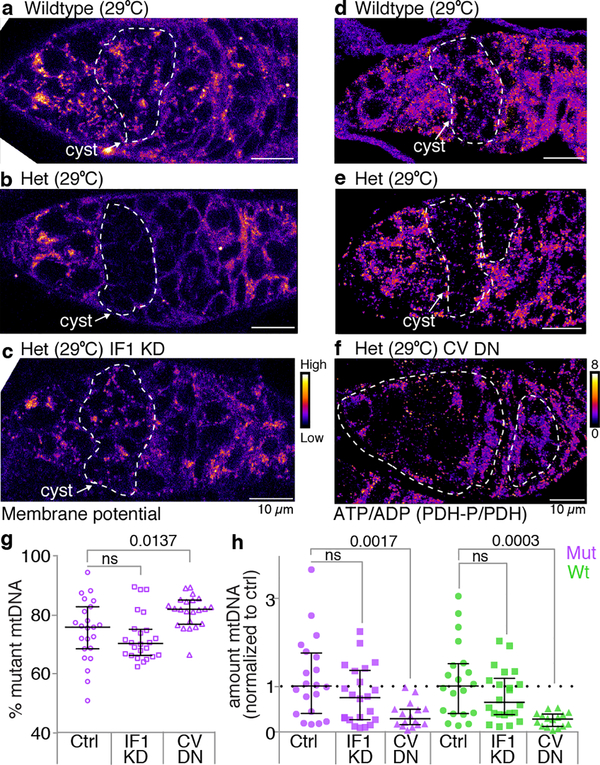
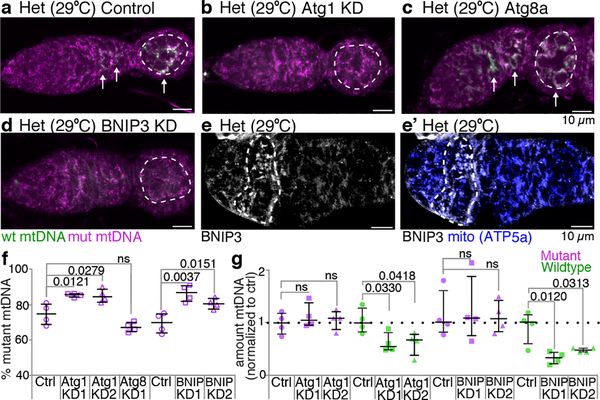
Mitochondria contain their own genomes that, unlike nuclear genomes, are inherited only in the maternal line. Owing to a high mutation rate and low levels of recombination of mitrochondrial DNA (mtDNA), special selection mechanisms exist in the female germline to prevent the accumulation of deleterious mutations1-5. However, the molecular mechanisms that underpin selection are poorly understood6. Here we visualize germline selection in Drosophila using an allele-specific fluorescent in situ-hybridization approach to distinguish wild-type from mutant mtDNA. Selection first manifests in the early stages of Drosophila oogenesis, triggered by reduction of the pro-fusion protein Mitofusin. This leads to the physical separation of mitochondrial genomes into different mitochondrial fragments, which prevents the mixing of genomes and their products and thereby reduces complementation. Once fragmented, mitochondria that contain mutant genomes are less able to produce ATP, which marks them for selection through a process that requires the mitophagy proteins Atg1 and BNIP3. A reduction in Atg1 or BNIP3 decreases the amount of wild-type mtDNA, which suggests a link between mitochondrial turnover and mtDNA replication. Fragmentation is not only necessary for selection in germline tissues, but is also sufficient to induce selection in somatic tissues in which selection is normally absent. We postulate that there is a generalizable mechanism for selection against deleterious mtDNA mutations, which may enable the development of strategies for the treatment of mtDNA disorders.


Figures

Extended Data Figure 1.
Extended Data Figure 1.. FISH probes are specific for either D. yakuba or D. melanogaster mitochondrial DNA.
a. Schematics of the mitochondrial genome and the D loops of D. yakuba and D. melanogaster. In the schematic of the D loop of D. melanogaster the boxed regions denote 2 classes of repeated sequences. The open boxes are unique to D. melanogaster. The hatched boxes contain a 300 bp sequence, that is conserved in other Drosophilids and is depicted by solid bars above the repeats in D. melanogaster and by a single solid bar above the D. yakuba D loop. The FISH probes are directed against unique regions of the D loops; the D. yakuba specific probe is depicted as a green bar and the D. melanogaster specific probe is depicted as a magenta bar beneath the respective D loops. b-e. Confocal images of D. yakuba (b,e) and D. melanogaster (c,d) stage 7 egg chambers hybridized with D. yakuba specific probes (green; b,c) and D. melanogaster specific probes (magenta; d,e). All egg chambers were also hybridized with probes recognizing mtDNA of both species (middle panels; blue). The merged images are in the right panels. The D. yakuba probe hybridizes to D. yakuba mtDNA (b) but not D. melanogaster mtDNA (c). The D. melanogaster probe hybridizes to D. melanogaster mtDNA (d) but not D. yakuba mtDNA (e). f. Schematic illustrating the generation of heteroplasmic flies by the transfer of germ plasm that contains wildtype mitochondria (green) from Drosophila yakuba (D. yak) into Drosophila melanogaster (D. mel) embryos that are homoplasmic for mt:CoIts + mt:nd2del1 mutant mitochondria (magenta). g. Bar plots showing percentage of mutant and wildtype mtDNA, as assayed by qPCR, in adult female carcasses without ovaries from the original mutant D. melanogaster strain and the heteroplasmic line generated by pole plasm transplantation. The data are an average of 4 independent replicates. h-h” and i-i”. Ovarioles of flies heteroplasmic (Het) for D. melanogaster mt:Co1ts (mut) and D. yakuba (wt) genomes that were shifted to 18°C (permissive temperature) for 10 days or maintained at 29°C (restrictive temperature) hybridized with fluorescent probes that detect either wt D. yakuba (green) or mutant D. melanogaster (magenta) genomes. Selection against the mutant genome is observed in the germline when flies were raised at 29°C. Here and in all Extended Data figures the gray scale images are non-background subtracted and unnormalized.
Extended Data Figure 2.
Extended Data Figure 2.. Selection against mutant mitochondrial DNA does not occur in the male germline.
Testes of heteroplasmic (Het) flies that were shifted to 18°C for 7 days (a and c) or maintained at 29°C (b and d) hybridized with fluorescent probes that detect either wt D. yakuba (green) or mutant D. melanogaster (magenta) genomes. The higher magnification images in c and d include the stem cells and spermatogonial cysts. Selection against mutant mtDNA is not observed in testes of flies raised at the restrictive temperature (29°C). e. Scatter plots showing percentage of mutant mtDNA, as assayed by qPCR, of adult ovaries and testes of heteroplasmic flies raised at 29°C, and of adult testes of heteroplasmic flies shifted to 18°C for 7 days. The mtDNA qPCR data throughout are presented as medians with interquartile range and compared by two-tailed unpaired t-tests. In Supplementary Table 2 for all data sets we also present 95% confidence intervals of the difference between the control and experimental means and the number of biologically independent samples used to derive the statistics. The dashed line denotes the % mutant mtDNA in whole adult female carcasses lacking ovaries. All testes are oriented with stem cell niche toward left.
Extended Data Figure 3.
Extended Data Figure 3.. Selection manifests in germline cyst cells and does not occur when cyst formation is blocked.
Germaria of heteroplasmic females (Het), raised at 29°C, were hybridized with fluorescent probes that detect either wt D. yakuba or mutant D. melanogaster mtDNA, and reacted with anti-Vasa antisera to mark the germline (a-a”’) or anti-Hts (1B1) antisera to mark the fusome and somatic cells (b-b”’). The dashed outlines delineate the germline in a, individual, developing cysts in the germarium, and egg chambers each surrounded by somatic follicle cells in b. wt mtDNA (arrows) can first be strongly detected in cysts. c-c”’. A germarium of a heteroplasmic fly (Het), raised at 29°C, in which cyst formation was blocked by expression of an RNAi against bag-of-marbles (Bam; UAS.bam shRNA TRiP.HMJ22155) in the germline under the control of nos-GAL4. The germarium was hybridized with fluorescent probes directed against wt (c and c”’) and mutant mtDNAs (c’ and c”’) and reacted with anti-Vasa antisera to mark the germline (c”). No increase in wt mtDNA is observed. d-d”’. A germarium of a heteroplasmic fly, raised at 29°C, hybridized with fluorescent probes that detect either wt D. yakuba mtDNA (d and d”’) or mutant D. melanogaster mtDNA (d’ and d”’), and reacted with anti-Orb antisera (d”, blue in d”’) to demarcate all cells of the developing cysts and the oocyte in later egg chambers. Arrows in d and d”’ point to wt mtDNA, and dashed outlines delineate cysts in the germarium and germline in the egg chambers. e. Scatter plots showing the relative amounts of wt D. yakuba and mutant D. melanogaster mtDNA, as assayed by FISH, in cysts and egg chambers (EC) compared to the amount in stem cells (SC). f. Scatter plot showing percentage of mutant mtDNA, as assayed by qPCR, of control (Ctrl; nos-GAL4 driving UAS.mCherry RNAi) heteroplasmic ovaries and of heteroplasmic ovaries in which cyst formation was blocked by the knock down of Bam (Bam KD). Here and in all images below, ovarioles are oriented with stem cell niche towards left.
Extended Data Figure 4.
Extended Data Figure 4.. Expression of the Ciona intestinalis Alternative Oxidase (AOX) rescues mutant mitochondria.
a. In wildtype mitochondria the electron transport chain complexes (I-IV) that reside in the inner mitochondrial membrane couple the transfer of electrons with the transfer of protons across the membrane. The resulting proton motive force drives the synthesis of ATP by complex V. b. At the restrictive temperature the CoIts mutation blocks the transfer of electrons through complex IV (cytochrome oxidase, purple) resulting in the absence of both the generation of a proton motive force and ATP production. c. AOX (yellow) catalyzes the transfer of electrons from ubiquinone to molecular oxygen bypassing complexes III and IV. This restores the transfer of protons at complex I and the generation of ATP. d. Scatter plot of the amount of mutant D. melanogaster (purple) and wildtype D. yakuba (green) mtDNA, as assayed by qPCR, in ovaries expressing AOX under control of nos-GAL4 normalized to the amount of mutant and wildtype mtDNA in control ovaries (Ctrl) expressing cherry RNAi. Expression of AOX rescues the mutant genomes.
Extended Data Figure 5.
Extended Data Figure 5.. Mitochondrial fragmentation is necessary for germline mitochondrial DNA selection.
a-c. Stills of live images illustrating the effect that overexpressing Mitofusin (b) or knocking down Drp1 (c) in the germline has on the morphology of mitochondria compared to controls (a, nos-GAL4 driving UAS mCherry RNAi; the stills in Fig 2c,d are higher magnifications of this image.) When Mitofusin is overexpressed (nos-GAL4 driving UAS.marf), or when Drp1 is knocked down (nos-GAL4 driving UAS-Drp1.miRNA.CDS), the mitochondria in the cysts are no longer discrete as they are in control cysts. The mitochondria (white) were labeled with a mitochondrially targeted eYFP and cell membranes (blue) with CellMask™ Deep Red Plasma membrane Stain. Stem cells and cysts are outlined in red. d-d”. Germarium of a control heteroplasmic female (nos-GAL4 driving UAS.mCherry RNAi), raised at 29°C, hybridized with fluorescent probes that detect either wt D. yakuba mtDNA (greyscale in d; green in d”) or mutant D. melanogaster mtDNA (greyscale in d’; magenta in d”). Selection for wt mtDNA is observed as indicated by the arrows in d and d”. e and f. Selection for wt mtDNA is no longer observed when Mitofusin (Mfn) is overexpressed (nos-GAL4 driving UAS.marf) or when Drp1 is knocked down (nos-GAL4 driving UAS-Drp1.miRNA.CDS). wt D. yakuba mtDNA: greyscale in e,f green in e”,f”; mutant D. melanogaster mtDNA: greyscale in e’,f’ magenta in e”,f”. The dashed outlines delineate the germline g. Scatter plot showing the percentage of mutant D. melanogaster mtDNA, as assayed by qPCR, in carcasses (carc.) and ovaries of heteroplasmic flies in which the wildtype mtDNA was either from D. yakuba or D. melanogaster. mCherry RNAi was expressed in the ovaries under control of nos-GAL4. h. Scatter plot of the amount of mutant D. melanogaster (purple) and wildtype D. yakuba (green) mtDNA, as assayed by qPCR, of young embryos laid by heteroplasmic females in which Mitofusin was overexpressed in the germline (Mfn OE) normalized to the amount of mutant and wildtype mtDNA in young embryos laid by control heteroplasmic females (Ctrl; nos-GAL4 driving UAS.mCherry RNAi). i. Same as g, except analysis was performed on ovaries in which both wildtype and mutant mtDNAs were from D. melanogaster. Mitofusin overexpression increases the levels of mutant mtDNA.
Extended Data Figure 6.
Extended Data Figure 6.. Mitochondrial fragmentation is sufficient for germline mitochondrial DNA selection.
a and b. Stills of live images illustrating the effect that knocking down Mitofusin in the germline (b) has on the morphology of mitochondria compared to controls (a). When Mitofusin is knocked down (nos-GAL4 driving UAS.mfn shRNA2 TRiP.HMC0388332) the mitochondria in the stem cells are fragmented. The mitochondria (white) were labeled with a mitochondrially targeted eYFP and cell membranes (blue) with CellMask™ Deep Red Plasma membrane Stain. Stem cells and cysts are outlined in red. c. The knockdown of Mitofusin in the germline by expressing Mitofusin RNAi (nos-GAL4 driving UAS.mfn shRNA2 TRiP.HMC03883) results in selection for wt mtDNA (green) occurring in stem cells. The germarium was also reacted with anti-Vasa antiserum (c”) to mark the germline and delineate the stem cells and cysts. wt D. yakuba mtDNA: greyscale in c, green in c”; mutant D. melanogaster mtDNA: greyscale in c’, magenta in c”’. Mutant mtDNA is readily detected in the soma but not in the germline. d. Scatter plot comparing the percentage of mutant mtDNA, as assayed by qPCR, of ovaries in which Mitofusin was weakly knocked down in the germline (Mfn KD; nos-GAL4 driving UAS.mfn long hairpin RNA1 TRiP.JF01650) and of ovaries in which Drp1 was overexpressed in the germline (Drp1 OE; nos-GAL4 driving UAS-Drp1.miRNA.CDS). The percent of mutant mtDNA in each case was normalized to the percent mutant mtDNA in control ovaries to illustrate that overexpressing Drp1 enhances selection to a similar extent as does weakly knocking down Mitofusin. e. Scatter plot of the amount of mutant D. melanogaster (purple) and wildtype D. yakuba (green) mtDNA, as assayed by qPCR, in ovaries in which Mitofusin was weakly knocked down or in which Drp1 was overexpressed in the germline normalized to the amount of mutant and wildtype mtDNA in control ovaries (Ctrl) expressing cherry RNAi in the germline. Knocking down Mitofusin or overexpressing Drp1 results in a decrease in mutant mtDNA. f-h. The effect of germ line overexpression of Mitofusin (Mfn) and Drp1 on copy number (f), ATP levels (g), and mitochondrial motility (h) in homoplasmic wildtype D. melanogaster ovaries (also see Supplementary Note 1). f. Scatter plot of the amount of mtDNA, as assayed by qPCR, in homoplasmic ovaries in which Mfn or Drp1 were overexpressed in the germ line, normalized to the amount of mtDNA in control ovaries (Ctrl; nos-GAL4 driving UAS.mCherry RNAi). g. Scatter plot of the amount of ATP in homoplasmic ovaries overexpressing Mfn or Drp1 in the germ line under control of Maternal α-Tubulin Gal4 normalized to the amount of ATP in control ovaries (Ctrl; Maternal α-Tubulin Gal4 driving UAS.mCherry RNAi). h. Scatter plot of mitochondrial motility in homoplasmic ovaries overexpressing Mfn or Drp1 in the germ line. Motility was assessed by measuring mean mitochondrial displacement using live confocal microscopy and Imaris analysis software.
Extended Data Figure 7.
Extended Data Figure 7.. Mitofusin is down-regulated in germline cysts.
a-a”’. A germarium of a female expressing HA-tagged Mitofusin (Mfn), under control of the Mitofusin promoter (Marf-gHA), and mitochondrially target eYFP (mito-eYFP), was reacted with anti-HA antisera to detect Mitofusin (a), anti-GFP antisera to detect mitochondria (a’) and anti-Vasa antisera to delineate the germline (a”). In a”’ the ratio of the levels of Mitofusin to mito-eYFP is presented in pseudocolor. The colors correspond to the ratios indicated on the pseudocolor bar. The dashed red circles outline the cysts and the dashed white circles demarcate the germline in the egg chambers. b. Scheme for quantifying the levels of mitofusin RNA at different time points during early oogenesis. Females mutant for the differentiation factor Bam, which is required for cyst formation, and carrying a rescuing transgene expressing Bam under control of a heat shock promoter were heat shocked at 37°C for 2 hrs, and then allowed to recover for the indicated times. This allows for the isolation of ovaries that contain staged cysts, predominantly at 2, 4 or 8 cell cyst stage. The morphology of the spectrosome and fusome as revealed by staining with anti-Hts (1B1) antisera was used to confirm the staging. RNA for RT-qPCR was isolated from ovaries from flies prior to heat shock and at the indicated times following heat shock.
Extended Data Figure 8.
Extended Data Figure 8.. The down-regulation of Mitofusin in cysts is not mediated by known regulators of Mitofusin protein.
Germaria of females expressing HA-tagged Mitofusin (Mfn), under control of the Mitofusin promoter (Marf-gHA) reacted with anti-HA antisera to detect Mitofusin (grayscale in a-h, magenta in a”-h”) and anti-Vasa antibody to delineate the germline (grayscale in a’-h’, blue in a”-h”). The indicated known regulators of Mitofusin protein levels were knocked down in the germline using RNAi under control of nos-GAL4. The numbers in parentheses are BDSC stock numbers. All ovarioles are oriented with stem cell niche towards left.
Extended Data Figure 9.
Extended Data Figure 9.. Inhibiting mitochondrial fragmentation blocks the decrease in proton motive force and ATP levels in cysts of heteroplasmic flies.
a-d. Germaria of heteroplasmic control flies (a,c; w1118) and heteroplasmic flies in which Mitofusin was overexpressed in the germline (b,d; nos-GAL4 driving UAS.marf), reacted with TMRM to visualize mitochondrial membrane potential (pseudocolored in a,b) or with antibodies to phosphorylated pyruvate dehydrogenase (PDH P, purple) and pyruvate dehydrogenase (PDH, green) to measure ATP levels (c,d). e. Diagram showing the essential glutamate at position 121 in c-ring subunits that acts as the proton donor and acceptor in the proton translocation pathway. In the dominant negative c-ring (CV-DN) this glutamate was mutated to a glutamine, which can no longer bind the protons. f. Scatter plot illustrating the reduction in ATP/ADP ratio in embryos laid by mothers expressing CV-DN in the germ line under control of Maternal α-Tubulin Gal4. The ratios were measured using an ADP/ATP Ratio Assay Kit (Abcam ab65313). Data were analyzed using paired t tests. g. Blue Native Polyacrylamide Gel illustrating that expression of the dominant negative inhibitor of complex V (CV-DN) does not disrupt the Complex V dimer. For gel source data, see Supplementary Figure 1.
Extended Data Figure 10.
Extended Data Figure 10.. The mitophagy proteins Atg1 and BNIP3 are necessary for germline mitochondrial DNA selection.
Germaria of a control heteroplasmic female (a-a”; nos-GAL4 driving UAS.mCherry RNAi) and of heteroplasmic females in which Atg1 (b-b”), Atg8 (c-c”) or BNIP3 (d-d”) were knocked down in the germ line, raised at 29°C, hybridized with fluorescent probes that detect either wt D. yakuba mtDNA (greyscale in a-d, green in a”-d”) or mutant D. melanogaster mtDNA (greyscale in a’-d’, magenta in a”-d”). The dashed circles demarcate the germline in the early egg chambers. The arrows point to wildtype mtDNA. e and f. Scatter plots showing percentage of mutant mtDNA and the amount of mutant (magenta) and wildtype (green) mtDNA, as assayed by qPCR, of control heteroplasmic ovaries (Ctrl) and of ovaries in which Atg1was knocked down in the germline (Atg1 KD). In the left panel in f the amount of mutant and wildtype mtDNA of heteroplasmic ovaries overexpressing Mitofusin (Mfn OE) is plotted to illustrate that overexpressing Mitofusin primarily inhibits selection by increasing the amount of mutant mtDNA while knocking down Atg1 primarily inhibits selection by decreasing the amount of wildtype mtDNA. The control and Mitofusin overexpression data is the same as that presented in Extended Data Fig. 5h. All the dissections and analyses were carried out at the same time. The right panel of f is a zoomed in view to illustrate the affect knocking down Atg1 has on the level of wildtype mtDNA. In e and f both wildtype and mutant mtDNAs were from D. melanogaster.
Figure 1.
Figure 1.. Purifying mtDNA selection is a female germline specific that manifests during cyst differentiation.
a. Schematic of ovariole: germarium at tip followed by egg chambers surrounded by somatic follicle cells. b and c. Ovarioles of flies heteroplasmic (Het) for D. melanogaster mt:Co1ts (mut) and D. yakuba (wt) genomes hybridized with fluorescent probes that detect either wt or mutant genomes. Selection against the mutant genome is observed in the germline at the restrictive (29°C) but not permissive (18°C) temperature. (See Extended Data Figs. 1h–i.) d and e. mtDNA FISH of Het testes. No selection against mutant genomes is observed at either 29°C or 18°C (See Extended Data Fig. 2.) f. Schematic of germarium: germline stem cells (SC) renew and produce cysts that mature into egg chambers (EC). g. mtDNA FISH of Het germarium at restrictive temperature. Arrows point to wt mtDNA, which is first strongly detected in cyst cells. (See Extended Data Fig. 3a,b,e.) h. Het germarium, expressing bam RNAi, arrested prior to cyst formation. No increase in wt mtDNA is observed. (See Extended Data Fig. 3c.) i. mtDNA FISH of Het germarium co-reacted with anti-Orb antisera to mark cysts and oocytes. (See Extended Data Fig. 3d.) b, c, g, h, and i. The dashed lines marks the boundary between somatic and germline cells. All images, here and below, are oriented with stem cells towards left.
Figure 2.
Figure 2.. Germline cyst mitochondria undergo fragmentation.
a and b. Percent mutant mtDNA, as assayed by qPCR, of heteroplasmic ovaries with cell death blocked in the germline by expression of p35 (a), or with the function of the mutant Complex IV bypassed by expression of the Ciona intestinalis Alternative Oxidase (AOX) (b; see Extended Data Fig. 4.). The mtDNA qPCR data throughout are presented as medians with interquartile range and compared by two-tailed unpaired t tests. In Supplementary Table 2 for all data sets we also present 95% confidence intervals of the difference between the control and experimental means and the number of biologically independent samples used to derive the statistics. c and d. Stills of live images illustrating the differing shapes of mitochondria in stem cells (c) and 4 to 8 cell cysts (d). Mitochondria, white; Cell membranes, blue. Dashes outline the stem cell and 4 to 8 cell cyst. (See Supplementary Video 1.) e and f. Time course of diffusion of photoactivated mito-PAGFP in stem cells (SC, e) and 4–8 cell cysts (f). Mitochondria, white in upper panels. The red box marks the site of photoactivation. g. Quantification of diffusion of photoactivated mito-PAGFP in SC and cysts. The standard deviation (SD) of GFP fluorescence intensity in the whole stem cell or cyst at each time point was normalized to the initial postactivation value. Data are means and standard errors of 4 biological replicates.
Figure 3.
Figure 3.. Mitochondrial fragmentation is necessary and sufficient for germline mitochondrial DNA selection.
a-c. mtDNA FISH of heteroplasmic germaria: (a) control, (b) germline overexpression of Mitofusin (Mfn; selection for wt mtDNA is no longer observed) and (c) germline knockdown of Mitofusin (selection for wt mtDNA is observed in stem cells). Dashed circles demarcate germline. Arrows mark selection for wt mtDNA. (See Extended Data Figs. 5d,e, 6c–c”’). d and e. Knocking down Mitofusin in somatic cells is sufficient to select against mutant mtDNA in those cells. f. Percent mutant mtDNA, as assayed by qPCR, of embryos laid by control heteroplasmic females and of embryos of heteroplasmic females in which Mitofusin was overexpressed (Mfn OE) or knocked down in the germline. (See Extended Data Figs. 5g, 6d,e.) g. Germarium expressing HA-tagged Mitofusin (Mfn), under its endogenous promoter, and mitochondrially target eYFP (eYFP) reacted with anti-HA and anti-GFP antisera. Pseudocoloring depicts the ratio of Mitofusin to mito-eYFP levels. For ratios see pseudocolor bar. Dashed circle pointed to by the arrow outlines the cysts. (See Extended Data Figs. 7a–a”’.) h. mitofusin RNA levels decrease in cysts compared to stem cells. The RNA levels were determined by RT-qPCR and are presented as arbitrary units (AU). Data were analyzed using unpaired one-tailed t tests. (See also Extended Data Fig. 7b.)
Figure 4.
Figure 4.. A decrease in mitochondrial ATP reduces both mutant and wildtype mtDNA.
a-c. Pseudocolored images of germaria of wildtype (a; w1118), heteroplasmic (b) and heteroplasmic females with ATP synthase inhibitory factor 1 (IF1 KD) knocked down in germline (c) reacted with TMRM to measure mitochondrial membrane potential. d-f. Germaria of wildtype (d; w1118), heteroplasmic (e) and heteroplasmic females expressing a dominant negative inhibitor of complex V (CV DN) in the germline (f) reacted with antibodies to phosphorylated pyruvate dehydrogenase (PDH-P) and pyruvate dehydrogenase (PDH). Pseudocoloring depicts the ratio of PDH-P to PDH and is a measure ATP levels. (See Extended Data Fig. 9.) g and h. Percent mutant mtDNA (g) and the amount of mutant and wildtype mtDNA (h), as assayed by qPCR, of control heteroplasmic ovaries, of heteroplasmic ovaries in which the ATP synthase inhibitory factor 1 was knocked down in the germline (IF1 KD), and of heteroplasmic ovaries in which a dominant negative inhibitor of complex V (CV DN) was expressed in the germline. In h the amounts of mutant and wildtype DNA were normalized to the amounts in control ovaries.
Figure 5.
Figure 5.. The mitophagy proteins Atg1 and BNIP3 are necessary for germline mitochondrial DNA selection.
a-d. mtDNA FISH of control heteroplasmic germaria (a) and of heteroplasmic germaria in which Atg1 (b), Atg8 (c) or BNIP3 (d) were knocked down. The dashed circles demarcate the germline, arrows point to wildtype mtDNA. (See Extended Data Fig 10.) e and e’. BNIP3 protein localization in a heteroplasmic germarium. e’ also shows mitochondria (blue) as visualized with anti-ATP5a antibody. f. Percent mutant mtDNA, as assayed by qPCR, of control heteroplasmic ovaries (Ctrl) and of ovaries in which Atg1, Atg8 or BNIP3 were knocked down. g. The amount of mutant and wildtype mtDNA, as assayed by qPCR, in ovaries in which Atg1 or BNIP3 were knocked down, normalized to the amount of mutant and wildtype mtDNA in control ovaries.

Comment in

References

    1. Fan W et al. A mouse model of mitochondrial disease reveals germline selection against severe mtDNA mutations. Science 319, 958–962 (2008). - PMC - PubMed
    1. Stewart JB et al. Strong purifying selection in transmission of mammalian mitochondrial DNA. PLoS Biol. 6, e10 (2008). - PMC - PubMed
    1. Hill JH, Chen Z & Xu H Selective propagation of functional mitochondrial DNA during oogenesis restricts the transmission of a deleterious mitochondrial variant. Nat Genet 46, 389–392 (2014). - PMC - PubMed
    1. Floros VI et al. Segregation of mitochondrial DNA heteroplasmy through a developmental genetic bottleneck in human embryos. Nature Cell Biology 20, 144–151 (2018). - PMC - PubMed
    1. Ma H, Xu H & O’Farrell PH Transmission of mitochondrial mutations and action of purifying selection in Drosophila melanogaster. Nat Genet 46, 393–397 (2014). - PMC - PubMed

Method References

    1. Ni J-Q et al. A genome-scale shRNA resource for transgenic RNAi in Drosophila. Nat Meth 8, 405–407 (2011). - PMC - PubMed
    1. Markstein M, Pitsouli C, Villalta C, Celniker SE & Perrimon N Exploiting position effects and the gypsy retrovirus insulator to engineer precisely expressed transgenes. Nat Genet 40, 476–483 (2008). - PMC - PubMed
    1. Matsuura ET, Chigusa SI & Niki Y Induction of mitochondrial DNA heteroplasmy by intra- and interspecific transplantation of germ plasm in Drosophila. Genetics 122, 663–667 (1989). - PMC - PubMed
    1. Hurd TR et al. Long Oskar Controls Mitochondrial Inheritance in Drosophila melanogaster. Dev Cell 39, 560–571 (2016). - PMC - PubMed
    1. McKim KS, Joyce EF & Jang JK in Methods in Molecular Biology 558, 197–216 (Humana Press, 2009). - PubMed

Publication types

MeSH terms

LinkOut - more resources