. 2019 May;569(7757):576-580.
doi: 10.1038/s41586-019-1198-z. Epub 2019 May 15.

Epigenetic evolution and lineage histories of chronic lymphocytic leukaemia

Affiliations

Epigenetic evolution and lineage histories of chronic lymphocytic leukaemia

Federico Gaiti et al. Nature. 2019 May.

Abstract

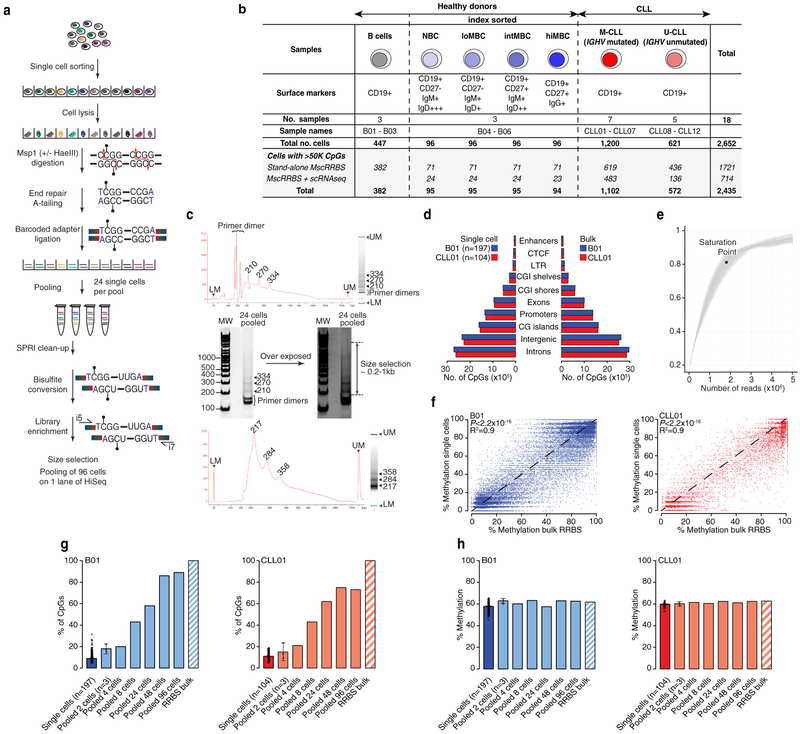
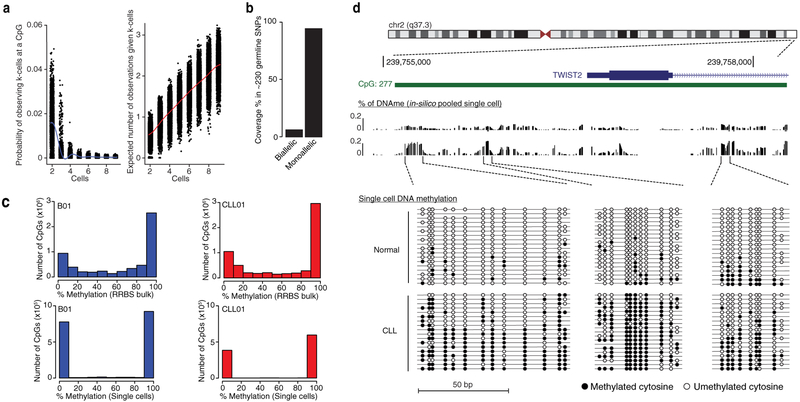
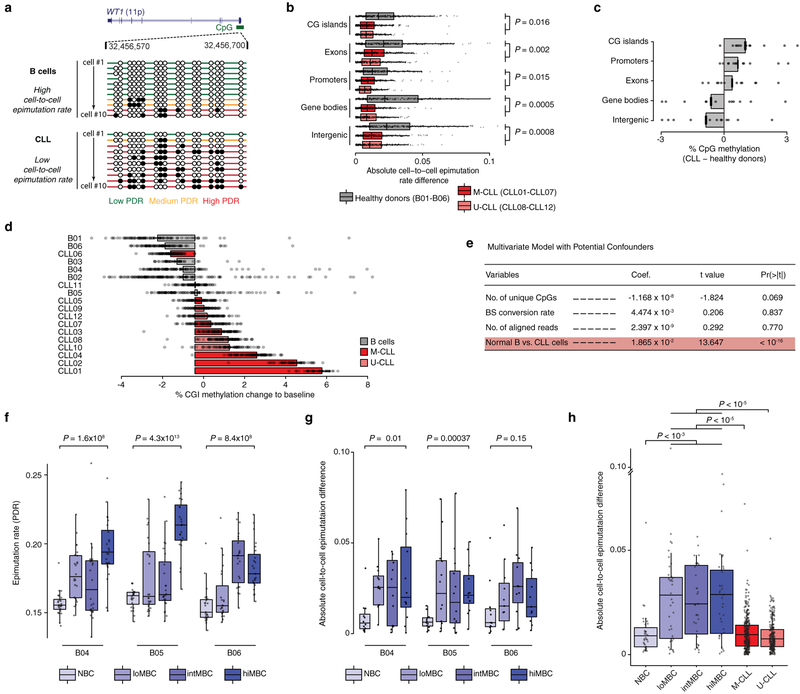
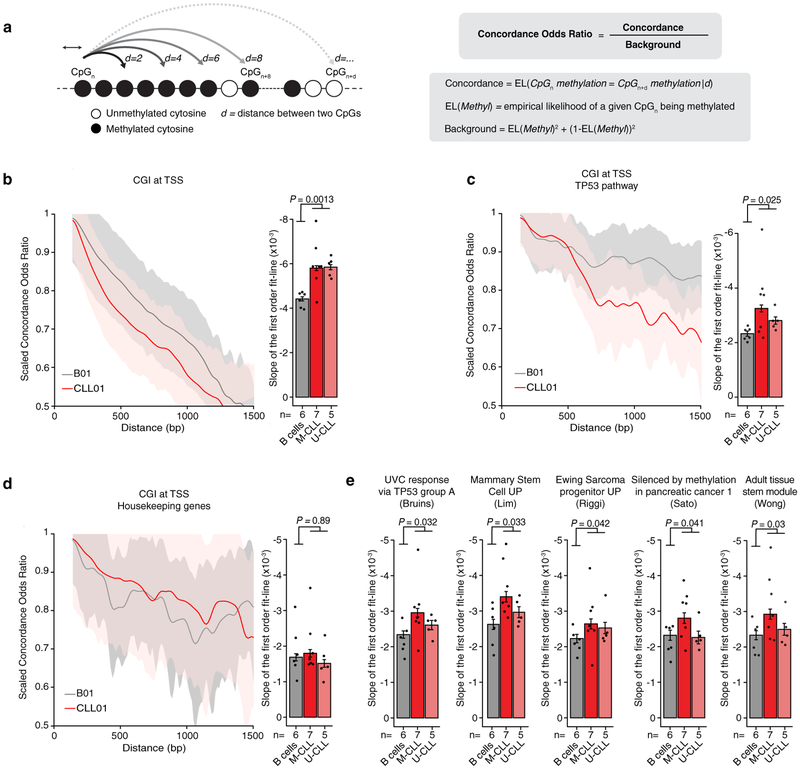
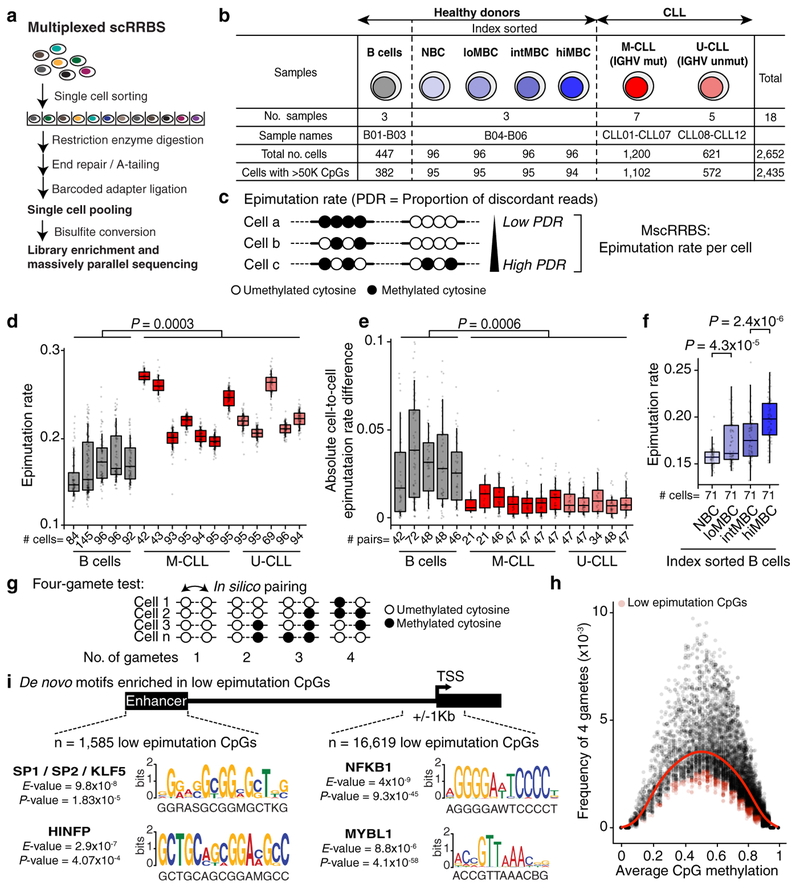
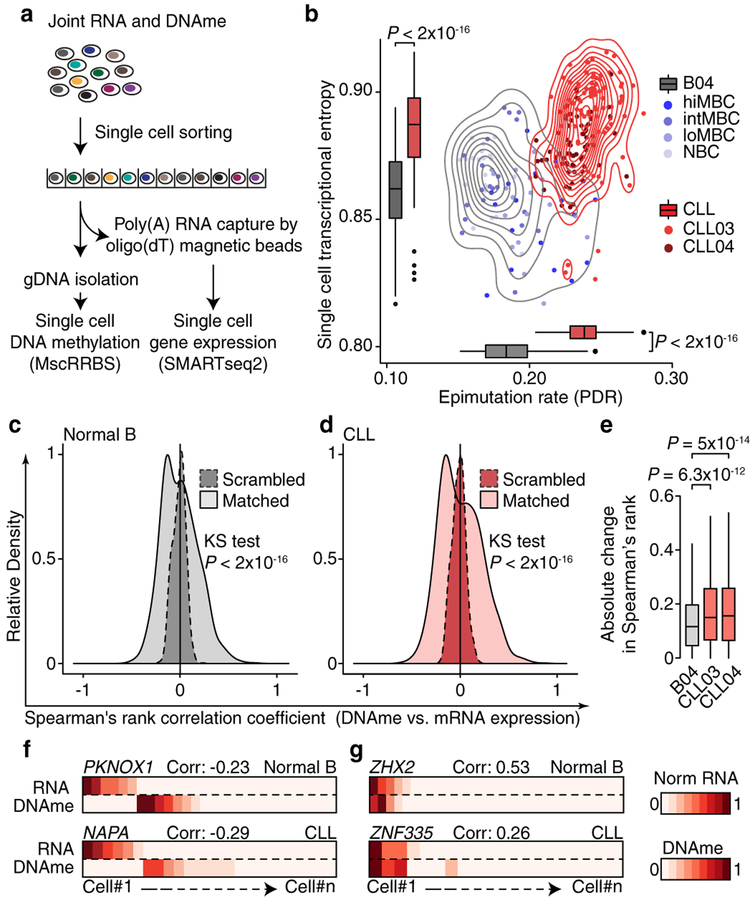
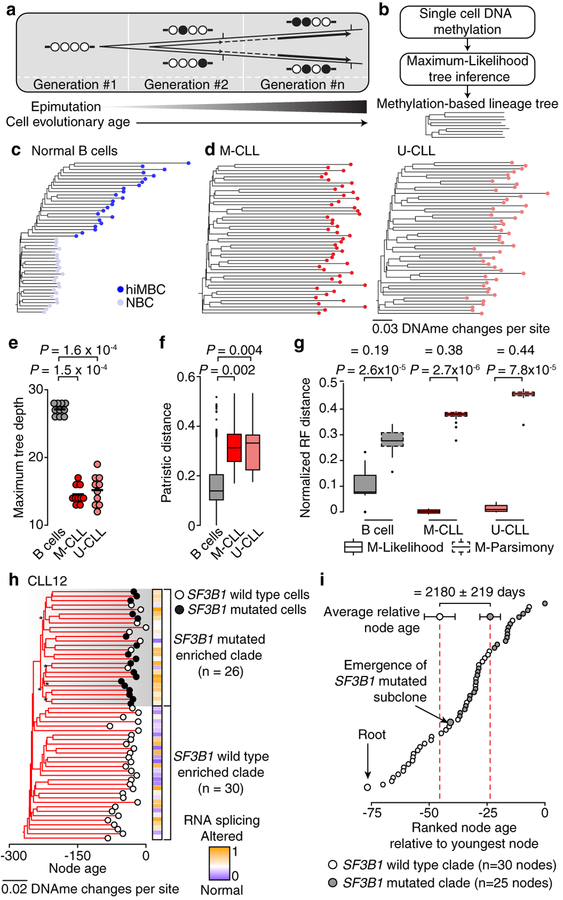
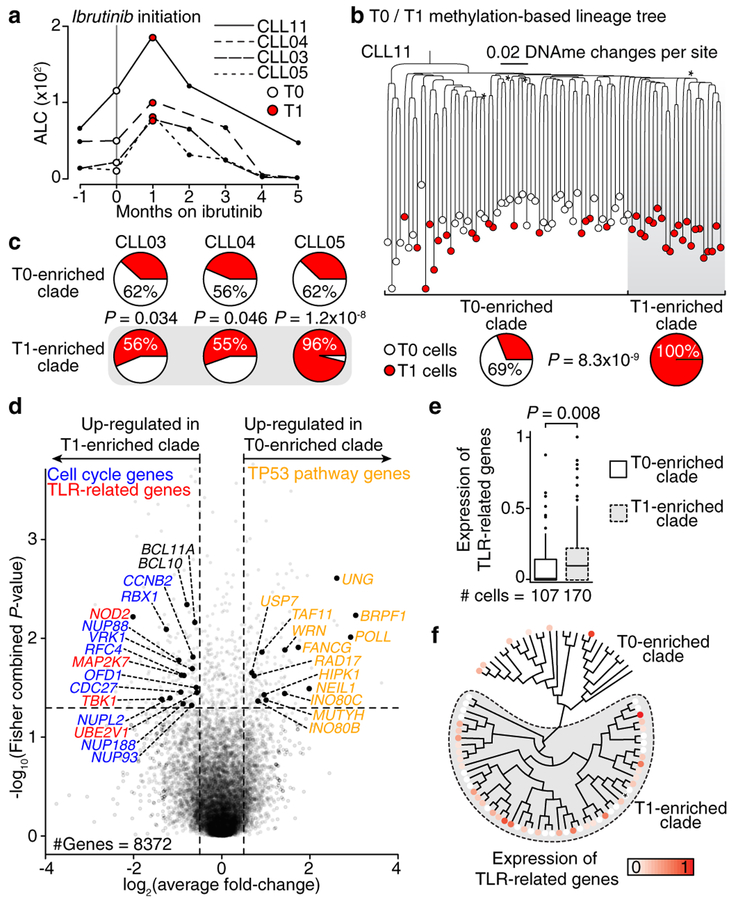
Genetic and epigenetic intra-tumoral heterogeneity cooperate to shape the evolutionary course of cancer1. Chronic lymphocytic leukaemia (CLL) is a highly informative model for cancer evolution as it undergoes substantial genetic diversification and evolution after therapy2,3. The CLL epigenome is also an important disease-defining feature4,5, and growing populations of cells in CLL diversify by stochastic changes in DNA methylation known as epimutations6. However, previous studies using bulk sequencing methods to analyse the patterns of DNA methylation were unable to determine whether epimutations affect CLL populations homogeneously. Here, to measure the epimutation rate at single-cell resolution, we applied multiplexed single-cell reduced-representation bisulfite sequencing to B cells from healthy donors and patients with CLL. We observed that the common clonal origin of CLL results in a consistently increased epimutation rate, with low variability in the cell-to-cell epimutation rate. By contrast, variable epimutation rates across healthy B cells reflect diverse evolutionary ages across the trajectory of B cell differentiation, consistent with epimutations serving as a molecular clock. Heritable epimutation information allowed us to reconstruct lineages at high-resolution with single-cell data, and to apply this directly to patient samples. The CLL lineage tree shape revealed earlier branching and longer branch lengths than in normal B cells, reflecting rapid drift after the initial malignant transformation and a greater proliferative history. Integration of single-cell bisulfite sequencing analysis with single-cell transcriptomes and genotyping confirmed that genetic subclones mapped to distinct clades, as inferred solely on the basis of epimutation information. Finally, to examine potential lineage biases during therapy, we profiled serial samples during ibrutinib-associated lymphocytosis, and identified clades of cells that were preferentially expelled from the lymph node after treatment, marked by distinct transcriptional profiles. The single-cell integration of genetic, epigenetic and transcriptional information thus charts the lineage history of CLL and its evolution with therapy.


Conflict of interest statement

Competing interests

The authors declare no competing financial interests.

Figures

Extended Data Figure 1.
Extended Data Figure 1.. MscRRBS is an accurate and reproducible method for single-cell DNAme analysis
(a) Detailed schematic of multiplexed single-cell RRBS (MscRRBS) protocol. (b) Extended summary table of healthy donors and CLL patient samples used in this study. (c) Representative size distribution of the MscRRBS libraries assessed by Agilent Bioanalyzer before and after primer dimers removal. The DNA fragment size in MscRRBS libraries is typically 200–1000 bp, with some visible peaks corresponding to the MspI fragments for repeat elements, and primer dimer contaminants (~170 bp). (d) Number of CpGs observed in MscRRBS libraries across relevant genomic regions comparing MscRRBS (left) and bulk RRBS (right) assays for normal B (B01) and CLL (CLL01) cells. The enrichment in exons, promoters and CpG islands (CGIs) observed in MscRRBS libraries corresponded to ~40% of the total sequenced CpGs, akin to bulk RRBS assays. (e) Downsampling analysis showing that ~1.7 million paired-end reads per cell provided ~85% of unique CpGs with further sequencing resulting in a marginal increase in coverage. (f) Correlation of average CpG methylation across in silico merged single cells and bulk RRBS obtained from matched samples for normal B (B01, n = 40,257 CpGs) and CLL (CLL01, n = 9,578 CpGs) cells. P-values are indicated for two-sided Pearson’s correlation test. (g) Pooling individual single cells together rapidly increases the number of CpGs recovered, approaching bulk RRBS coverage with >48 cells. The percentage of CpG sites detected in single cell data (blue and red for normal B cells and CLL cells, respectively), the in vitro pooled single-cell datasets (light blue and light red, respectively) and matched bulk RRBS libraries (striped bars) is shown. Error bars represent 95% confidence interval. (h) Same as panel (g) for average CpG DNA methylation. Single, pooled cells and bulk RRBS showed a similar CpG methylation percentage, suggesting measured genome-wide DNAme profiles of individual cells accurately recapitulate bulk methylation profiles in the same cell type.
Extended Data Figure 2.
Extended Data Figure 2.. Single-cell DNA methylation coverage analysis
(a) The ~10% sampling of the MscRRBS DNA methylome leads to intersection decrease of individual CpGs across cells. Left: expected number of times of observing a given CpG across all k cells, (matching k indicated in the x-axis value). Right: expected number of measured CpGs given k-cells. (b) Biallelic coverage within a given single cell was detected in only 4.6±2% of ~230 germline SNPs available for analysis, suggesting that the observed single-cell CpG data largely represents only one of the two alleles of the near-diploid CLL genome. (c) Histograms of the distribution of CpG methylation values for single normal B (blue) and CLL (red) cells and matched bulk RRBS libraries showing highly-digitized pattern of DNAme in single cells (i.e., CpG sites either methylated or unmethylated) in contrast to bulk RRBS which shows intermediate DNAme values. (d) Representative analysis for three non-contiguous genomic windows around the promoter region of Twist2, previously shown to be implicated in CLL pathogenesis. Shown from top to bottom are the annotation of the Twist2 promoter locus with CGI sites indicated (green); the estimated methylation rate of in-silico pooled single cells for healthy donors and CLL; and the CpG methylation patterns (black circles: methylated; white circles: unmethylated) of single cells. Note the higher level of DNAme percentage in CLL compared with healthy donor cells at these selected regions.
Extended Data Figure 3.
Extended Data Figure 3.. CLL epigenomes show elevated epimutation rate across all genomic regions, with low cell-to-cell variability in epimutation rates
(a) Representative analysis of the WT1 locus. CpG island is indicated in green, along with the CpG methylation patterns (black circles: methylated; white circles: unmethylated) in single cells. We note that CLL cells exhibit lower cell-to-cell variation in epimutation rate compared with normal B cells. (b) Comparison of cell-to-cell epimutation rate difference per genomic region between CLL (M-CLL [CLL01-CLL07], n = 309 pairs; U-CLL [CLL08-CLL12], n = 218 pairs) and normal B (B01-B06, n = 333 pairs) cells. P-values were computed for two-sided Mann-Whitney U-test by comparing the median cell-to-cell PDR differences of healthy donor samples (n = 5) with the median cell-to-cell PDR differences of CLL samples (n = 12) for each genomic region, followed by a Bonferroni adjustment procedure. (c) Difference in average CpG methylation per genomic region between CLL (n = 12) and normal B (n = 6) samples (CLL01-CLL12 [M-CLL, n = 619 cells; U-CLL, n = 436 cells] and B01-B06 [n = 666 cells]). (d) Percentage of CpG methylation change at CpG islands (CGI) when comparing DNAme level of individual cells in each sample to baseline (defined as the average DNAme level across all samples) for CLL and normal B cells (CLL01-CLL12 [M-CLL, n = 619 cells; U-CLL, n = 436 cells] and B01-B06 [n = 666 cells]). (e) Multivariable linear regression model that account for potential technical confounders (bisulfite conversion rate, number of aligned reads, number of covered CpGs). CLL01-CLL12 (M-CLL, n = 619 cells; U-CLL, n = 436 cells) and B01-B06 (n = 666 cells) samples were used in the analysis. (f) Single-cell epimutation rate across index-sorted normal B cells (B04, n = 96 cells; B05, n = 96 cells; B06 = 92 cells). P-values are indicated for two-sided Mann-Whitney U-tests. (g) Same as panel (f) for cell-to-cell epimutation difference (B04, n = 48 pairs; B05, n = 48 pairs; B06 = 46 pairs). P-values are indicated for two-sided Mann-Whitney U-tests. (h) Direct comparison of cell-to-cell epimutation difference between CLL (M-CLL [CLL01-CLL07], n = 309 pairs; U-CLL [CLL08-CLL12], n = 218 pairs) and index-sorted B cells (B04-B06; NBC, n = 35 pairs; loMBC, n = 35 pairs; intMBC, n = 35 pairs; hiMBC, n = 35 pairs). P-values are indicated for two-sided Mann-Whitney U-tests. Throughout the figure, boxplots represent median and bottom and upper quartile; lower and upper whiskers correspond to 1.5 x IQR. Error bars represent 95% confidence interval.
Extended Data Figure 4.
Extended Data Figure 4.. Long-range DNA methylation concordance decay
(a) Concordance odds ratio (COR) of DNA methylation state between any two neighbouring CpGs as function of their genomic distance (see Methods for details). (b) Left: Scaled COR (0–1) for CpG islands at transcription start sites (CGI at TSS; B01 and CLL01 samples are shown as a representative example). Right: average rate of decay (slope of the first order fit line) in COR for normal B (n = 6) and CLL (n = 12) samples for CGI at TSS (B01-B06 [n = 666 cells; n = 48,065,000 CpGs] and CLL01-CLL12 [M-CLL, n = 619 cells, n = 38,968,846 CpGs; U-CLL, n = 436 cells, n = 37,464,310 CpGs]). P-value was computed for two-sided Mann-Whitney U-test by comparing the average rate of decay in COR of healthy donor samples (n = 6) with the average rate of decay in COR of CLL samples (n = 12). (c) Same as panel (b) for CGI at TSS of genes belonging to the TP53 gene set. Normal B cells, n = 666 cells, n = 6,308,174 CpGs; M-CLL, n = 619 cells, n = 5,113,493 CpGs; U-CLL, n = 436 cells, n = 4,982,039 CpGs. P-value was computed for two-sided Mann-Whitney U-test by comparing the average rate of decay in COR of healthy donor samples (n = 6) with the average rate of decay in COR of CLL samples (n = 12). (d) Same as panel (b) for CGI at TSS of housekeeping genes. Normal B cells, n = 666 cells, n = 2,087,432 CpGs; M-CLL, n = 619 cells, n = 1,686,295 CpGs; U-CLL, n = 436 cells, n = 1,620,802 CpGs. P-value was computed for two-sided Mann-Whitney U-test by comparing the average rate of decay in COR of healthy donor samples (n = 6) with the average rate of decay in COR of CLL samples (n = 12). (e) Average rate of decay in COR for normal B (n = 6) and CLL (n = 12) samples for CGI at TSS of genes belonging to gene sets previously reported to be affected by high epimutation rate. Normal B cells, n = 666 cells, n = 48,065,000 CpGs; M-CLL, n = 619 cells, n = 38,968,846 CpGs; U-CLL, n = 436 cells, n = 37,464,310 CpGs. P-value was computed for two-sided Mann-Whitney U-test by comparing the average rate of decay in COR of healthy donor samples (n = 6) with the average rate of decay in COR of CLL samples (n = 12). Throughout the figure, error bars represent 95% confidence interval.
Extended Data Figure 5.
Extended Data Figure 5.. Epimutations at single CpG resolution
(a) Frequency of 4-gametes according to the level of average methylation of each individual CpG site in each CLL sample (CLL01-CLL12; randomly sampled CpGs shown out of the total CpGs assessed in each CLL sample; range [156,662–2,371,498] CpGs/sample covered in >5 cells in each sample). Smooth local regression line (LOESS) is shown in red. (b) Low epimutation (loEpi) CpGs are defined as being 1.5*median absolute deviation (MAD) away from the median frequency of 4-gametes in each DNAme window of 0.05 [0.1–0.9] for a given sample. Shown is a representative example of this procedure for DNAme window of [0.5–0.55] in CLL04 patient sample. (c) Percentage of loEpi CpGs (average of 1.22%±0.42 [average±SEM]; range [0.04–2.9%]) out of the total CpGs assessed in each CLL sample. CLL01, n = 14,711 loEpi CpGs; CLL02, n = 2,573 loEpi CpGs; CLL013, n = 25,270 loEpi CpGs; CLL04, n = 29,114 loEpi CpGs; CLL05, n = 16,603 loEpi CpGs; CLL06, n = 11,413 loEpi CpGs; CLL07, n = 19,330 loEpi CpGs; CLL08, n = 19,916 loEpi CpGs; CLL09, n = 11,440 loEpi CpGs; CLL10, n = 18,614 loEpi CpGs; CLL11, n = 7,067 loEpi CpGs; CLL12, n = 308 loEpi CpGs. (d) Additional sequence logos of the DNA motifs determined to be significantly over-represented in low epimutation CpGs (+/− 25bp around CpGs at promoters [TSS +/− 1 Kb] or at enhancers) across all CLL samples. For each motif, the E-value and the TOMTOM P-value are shown. See Methods for details on the de novo motif enrichment analysis and the statistical tests used. (e) Median protein expression (log10 normalized iBAQ intensity) of transcription factors for which motifs were enriched in regions with low epimutation CpGs, confirming that the identified TFs are expressed at the protein level in B-lymphocytes and/or hematopoietic compartments. Error bars represent 95% confidence interval. All available human proteome data from lymphoid/hematopoietic lineages are displayed.
Extended Data Figure 6.
Extended Data Figure 6.. Methylation-transcription relationships at the single-cell level
(a) Number of reads (left) and expression of Immunoglobulin Heavy Chain (IGH) genes (right) in index-sorted B cells validating our index-sorting strategy (CD27IgM+IgD+++IgG [NBC, n = 24 cells], CD27IgM+IgD+IgG [loMBC, n = 24 cells], CD27+IgM+IgD++IgG [intMBC, n = 24 cells], and CD27+IgG+ [hiMBC, n = 23 cells]). Violin plots represent kernel density estimation showing the distribution shape of the data. (b) Proportion of cells with gene expression (read count > 0) and exhibiting above-threshold DNAme. Full circles (and whiskers) represent the mean (±SEM) proportion across all genes with sufficient RNA (expression seen in > 5 cells) and DNAme (> 5 CpGs per promoter) information across the three samples (n = 1,816 genes). (c) Mean (±SEM) across cells of transcriptional entropy (see Methods) showing higher transcriptome entropy in CLL (CLL03, n = 94; CLL04, n = 92) compared with normal B cells (B04, n = 84) across various downsampling regimes (range [5,000–100,000]; step-size of 1,000). (d and e) Single-cell transcriptional entropy (d) and epimutation rate (e) between normal CD27 B (NBC and loMBC) and CD27+ B (intMBC and hiMBC) cells. (f) Left: distribution of the Spearman’s rho between expression and promoter DNAme rate (n = 3,094 genes with sufficient RNA [expression seen in > 5 cells] and DNAme [> 5 CpGs per promoter] information) in CLL04. The observed spearman’s rho values were compared to values obtained by randomly permuting cell labels for the methylation values (see Methods). P-value is indicated for two-sided Kolmogorov–Smirnov (KS) test. Right: heatmaps of spearman’s rank-order correlation for representative genes with positive or negative single-cell expression-methylation correlation. Scale bar represents promoter methylation and RNA read counts scaled by maximal value. (g) Same as panel (f) for individual normal B cells (n = 5,729 genes; n = 16 permutations; see Methods for details). (h) Same as panel (g) for CLL03 (n = 2,699 genes; n = 16 permutations). (i) Same as panel (g) for CLL04 (n = 3,094 genes; n = 16 permutations). (j) Absolute change in Spearman’s rho when comparing matched vs. scrambled DNAme and RNA single-cell data in CLL (CLL03 and CLL04) and normal B (B04) cells. From the pool of genes used in panel (g-i), only overlapping genes (n = 951) across the three samples were used in the comparison. P-values are indicated for two-sided Wilcoxon Signed Rank test. (k) Same as panel (f) for individual normal B cells (n = 2,500 most variable genes with sufficient RNA [expression seen in > 5 cells] and DNAme [> 5 CpGs per promoter] information; n = 16 permutations; see Methods for details). (l) Same as panel (k) for CLL03. (m) Same as panel (k) for CLL04. (n) Absolute change in Spearman’s rho when comparing matched vs. scrambled DNAme and RNA single-cell data in CLL (CLL03 and CLL04) and normal B (B04) cells. From the pool of genes used in panel (k-m), only overlapping genes (n = 459) across the three samples were used in the comparison. P-values are indicated for two-sided Wilcoxon Signed Rank test. (o) Mean (±SEM) hydroxymethylation (5-hmC) level at genes with positive correlation between expression and promoter DNA methylation (top correlated 10% of genes) compared with negatively correlated genes (top anti-correlated 10% of genes) in both normal B (B04; n = 336 and 330 genes, respectively) and CLL (CLL03 [n = 290 and 278 genes, respectively]; CLL04 [n = 320 and 314 genes, respectively]) cells. Error bars represent 95% confidence interval. P-values are shown for two-sided Welch’s t-test. Published 5-hmC data were used for the analysis. Throughout the figure, boxplots represent median and bottom and upper quartile; lower and upper whiskers correspond to 1.5 x IQR.
Extended Data Figure 7.
Extended Data Figure 7.. Methylation-based lineage trees provide a native lineage tracing system
(a) Additional representative (random cell subsampling) methylation-based lineage trees of CLL cells. (b) Same as panel (a) for index-sorted normal B cells, showing that naïve CD27 B cells (NBC; CD27IgM+IgD+++IgG) precede CD27+ memory terminally-differentiated B cells (hiMBC; CD27+IgG+) in the lineage tree. (c) Representative (cell subsampling) methylation-based lineage trees of CLL cells reconstructed using only autosomes or chromosome X. Tree topologies are similar to when using whole genome information (see Fig. 3d and panel (a)), showing rapid drift after the initial malignant transformation. (d) Same as panel (c) for lineage trees of CLL cells obtained by holding-out chromosomes (hold-out three chromosomes at a time before phylogeny reconstruction; e.g., excluding chromosomes 1–3, left), or downsampling the number of CpGs per cell to equal numbers (120K CpGs per cell; right). (e) Normalized Robinson-Foulds (normRF) distances between any two trees (n = 30 tree replicates; see Methods) of CLL01 reconstructed by maximum-likelihood (ML) vs. maximum-parsimony (MP). Differences in median normRF between ML and MP are indicated on the top, with P-values for two-sided Mann-Whitney U-test. (f) Average maximum tree depth of lineage trees (n = 10 tree replicates; see Methods) of CLL (CLL01) and normal B (B02) cells when using whole genome information compared to lineage trees obtained by holding-out chromosomes (hold-out three chromosomes at a time before phylogeny reconstruction). P-values were computed for Welch’s t-test by comparing the maximum tree depths (one value per tree) between CLL and normal B samples. Error bars represent 95% confidence interval. (g) Distribution of root-to-tip branch lengths (i.e., the length from the root to each tip in the lineage tree) between CLL and normal B cells (M-CLL [CLL07], U-CLL [CLL10], B05 shown as representative examples). (h) Patristic distances between index-sorted B cells from B04, B05 and B06 healthy donor samples (NBC, n = 24 cells for each sample; loMBC, n = 24 cells for each sample; intMBC, n = 24 cells for each sample; hiMBC, n = 23 cells for each sample). P-values were computed for two-sided Mann-Whitney U-test. (i) Patristic distances between CLL (CLL01) and normal B (B02) cells obtained from lineage trees reconstructed by using only autosomes, chromosome X, holding-out chromosomes (hold-out three chromosomes at a time before phylogeny reconstruction), or downsampling the number of CpGs per cell to equal numbers (120K CpGs per cell), respectively. P-values are indicated for two-sided Mann-Whitney U-test. Throughout the figure, boxplots represent median and bottom and upper quartile; lower and upper whiskers correspond to 1.5 x IQR.
Extended Data Figure 8.
Extended Data Figure 8.. MscRRBS integration with single-cell transcriptomes and genotyping
(a) Schematic of the joint MscRRBS, transcriptome, and genotyping capture protocol. (b) Normalized Robinson-Foulds (normRF) distances between any two trees (n = 30 tree replicates; see Methods) of CLL12 (n = 56 cells; see Fig. 3h) reconstructed by maximum-likelihood (ML) vs. maximum-parsimony (MP). Differences in median normRF between ML and MP are indicated on the top, with P-values for two-sided Mann-Whitney U-test. (c) Proportion of SF3B1 wild type (white) and SF3B1 mutated cells (black) in each clade identified from the lineage tree shown in Fig. 3h. P-value is indicated for two-sided Fisher’s Exact test. (d) Comparison of number of unique CpGs (left) and CpG methylation level (right) between the SF3B1 wild-type enriched clade cells and the SF3B1 mutated enriched clade of cells identified from the lineage tree in Fig. 3h. P-values are indicated for two-sided Mann-Whitney U-test. (e) Volcano plot of differentially methylated gene promoters (absolute weighted average DNAme difference > 0.3 and two-sided non-parametric permutation test P-values < 0.05) between the SF3B1 wild type and SF3B1 mutated cells from lineage tree shown in Fig. 3h. (f) Single-cell alternative 3’ splicing score (fraction of reads that map downstream to the 3’ end [up to 100 bp] of the exons vs. within the exons) for cells belonging to SF3B1 wild type (n = 30) and SF3B1 mutated (n = 26) clades identified from the lineage tree shown in Fig. 3h. P-value is indicated for two-sided Mann-Whitney U-test. (g) Volcano plot of differentially expressed genes between the SF3B1 wild type enriched clade and SF3B1 mutated enriched clade. Genes (n = 57) with absolute log2(fold-change) > 0.5 and Benjamini-Hochberg FDR adjusted weighted F test P-values < 0.2 are shown in red. Genes that were previously reported to be affected by SF3B1 mutation are also labelled. (h) Gene expression projections on lineage trees for two representative genes identified in panel (g). (i) Comparison of transcriptional distances (measured as Euclidean distances of the first three principal components after PCA) as a function of lineage distance between cell pairs from the lineage tree shown in Fig. 3h. P-value is indicated for two-sided Mann-Whitney U-test. (j) Cells belonging to SF3B1-mutated enriched clade show significantly lower relative node heights (i.e., height of internal tree nodes relative to the root node; see Methods) compared with SF3B1 wild type enriched clade, consistent with SF3B1 mutation being a later subclonal event in CLL. P-value is indicated for two-sided Mann-Whitney U-test. (k) Same as panel (j) for root-to-tip branch lengths (i.e., the length from the root to each tip in the lineage tree). (l) Distribution of node ages (estimated no. of divisions before present; see Methods) between the SF3B1 wild type enriched clade (white, n = 30 nodes) and SF3B1 mutated enriched clade (grey, n = 25 nodes). P-value is indicated for two-sided Mann-Whitney U-test. Throughout the figure, boxplots represent median and bottom and upper quartile; lower and upper whiskers correspond to 1.5 x IQR.
Extended Data Figure 9.
Extended Data Figure 9.. Joint single-cell methylomics and RNAseq link epigenetic and transcriptional information in CLL evolution with therapy
(a) Representative methylation-based lineage trees integrating pre-treatment (T0; white circle; n = 40 randomly sampled cells out of 96 cells) and post-treatment (T1; red circle; n = 40 randomly sampled cells out of 96 cells) cells for sample CLL03, CLL04, and CLL05. See Fig. 4c for the percentage of T1 cells in each of the two clades (defined as the ones occurring after the first major split in the lineage tree) inferred from these lineage trees. (b) Comparison of CpG methylation level between the T1-enriched clade of cells and the remaining T1 cells identified from the lineage trees in Fig. 4b and panel (a) for CLL03, CLL04, CLL05, and CLL11, respectively. Boxplots represent median and bottom and upper quartile. Lower and upper whiskers correspond to 1.5 x IQR. P-values are indicated for two-sided Mann-Whitney U-test. (c) Same as panel (b) for number of unique CpGs. Boxplots represent median and bottom and upper quartile. Lower and upper whiskers correspond to 1.5 x IQR. P-values are indicated for two-sided Mann-Whitney U-test. (d) Volcano plot of differentially methylated genes (absolute weighted average DNAme difference > 0.3 and two-sided non-parametric permutation test P-values < 0.05) between the T1-enriched clade of cells and the remaining T1 cells identified from the lineage trees in Fig. 4b and panel (a) for CLL03 (n = 515 genes), CLL04 (n = 429 genes), CLL05 (n = 690 genes), and CLL11 (n = 578 genes), respectively.
Extended Data Figure 10.
Extended Data Figure 10.. Cells preferentially expelled from the lymph nodes are marked by a distinct transcriptional profile
(a) Gene sets (CP) enriched in differentially expressed genes (n = 336) between the T1-enriched clade of cells and the remaining T1 cells identified from the lineage trees in Fig. 4b and Extended Data Fig. 9a. A two-sided hypergeometric test was used to measure the enrichment of these genes in each gene-set, followed by a Benjamini-Hochberg FDR procedure (cut-off of adjusted P-value < 0.2). (b) Gene expression projections on lineage tree for Toll-like receptor (TLR) pathway genes from Fig. 4d for sample CLL04, CLL05, and CLL11, respectively. Scale bar represents RNA read counts scaled by maximal value. Expression value projection is performed only for T1 cells, comparing T1 vs. T0 enriched clades. Asterisk indicates cell without RNA information. (c) Fold-change gene expression of NF-κB-related genes between the T1-enriched clade of cells and the remaining T1 cells identified from the lineage trees in Fig. 4b and Extended Data Fig. 9a.
Figure 1.
Figure 1.. Consistently elevated epimutation rate defines the CLL epigenome
(a) Schematic of multiplexed single-cell RRBS (MscRRBS) protocol. See also Extended Data Fig. 1a. (b) Summary of healthy donors and CLL samples (naïve [NBC]; low-, intermediate-, high-maturity memory B cells [loMBC, intMBC, hiMBC]; IGHV mutated and unmutated CLL [M-CLL, U-CLL]). (c) Epimutations are measured as the proportion of discordant reads (PDR). (d) Single-cell epimutation rate across normal B (B01–02, B04–06) and CLL (CLL01–12) cells. Mann-Whitney U-test compared the median PDR values of healthy donor (n = 5) and CLL (n = 12) samples. (e) Cell-to-cell epimutation rate difference across normal B (B01–02, B04–06) and CLL (CLL01–12) cells. Mann-Whitney U-test compared the median absolute cell-to-cell PDR difference of healthy donor (n = 5) and CLL (n = 12) samples. (f) Single-cell epimutation rate across index-sorted normal B (B04–06) cells. Mann-Whitney U-tests. (g) Schematic of 4-gamete test procedure (see Methods). (h) Frequency of 4-gametes according to the level of average methylation of each CpG across CLL cells (CLL04 shown as a representative example, n = 29,114 low epimutation CpGs out of 1,835,994 total CpGs assessed; see also Extended Fig. 5a). Smooth local regression line is shown in red. Low epimutation CpGs are indicated in red. (i) Sequence logos of the DNA motifs significantly over-represented in low epimutation CpGs (+/−25bp) at promoters or enhancers, across CLL samples. For each motif, the E-value and the TOMTOM P-value are shown. See Methods for details on de novo motif enrichment analysis, and Extended Data Fig. 5d for additional motifs. Throughout figures, boxplots represent median, bottom and upper quartile; whiskers correspond to 1.5 x IQR.
Figure 2.
Figure 2.. CLL higher epimutation rate is associated with higher transcriptional entropy consistent with transcriptional dysregulation
(a) Schematic of the joint methylomics and transcriptomics method, applied to normal B cells (B04, n = 84) and CLL cells (CLL03, n = 94; CLL04, n = 92). (b) Single-cell transcriptome entropy and epimutation rate for normal B and CLL cells. Mann-Whitney U-test. See also Extended Data Fig. 6c. Distribution of Spearman’s rho of expression and promoter DNAme correlation (genes expressed >5 cells, DNAme >5 CpGs/promoter) across normal B cells (c; 3,239 genes), or CLL cells (d; CLL03, 2,699 genes). Spearman’s rho value distribution was compared to the distribution of values obtained through randomly permuted cell labels. Kolmogorov–Smirnov test. See also Extended Data Fig. 6g–n. (e) Absolute change in Spearman’s rho when comparing matched vs. permuted DNAme and RNA single-cell data in CLL and normal B cells, across 990 genes overlapping between the three samples. Wilcoxon Signed-Rank test. Representative genes with negative (f) or positive (g) single-cell expression-methylation correlation, with Spearman correlation. Scale bar represents promoter methylation and RNA read counts scaled by maximal value.
Figure 3.
Figure 3.. Lineage relationships inferred from single-cell DNA methylomes
(a) Epimutation as a somatic cell molecular clock, where each division has a given likelihood of generating epimutations. (b) Schematic of methylation-based lineage tree inference (see Methods). (c and d) Representative (random cell subsampling) methylation-based lineage trees of index-sorted normal B (B05, NBC and hiMBC cells) and CLL (M-CLL [CLL07]; U-CLL [CLL10]) cells. See also Extended Data Fig. 7. (e) Maximum tree depth of lineage trees. Mann-Whitney U-test compared the maximum tree depths (one value per tree) between CLL (M-CLL [CLL07]; U-CLL [CLL10]) and normal B (B05) samples (n = 10 tree replicates; see Methods). Black lines represent averages. (f) Patristic distances between CLL and normal B cells. One representative tree of randomly sampled cells for each sample was used. Mann-Whitney U-test compared the medians of the patristic distances between healthy donor (n = 6) and CLL (M-CLL, n = 7; U-CLL, n = 5) samples. (g) Normalized Robinson-Foulds (normRF) distances between any two trees (n = 30 tree replicates; see Methods) of CLL (M-CLL [CLL07]; U-CLL [CLL10]) and normal B (B05) cells reconstructed by maximum-likelihood (ML) vs. maximum-parsimony (MP). Differences in median normRF between ML and MP are indicated on top. Mann-Whitney U-tests. (h) Methylation-based lineage tree of CLL12 with projection of SF3B1 mutation status. Asterisk indicates bootstrap values <50%. Tree was rooted by including five normal B cells as outgroup (not shown). (i) Ranked node ages relative to the youngest node in the tree in panel (h). Difference in average node ages between the SF3B1 wild type clade and SF3B1 mutated clade is shown. Node ages (estimated no. of divisions before present) are calculated by dividing node heights by a rate of 0.0005 changes per CpG site per division (see Methods). 21.8 divisions translate to 2,180 days at a 1% cell proliferation rate per day. Error bars represent 95% confidence interval.
Figure 4.
Figure 4.. Joint single-cell methylomics and RNA-seq link lineage and transcriptional information in CLL evolution
(a) Absolute lymphocyte counts for the first months on ibrutinib. Serial MscRRBS and joint MscRRBS-RNAseq was performed prior to (T0) and at one month after ibrutinib initiation (T1). (b) Top: representative lineage tree integrating pre-treatment (T0; white circles) and post-treatment (T1; red circles) cells of CLL11. Each sample is represented by 40/96 randomly sampled cells. Asterisk indicates bootstrap values <50%. Bottom: Percentage of T1 cells in each of the two clades inferred from the lineage tree. Fisher’s Exact test. (c) Same as panel (b, bottom) for CLL03, CLL04, and CLL05. Fisher’s Exact test. (d) Volcano plot of gene expression comparing T1 cells from T1 enriched clades and T1 cells from T0 enriched clades (CLL03–05, CLL11). P-values were combined across patient samples (n = 8,372 genes expressed >5 cells in ≥3 samples) using Fisher’s combined probability test. (e) Scaled average gene expression across Toll-like receptor (TLR) pathway genes from panel (d) for each T1 cell from T1 enriched clades and each T1 cell from T0 enriched clades (CLL03–05, CLL11). Mann-Whitney U-test. (f) Gene expression projections on lineage tree for TLR pathway genes from panel (d) for sample CLL03. Scale bar represents RNA read counts scaled by maximal value. Expression value projection is performed only for T1 cells, comparing T1 vs. T0 enriched clades. Asterisk indicates cell without RNA information.

Comment in

References

    1. Flavahan WA, Gaskell E & Bernstein BE Epigenetic plasticity and the hallmarks of cancer. Science 357, eaal2380 (2017). - PMC - PubMed
    1. Burger JA et al. Clonal evolution in patients with chronic lymphocytic leukaemia developing resistance to BTK inhibition. Nature Communications 7, 11589 (2016). - PMC - PubMed
    1. Landau DA et al. Mutations driving CLL and their evolution in progression and relapse. Nature 526, 525–530 (2015). - PMC - PubMed
    1. Beekman R et al. The reference epigenome and regulatory chromatin landscape of chronic lymphocytic leukemia. Nature Medicine 24, 868–880 (2018). - PMC - PubMed
    1. Oakes CC et al. DNA methylation dynamics during B cell maturation underlie a continuum of disease phenotypes in chronic lymphocytic leukemia. Nature Genetics 48, 253–264 (2016). - PMC - PubMed

Publication types