. 2019 Jun;570(7760):189-193.
doi: 10.1038/s41586-019-1200-9. Epub 2019 May 15.

Mapping HIV prevalence in sub-Saharan Africa between 2000 and 2017

Affiliations

Mapping HIV prevalence in sub-Saharan Africa between 2000 and 2017

Laura Dwyer-Lindgren et al. Nature. 2019 Jun.

Abstract

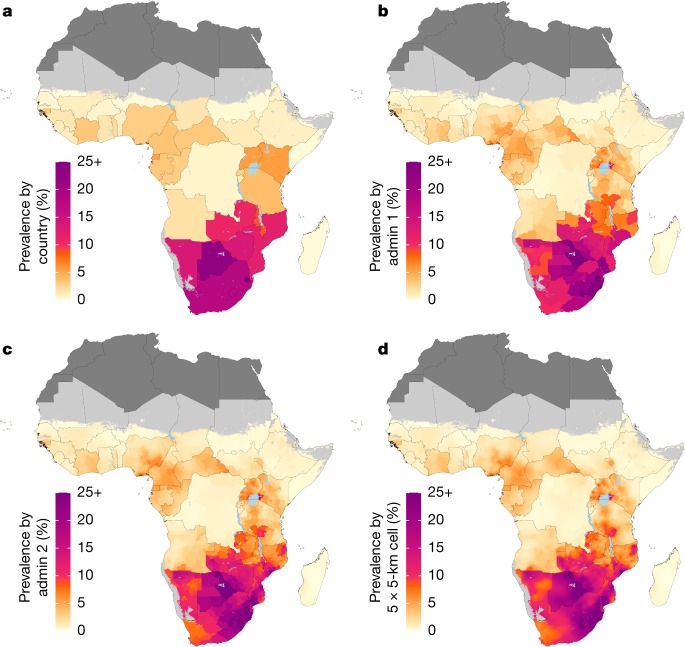
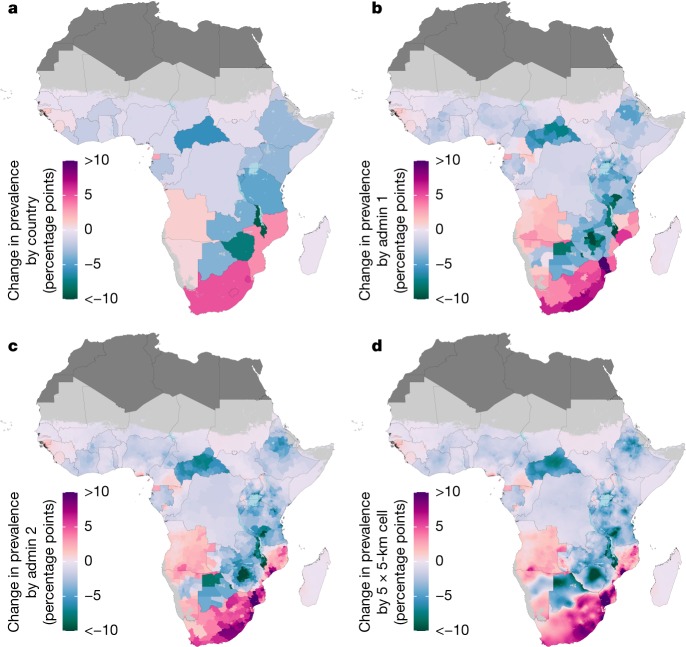
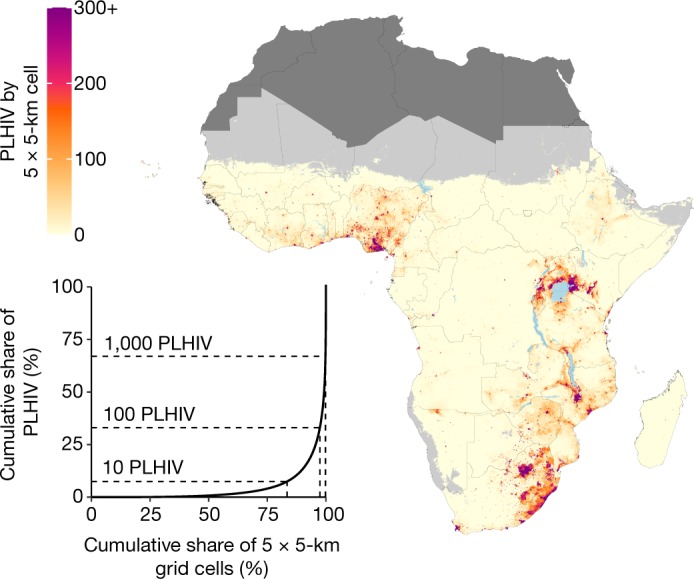
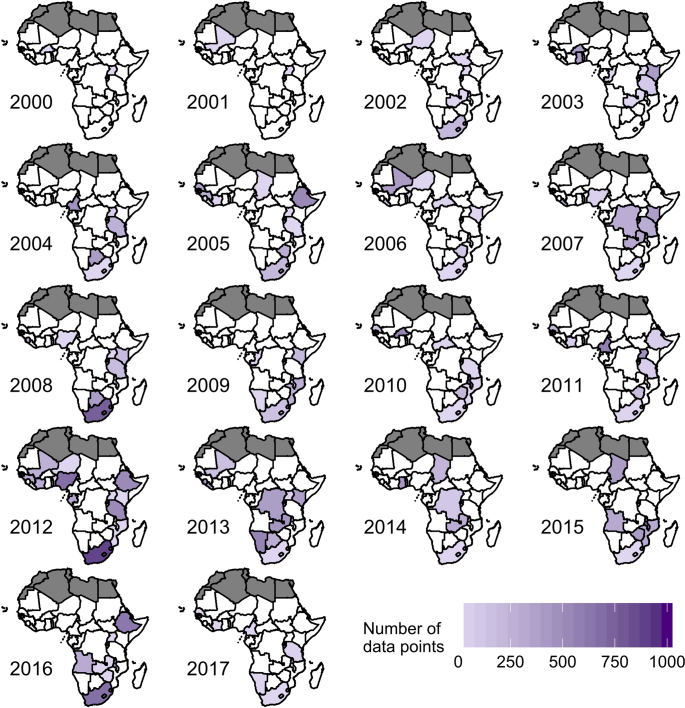
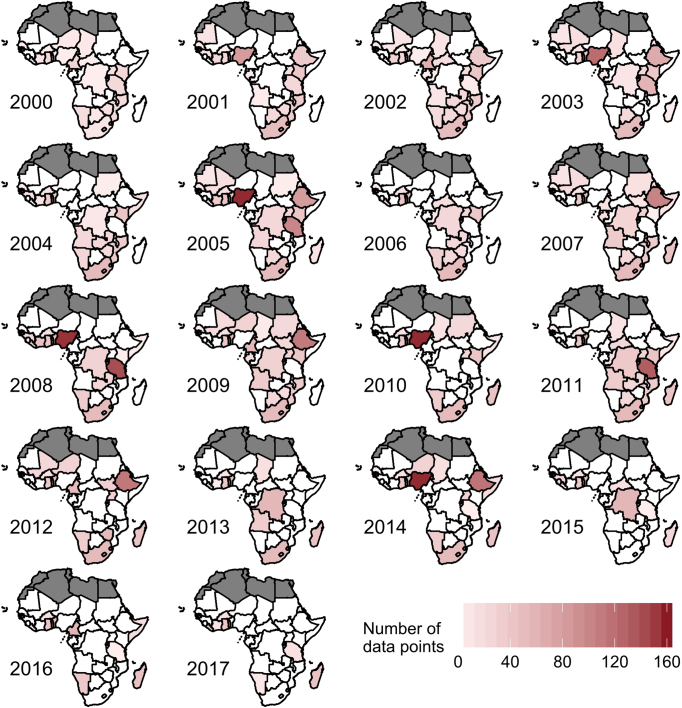
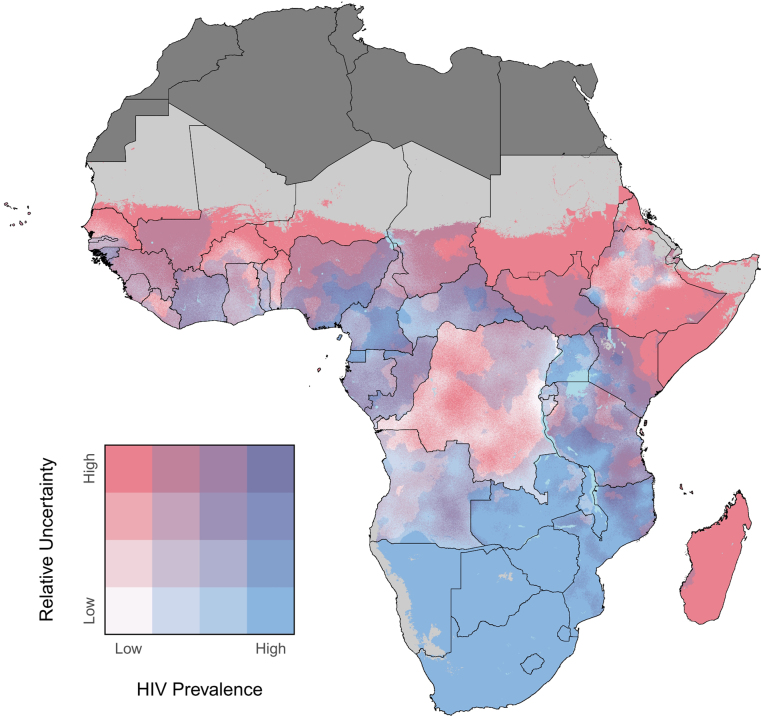
HIV/AIDS is a leading cause of disease burden in sub-Saharan Africa. Existing evidence has demonstrated that there is substantial local variation in the prevalence of HIV; however, subnational variation has not been investigated at a high spatial resolution across the continent. Here we explore within-country variation at a 5 × 5-km resolution in sub-Saharan Africa by estimating the prevalence of HIV among adults (aged 15-49 years) and the corresponding number of people living with HIV from 2000 to 2017. Our analysis reveals substantial within-country variation in the prevalence of HIV throughout sub-Saharan Africa and local differences in both the direction and rate of change in HIV prevalence between 2000 and 2017, highlighting the degree to which important local differences are masked when examining trends at the country level. These fine-scale estimates of HIV prevalence across space and time provide an important tool for precisely targeting the interventions that are necessary to bringing HIV infections under control in sub-Saharan Africa.


Conflict of interest statement

The authors declare no competing interests.

Figures

Fig. 1
Fig. 1. Prevalence of HIV in adults aged 15–49 in 2017.
ad, Prevalence of HIV among adults aged 15–49 in 2017 at the country level (a), first administrative subdivision level (admin 1; b), second administrative subdivision level (admin 2; c) and 5 × 5-km grid-cell level (d). Maps reflect administrative boundaries, land cover, lakes and population; grid cells with fewer than 10 people per 1 × 1 km, and classified as barren or sparsely vegetated, are coloured light grey,,–. Countries in dark grey were not included in the analysis.
Fig. 2
Fig. 2. Change in HIV prevalence in adults aged 15–49 from 2000 to 2017.
ad, Absolute change in HIV prevalence among adults aged 15–49 between 2000 and 2017 at the country level (a), first administrative subdivision level (b), second administrative subdivision level (c) and 5 × 5-km grid-cell level (d). Maps reflect administrative boundaries, land cover, lakes and population; grid cells with fewer than 10 people per 1 × 1 km, and classified as barren or sparsely vegetated, are coloured light grey,,–. Countries in dark grey were not included in the analysis.
Fig. 3
Fig. 3. Number of people living with HIV for adults aged 15–49 in 2017.
Number of people living with HIV (PLHIV) aged 15–49 in 2017 per 5 × 5-km grid cell (map) and Lorenz curve depicting the cumulative share of people living with HIV compared to the cumulative share of 5 × 5-km grid cells (inset). Maps reflect administrative boundaries, land cover, lakes and population; grid cells with fewer than 10 people per 1 × 1 km, and classified as barren or sparsely vegetated, are coloured light grey,,–. Countries coloured dark grey were not included in the analysis. In the inset, dotted lines indicate the cumulative share of people living with HIV and cumulative share of 5 × 5-km grid cells represented by grid cells with fewer than 10, 100 and 1,000 people living with HIV each.
Extended Data Fig. 1
Extended Data Fig. 1. HIV prevalence data by region and country.
a, b, HIV seroprevalence survey data (a) and ANC sentinel surveillance data (b) used in this analysis, by region and country. Colour indicates the data source. AIS, AIDS Indicator Survey; DHS, Demographic and Health Survey; MICS, Multiple Indicator Cluster Survey; PHIA, Population-based HIV Impact Assessment Survey. Shape type indicates whether a data source has point (GPS) or polygon location information. Size indicates the relative effective sample size for each source. A full list of data sources with additional details about data type (such as survey microdata and survey reports) and geographical details are provided in Supplementary Tables 2, 4.
Extended Data Fig. 2
Extended Data Fig. 2. HIV seroprevalence survey data coverage by year.
A data point is defined as a cluster or polygon used in the analysis for the given year. There are a total of 29,103 data points for the HIV seroprevalence surveys from 2000 to 2017. Countries in white have no available survey data in the given year. Countries in dark grey were not included in the analysis.
Extended Data Fig. 3
Extended Data Fig. 3. ANC sentinel surveillance data coverage by year.
A data point is defined as an ANC sentinel surveillance site used in the analysis for the given year. A site may be a hospital, city or town, or administrative region. There are a total of 9,794 ANC data points from 2000 to 2017. Countries in white have no available ANC data in the given year. Countries in dark grey were not included in the analysis.
Extended Data Fig. 4
Extended Data Fig. 4. Relative uncertainty in HIV prevalence in adults aged 15–49 in 2017.
Overlapping population-weighted quartiles of HIV prevalence and relative 95% uncertainty in 2017 at the 5 × 5-km grid cell level. Relative uncertainty is defined as the ratio of the width of the 95% uncertainty interval to the mean estimate. Maps reflect administrative boundaries, land cover, lakes and population; grid cells with fewer than 10 people per 1 × 1 km, and classified as barren or sparsely vegetated, are coloured light grey,,–. Countries in dark grey were not included in the analysis.
Extended Data Fig. 5
Extended Data Fig. 5. Analytic process overview.
The process used to produce HIV prevalence estimates among adults in sub-Saharan Africa involved three main parts. In the data-processing steps (green), data were identified, extracted and prepared for use in the HIV prevalence model and in covariate models. In the modelling phase (orange), we used these data and covariates in a stacked generalization ensemble model and spatiotemporal Gaussian process model. In the post-processing phase (blue), we calibrated the prevalence estimation to match GBD 2017 estimates at the national level, aggregated prevalence estimates to the first- and second-level administrative subdivisions in each country and calculated the number of people living with HIV.
Extended Data Fig. 6
Extended Data Fig. 6. Prevalence of covariates at 5 × 5-km grid cell level in 2017.
ah, Maps of HIV-specific covariates in 2017 include prevalence of male circumcision (a), prevalence of signs and symptoms of sexually transmitted infections (b), prevalence of marriage or living as married (c), prevalence of partner living elsewhere among women (d), prevalence of condom use during the most recent sexual encounter (e), prevalence of sexual activity among young women (f), prevalence of multiple partners among men in the past year (g) and prevalence of multiple partners among women in the past year (h). Maps reflect administrative boundaries, land cover, lakes and population; grid cells with fewer than 10 people per 1 × 1 km, and classified as barren or sparsely vegetated, are coloured light grey,,–. Countries in dark grey were not included in the analysis.
Extended Data Fig. 7
Extended Data Fig. 7. Modelling regions.
Modelling regions were defined as the four GBD regions in sub-Saharan Africa: central, east, south and west. Sudan was included in the east sub-Saharan Africa region for this analysis (in GBD, it is included in the North Africa and Middle East region). Countries in grey were not included in the analysis.

References

    1. GBD 2017 Disease and Injury Incidence and Prevalence Collaborators Global, regional, and national incidence, prevalence, and years lived with disability for 354 diseases and injuries for 195 countries and territories, 1990–2017: a systematic analysis for the Global Burden of Disease Study 2017. Lancet. 2018;392:1789–1858. doi: 10.1016/S0140-6736(18)32279-7. - DOI - PMC - PubMed
    1. GBD 2017 Causes of Death Collaborators Global, regional, and national age-sex-specific mortality for 282 causes of death in 195 countries and territories, 1980–2017: a systematic analysis for the Global Burden of Disease Study 2017. Lancet. 2018;392:1736–1788. doi: 10.1016/S0140-6736(18)32203-7. - DOI - PMC - PubMed
    1. Teeraananchai S, Kerr SJ, Amin J, Ruxrungtham K, Law MG. Life expectancy of HIV-positive people after starting combination antiretroviral therapy: a meta-analysis. HIV Med. 2017;18:256–266. doi: 10.1111/hiv.12421. - DOI - PubMed
    1. Joint United Nations Programme on HIV/AIDS. AIDSinfo. http://aidsinfo.unaids.org/ (UNAIDS, 2018). - PubMed
    1. United Nations Development Programme. The Millennium Development Goals Report 2015. http://www.undp.org/content/undp/en/home/librarypage/mdg/the-millennium-.... (United Nations, 2015).

Publication types