. 2019 Apr;6(2):025006.
doi: 10.1117/1.NPh.6.2.025006. Epub 2019 May 7.

Quantitative in vivo dual-color bioluminescence imaging in the mouse brain

Affiliations

Quantitative in vivo dual-color bioluminescence imaging in the mouse brain

Markus Aswendt et al. Neurophotonics. 2019 Apr.

Abstract

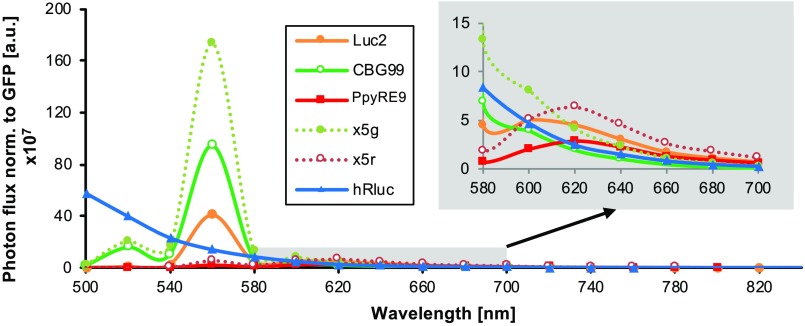
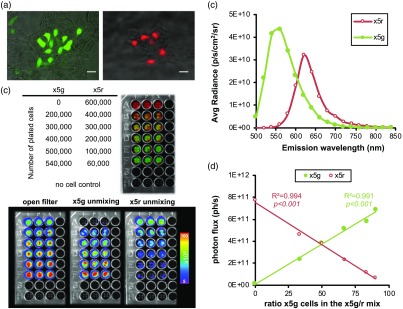
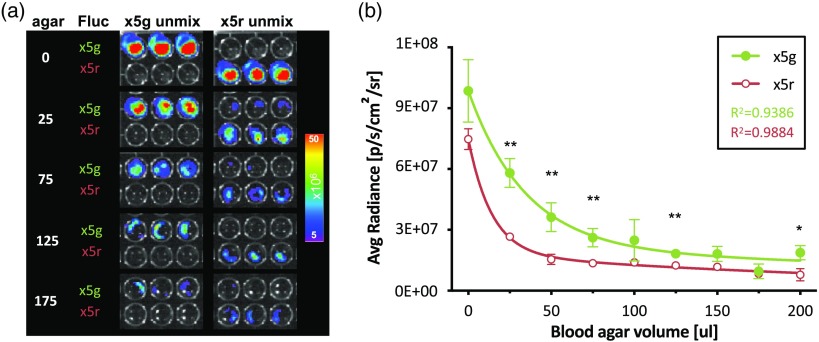
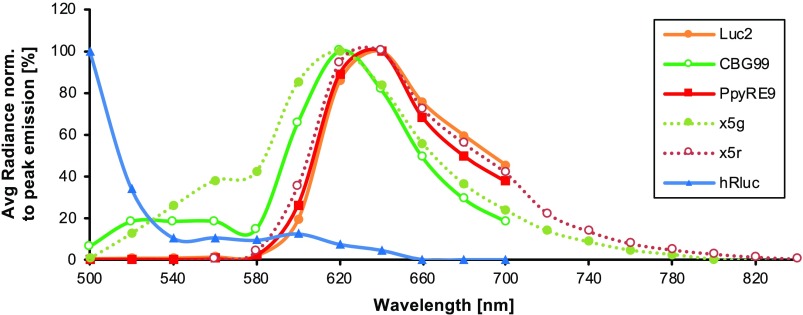
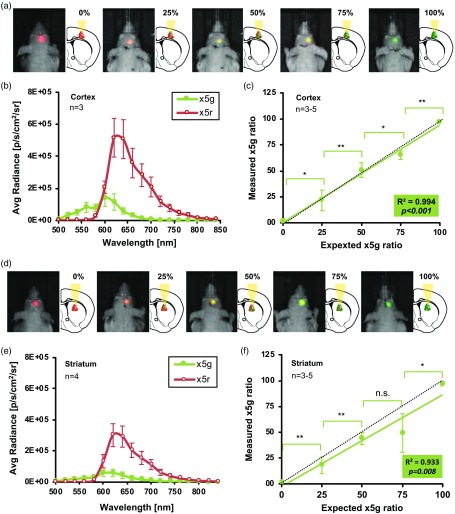
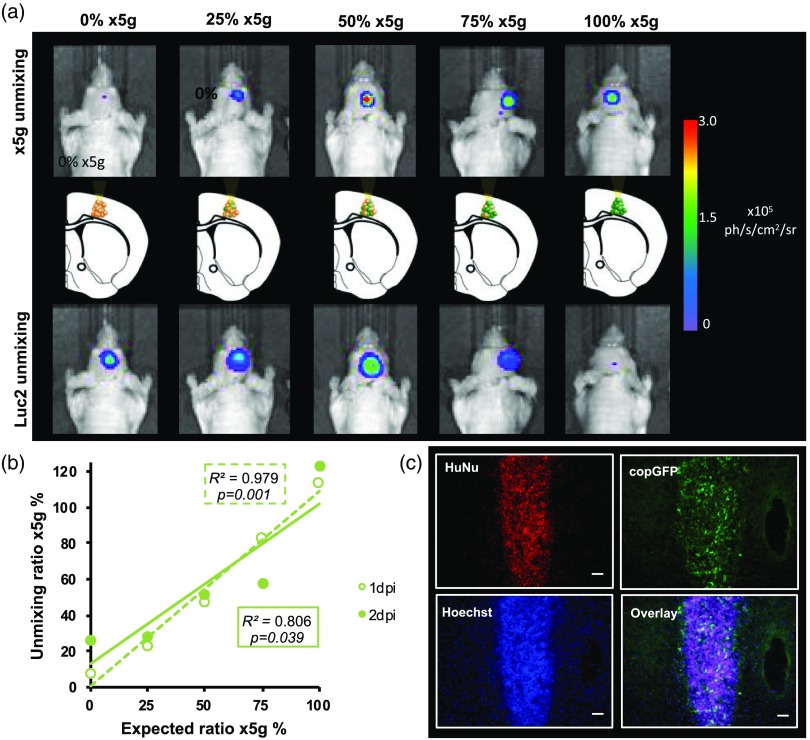
Bioluminescence imaging (BLI) is an optical imaging method that can be translated from the cell culture dish in vitro to cell tracking in small animal models in vivo. In contrast to the more widely used fluorescence imaging, which requires light excitation, in BLI the light is exclusively generated by the enzyme luciferase. The luciferase gene can be engineered to target and monitor almost every cell and biological process quantitatively in vitro and even from deep tissue in vivo. While initially used for tumor imaging, bioluminescence was recently optimized for mouse brain imaging of neural cells and monitoring of viability or differentiation of grafted stem cells. Here, we describe the use of bright color-shifted firefly luciferases (Flucs) based on the thermostable x5 Fluc that emit red and green for effective and quantitative unmixing of two human cell populations in vitro and after transplantation into the mouse brain in vivo. Spectral unmixing predicts the ratio of luciferases in vitro and a mixture of cells precisely for cortical grafts, however, with less accuracy for striatal grafts. This dual-color approach enables the simultaneous visualization and quantification of two cell populations on the whole brain scale, with particular relevance for translational studies of neurological disorders providing information on stem cell survival and differentiation in one imaging session in vivo.

Keywords: bioluminescence; implantation; luciferase; optical imaging; spectral unmixing; stem cells.


Figures

Fig. 1
Fig. 1
Comparison of Luc2, CBG99, PpyRE9, x5g, x5r, and hRluc emission spectra in vitro. Plotted is the photon emission from EF1α-luciferase-T2A-copGFP transfected HEK 293T cells recorded with the IVIS Spectrum CT system (mean of n=4 to 6). Photon emission has been normalized to the individual copGFP expression. Graph with gray background is a zoom-in for 580 to 700 nm to highlight the differences in the red part of the spectra.
Fig. 2
Fig. 2
Unmixing of x5g and x5r luciferases expressed by HEK 293T cells. (a) Fluorescence microscopy overlay with phase contrast image of cells at 2 days post transfection, used for the unmixing experiment (scale bar 25  μm). (b) Unmixed spectra of x5r and x5g calculated by the unmixing algorithm. (c) Plating scheme for x5g and x5r cells in different numbers (n=3) and the corresponding false-colored unmixed results displayed as green/red composite as well as the open filter, x5g, and x5 red unmixed images. (d) Plot of measured unmixed x5g and x5r photon flux plotted against the plated ratio of x5g cells in the mix (n=3). Linear fitting for both luciferases underlines high accuracy of unmixed values with plated cells.
Fig. 3
Fig. 3
In vitro modeling of superficial versus deep x5g and x5r Fluc sources with tissue-like agarose. (a) Different volumes of tissue-like agarose are placed above the HEK 293T cell layer to mimic the overlaying tissue in different thickness. Micrographs represent selected bioluminescence/photo overlays from the x5g and x5r unmixing, respectively. (b) Quantitative analysis and polynomial fit for the decreasing photon emission, detected when more blood agar volume is added.
Fig. 4
Fig. 4
In vivo emission spectra of x5g and x5r, in comparison to Luc2, CBG99, PpyRE9, and hRluc, expressed in mammalian cells implanted in the mouse brain (data in part is adapted from our previous publication comparing different luciferases25).
Fig. 5
Fig. 5
Spectral unmixing efficiently determines x5g/r cell ratios in vivo. Transiently transfected HEK 293T cells expressing x5g or x5r luciferases are transplanted into the cortex (a) or striatum (d) and BLI is applied 1 day later. Non-normalized spectra from the x5g and x5r cells differ, dependent on transplantation depth: cortex (b), striatum (e). Spectral unmixing of x5g ratio is in good agreement with expected (dotted line) x5g ratio for the cortical (c) as well as striatal (f) grafts. Significant differences are highlighted by asterisks.
Fig. 6
Fig. 6
Spectral unmixing of two NSC populations. (a) NSC lines expressing x5g or Luc2 are implanted in different ratios into the cortex of nude mice. (b) Quantitative analysis of spectral unmixing from imaging data acquired 1 day and 2 days post implantation (dpi). (c) Representation of immunohistochemical staining of a NSC graft (EF1α-Luc2-T2A-copGFP). Human nuclei (HuNu) to discriminate the human cell graft in the mouse brain. Enhanced copGFP with anti-copGFP antibody to visualize transplanted cells expressing the transgene. Hoechst stain helps to visualize cell nuclei. Scale bar 50 um.

References

    1. Badr C. E., Ed., Bioluminescent Imaging, Humana Press, Totowa, New Jersey: (2014).
    1. Rehemtulla A., et al. , “Rapid and quantitative assessment of cancer treatment response using in vivo bioluminescence imaging,” Neoplasia 2(6), 491–495 (2000). 10.1038/sj.neo.7900121 - DOI - PMC - PubMed
    1. Kim D.-E., et al. , “Imaging of stem cell recruitment to ischemic infarcts in a murine model,” Stroke 35(4), 952–957 (2004). 10.1161/01.STR.0000120308.21946.5D - DOI - PubMed
    1. Sher F., et al. , “Bioluminescence imaging of Olig2-neural stem cells reveals improved engraftment in a demyelination mouse model,” Stem Cells 27(7), 1582–1591 (2009). 10.1002/stem.v27:7 - DOI - PubMed
    1. Tennstaedt A., et al. , “Noninvasive multimodal imaging of stem cell transplants in the brain using bioluminescence imaging and magnetic resonance imaging,” Methods Mol. Biol. 1052, 153–166 (2013). 10.1007/978-1-62703-559-0 - DOI - PubMed