. 2019 May 15;36(7):101.
doi: 10.1007/s11095-019-2634-3.

Characterization of Plasma Membrane Localization and Phosphorylation Status of Organic Anion Transporting Polypeptide (OATP) 1B1 c.521 T>C Nonsynonymous Single-Nucleotide Polymorphism

Affiliations

Characterization of Plasma Membrane Localization and Phosphorylation Status of Organic Anion Transporting Polypeptide (OATP) 1B1 c.521 T>C Nonsynonymous Single-Nucleotide Polymorphism

Alexandra Crowe et al. Pharm Res. .

Abstract

Purpose: Membrane transport protein organic anion transporting polypeptide (OATP) 1B1 mediates hepatic uptake of many drugs (e.g. statins). The OATP1B1 c.521 T > C (p. V174A) polymorphism has reduced transport activity. Conflicting in vitro results exist regarding whether V174A-OATP1B1 has reduced plasma membrane localization; no such data has been reported in physiologically relevant human liver tissue. Other potential changes, such as phosphorylation, of the V174A-OATP1B1 protein have not been explored. Current studies characterized the plasma membrane localization of V174A-OATP1B1 in genotyped human liver tissue and cell culture and compared the phosphorylation status of V174A- and wild-type (WT)-OATP1B1.

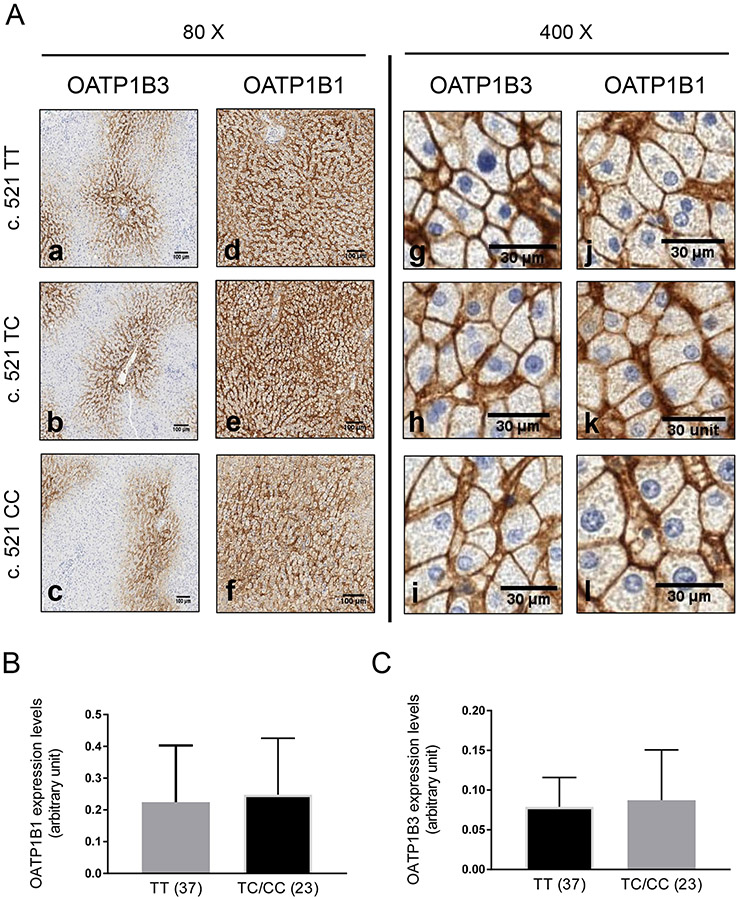
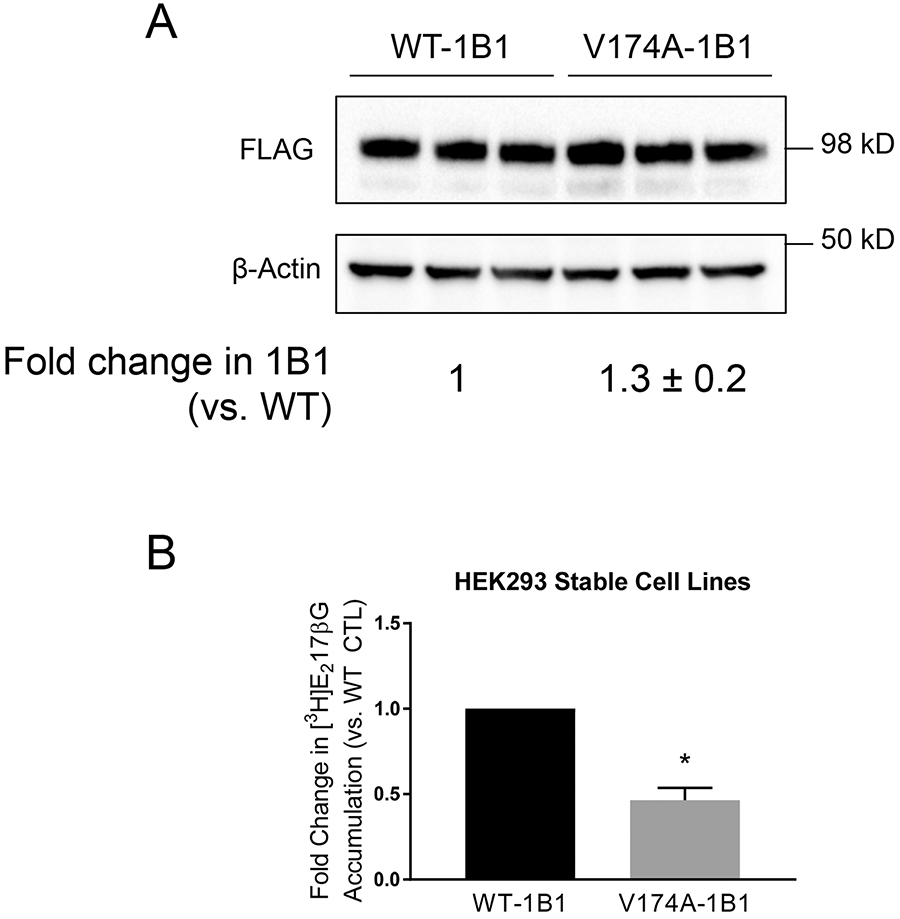
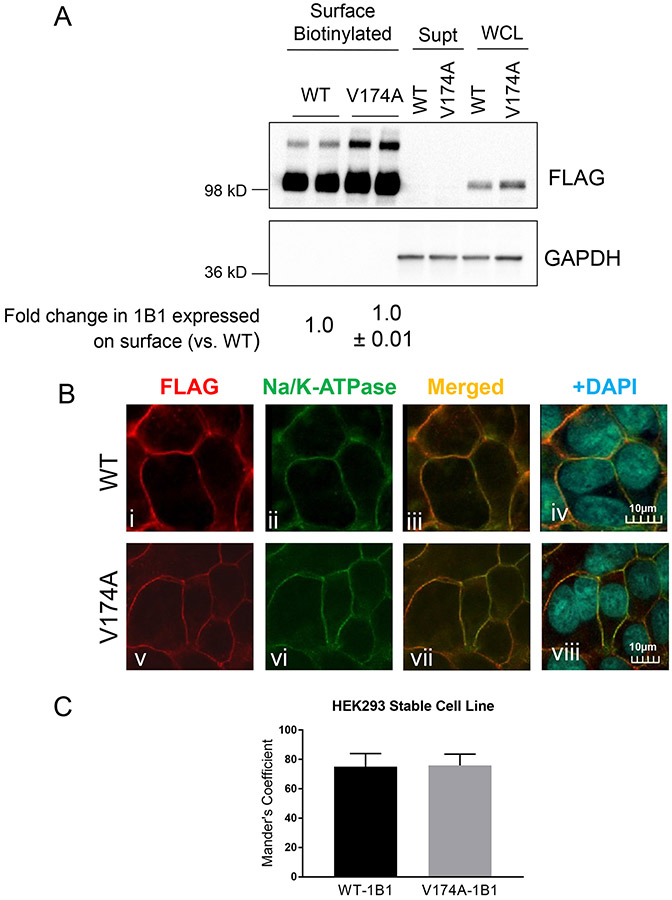
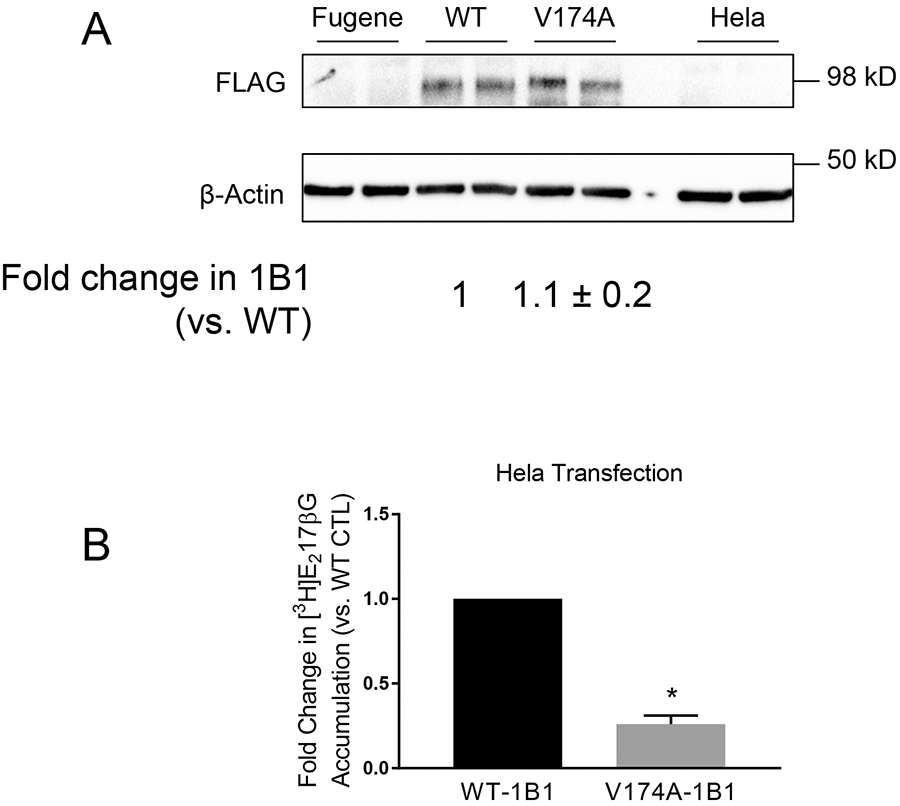
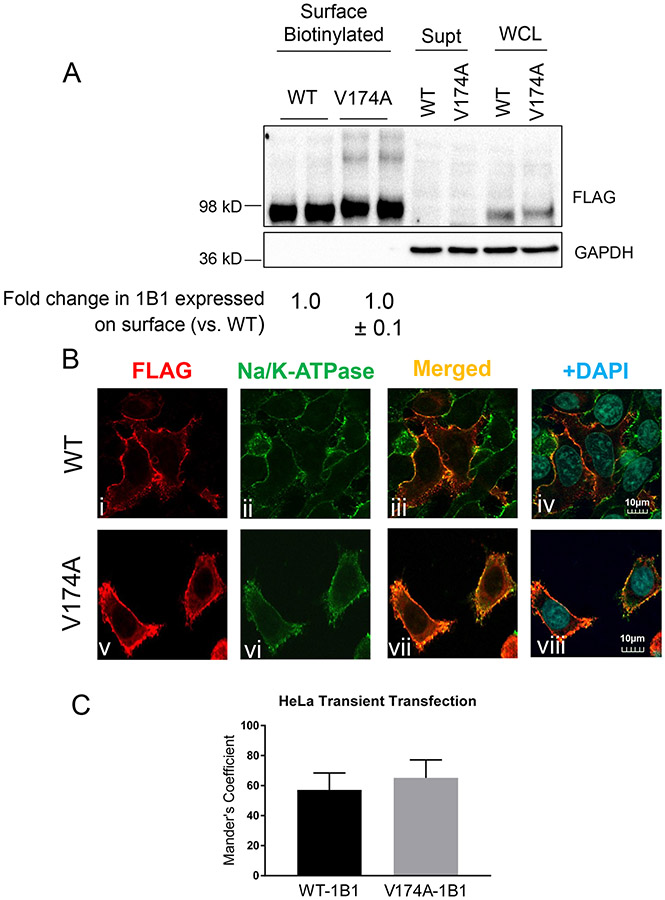
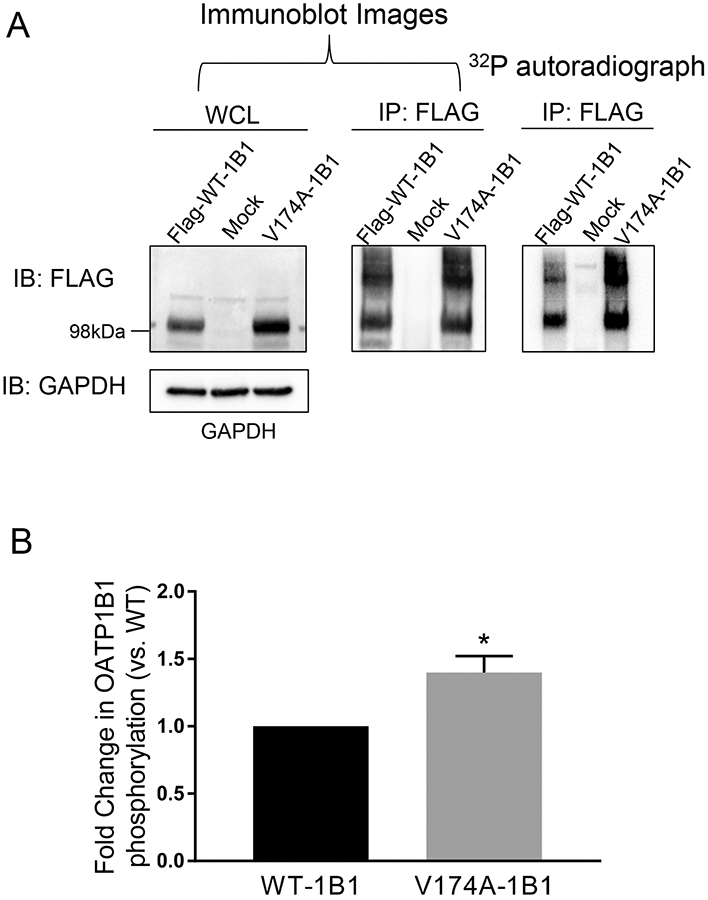
Methods: Localization of V174A- and WT-OATP1B1 were determined in OATP1B1 c.521 T > C genotyped human liver tissue (n = 79) by immunohistochemistry and in transporter-overexpressing human embryonic kidney (HEK) 293 and HeLa cells by surface biotinylation and confocal microscopy. Phosphorylation and transport of OATP1B1 was determined using 32P-orthophosphate labeling and [3H]estradiol-17β-glucuronide accumulation, respectively.

Results: All three methods demonstrated predominant plasma membrane localization of both V174A- and WT-OATP1B1 in human liver tissue and in cell culture. Compared to WT-OATP1B1, the V174A-OATP1B1 has significantly increased phosphorylation and reduced transport.

Conclusions: We report novel findings of increased phosphorylation, but not impaired membrane localization, in association with the reduced transport function of the V174A-OATP1B1.

Keywords: OATP1B1; genotype; phosphorylation; plasma membrane localization; polymorphism.


Figures

Fig. I.
Fig. I.. OATP1B1 and OATP1B3 expression in OATP1B1 c. 521 T>C genotyped human liver tissues.
A. Paraffin-embedded liver sections (4 μm) stained (brown signal) with OATP1B3 (a-c and g-i) and OATP1B1 (d-f and j-l) antibody, detected by DAB-HRP complex. Representative images from n=79 genotyped human liver tissue are shown. Semi-quantification of OATP1B1 (B) and OATP1B3 (C) expression in non-HCV and non-cirrhotic human livers genotyped for c.521 TT (n=37) and TC/CC (n=23) as detailed in Materials and Methods. Statistical analysis was conducted by student t-test.
Fig. II.
Fig. II.. Establishment of the HEK293-FLAG-V174A-OATP1B1 stable cell line and comparison of transport function between V174A- and WT-OATP1B1 in HEK293 stable cell lines.
A. FLAG immunoblot in HEK293-FLAG-WT- and –V174A-OATP1B1 cells. Cells were seeded in 24-well plates at a seeding density of 1.5x10⁵ cells/well and were grown for 48 h. Whole cell lysates were subjected to FLAG immunoblot with β-actin as the loading control. The Mixed-effect model-estimated fold change and associated SE of FLAG-V174A-OATP1B1 protein levels (vs. WT-OATP1B1 control) was expressed as mean ± SE (n=3 in triplicate). B. Mixed-effect model estimated fold change and associated SE of [3H]E217βG (1 μM, 2 min) of V174A-OATP1B1 vs. WT-OATP1B1 (*, p<0.05, n=3, in 5 replicate). In each individual experiment, [3H]E217βG accumulation mediated by WT- or V174A-OATP1B1 was normalized by relative OATP1B1 protein levels in whole cell lysates.
Fig. III.
Fig. III.. Determining plasma membrane localization of V174A- and WT-OATP1B1 in HEK293 stable cell lines.
A. Protein levels of FLAG-WT- and FLAG-V174A-OATP1B1 in whole cell lysates (WCL), biotinylated plasma membrane fraction, and supernatant after NeutrAvidin adsorption. GAPDH was used as a cytoplasmic protein marker. Densitometry of WT- and V174A-OATP1B1 was determined in each fraction. Densitometry of OATP1B1 in the surface fraction was divided by the sum of the densitometry in the surface fraction and supernatant after scaling up to the same amount of proteins as was used in the surface fraction. A mixed-effect model was used to compare the surface levels of OATP1B1 between V174A- and WT-OATP1B1 as described in the Materials and Methods. Model-estimated fold change and associated SE of the surface expression of V174A-OATP1B1 vs. –WT-OATP1B1 is shown (n=3 in duplicate or triplicate). B. Immunofluorescence staining of FLAG and Na/K-ATPase in HEK293 stable cell lines expressing FLAG-WT-OATP1B1 (WT) and FLAG-V174A-OATP1B1 (V174A). Co-immunofluorescence staining of FLAG-tagged WT- or V174A-OATP1B1 (red) and Na/K-ATPase (green) was performed in HEK293 stable cell lines as indicated. Nuclei were counterstained with DAPI (blue). Yellow shows co-localization of FLAG-tagged OATP1B1 and Na/K ATPase. Images were captured using an Olympus FV10i confocal microscope. Representative images are shown from three independent experiments. To quantify the percentage of FLAG-OATP1B1 co-localized with the Na/K-ATPase surface marker, the Mander’s Coefficient was calculated in (C) HEK293 stable cell lines as detailed in the Materials and Methods. Data represent mean ± SD (n=14 images in each group).
Fig. IV.
Fig. IV.. Comparison of transport function between V174A- and WT-OATP1B1 in transiently transfected HeLa cells.
A. FLAG immunoblot in FLAG-WT- and FLAG-V174A-OATP1B1-expressing HeLa cells. HeLa cells were transfected with an expression vector encoding FLAG-WT-, FLAG-V174A-OATP1B1, or Fugene HD reagent alone. Forty-eight hours post-transfection, FLAG immunoblot was conducted with β-actin as the loading control. The mixed-effect model estimated fold change and associated SE in FLAG-OATP1B1 expression of V174A-OATP1B1 vs. WT-OATP1B1 control was expressed as mean ± SE (n=3 in duplicate). B. Mixed-effect model-estimated fold change and associated SE of [3H]E217βG (1 μM, 2 min) of V174A-OATP1B1 vs. WT-OATP1B1 (*, p<0.05, n=3, in triplicate). In each individual experiment, [3H]E217βG accumulation mediated by WT- or V174A-OATP1B1 was normalized by relative OATP1B1 protein levels in whole cell lysates.
Fig. V.
Fig. V.. Determining plasma membrane localization of V174A- and WT-OATP1B1 in HeLa cell lines.
A. Protein levels of FLAG-WT- and FLAG-V174A-OATP1B1 in whole cell lysates (WCL), biotinylated plasma membrane fraction, and supernatant after NeutrAvidin adsorption. GAPDH was used as a cytoplasmic protein marker. Densitometry of WT- and V174A-OATP1B1 was determined in each fraction. Densitometry of OATP1B1 in the surface fraction was divided by the sum of the densitometry in the surface fraction and supernatant after scaling up to the same amount of proteins as was used in the surface fraction. A mixed-effect model was used to compare the surface levels of OATP1B1 between V174A- and WT-OATP1B1 as described in the Materials and Methods. Model-estimated fold change and associated SE of the surface expression of V174A-OATP1B1 vs. –WT-OATP1B1 is shown (n=3 in duplicate). B. Immunofluorescence staining of FLAG and Na/K-ATPase in HeLa cells transfected with FLAG-WT-OATP1B1 (WT) or FLAG-V174A-OATP1B1 (V174A). Co-immunofluorescence staining of FLAG-tagged WT- or V174A-OATP1B1 (red) and Na/K-ATPase (green) was performed in transfected HeLa cells as indicated. Nuclei were counterstained with DAPI (blue). Yellow shows co-localization of FLAG-tagged OATP1B1 and Na/K-ATPase. Images were taken using an Olympus FV10i confocal microscope at a resolution of 1024x1024 and 120X objective. Representative images from the same experiment are shown (n=3 independent experiments). To quantify the percentage of FLAG-OATP1B1 co-localized with the Na/K-ATPase surface marker, the Mander’s Coefficient was calculated in (C) transiently transfected HeLa cells as detailed in the Methods section. Data represent mean ± SD (n≥8 images in each group).
Fig. VI.
Fig. VI.. Increased phosphorylation status of OATP1B1 with V174A variant in the HEK293 stable cell line.
A. Phosphorylation of WT- and V174A-OATP1B1. HEK293-FLAG-WT- and –V174A-OATP1B1 cells were seeded at a density of 2-2.5x10⁶ cells/100mm2 dish. Forty-eight hours after seeding, cells were metabolically labelled with 32P-orthophosphate for 5 h at 37°C. After labelling, cells were lysed and whole cell lysates (500 μg) were immunoprecipitated (IP) with FLAG antibody and subjected to autoradiography and subsequent immunoblot (IB) with FLAG and GAPDH antibodies. Representative images from four independent experiments are shown. B. Densitometry of 32P-labelled WT-OATP1B1 and V174A-OATP1B1 was normalized by its respective protein amount, as detected by FLAG immunoblot. A mixed-effect model was used to compare the phosphorylation of OATP1B1 between V174A- and WT-OATP1B1 as described in the Materials and Methods. Model-estimated fold change and associated SE of phosphorylation of V174A-OATP1B1 vs. WT-OATP1B1 is shown (* p<0.05, n=4).

References

    1. Niemi M, Pasanen MK, Neuvonen PJ. Organic anion transporting polypeptide 1B1: a genetically polymorphic transporter of major importance for hepatic drug uptake. Pharmacol Rev. 2011;63(1):157–181. - PubMed
    1. Hirano M, Maeda K, Shitara Y, Sugiyama Y. Contribution of OATP2 (OATP1B1) and OATP8 (OATP1B3) to the hepatic uptake of pitavastatin in humans. J Pharmacol Exp Ther. 2004;311(1):139–146. - PubMed
    1. Hsiang B, Zhu Y, Wang Z, Wu Y, Sasseville V, Yang WP, Kirchgessner TG. A novel human hepatic organic anion transporting polypeptide (OATP2). Journal of Biological Chemistry. 1999;274(52):37161–37168. - PubMed
    1. Simonson SG, Raza A, Martin PD, Mitchell PD, Jarcho JA, Brown CD, Windass AS, Schneck DW. Rosuvastatin pharmacokinetics in heart transplant recipients administered an antirejection regimen including cyclosporine. Clin Pharmacol Ther. 2004;76(2):167–177. - PubMed
    1. Yamaguchi H, Takeuchi T, Okada M, Kobayashi M, Unno M, Abe T, Goto J, Hishinuma T, Shimada M, Mano N. Screening of antibiotics that interact with organic anion-transporting polypeptides 1B1 and 1B3 using fluorescent probes. Biol Pharm Bull. 2011;34(3):389–395. - PubMed

MeSH terms

Substances

LinkOut - more resources