. 2020 Mar 17;70(7):1294-1303.
doi: 10.1093/cid/ciz404.

Early Signals of Vaccine-driven Perturbation Seen in Pneumococcal Carriage Population Genomic Data

Affiliations

Early Signals of Vaccine-driven Perturbation Seen in Pneumococcal Carriage Population Genomic Data

Chrispin Chaguza et al. Clin Infect Dis. .

Abstract

Background: Pneumococcal conjugate vaccines (PCVs) have reduced pneumococcal diseases globally. Pneumococcal genomic surveys elucidate PCV effects on population structure but are rarely conducted in low-income settings despite the high disease burden.

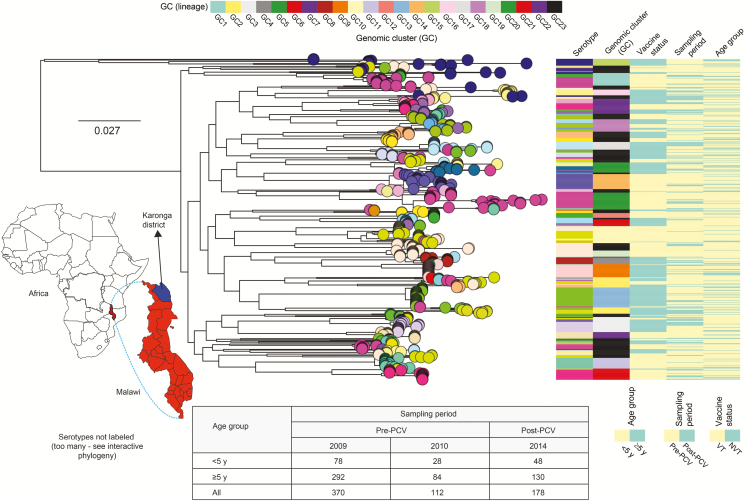
Methods: We undertook whole-genome sequencing (WGS) of 660 pneumococcal isolates collected through surveys from healthy carriers 2 years from 13-valent PCV (PCV13) introduction and 1 year after rollout in northern Malawi. We investigated changes in population structure, within-lineage serotype dynamics, serotype diversity, and frequency of antibiotic resistance (ABR) and accessory genes.

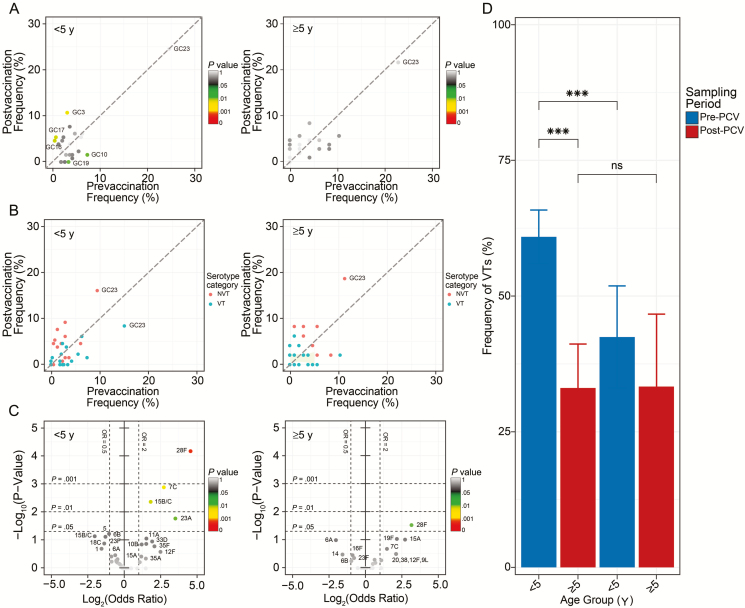
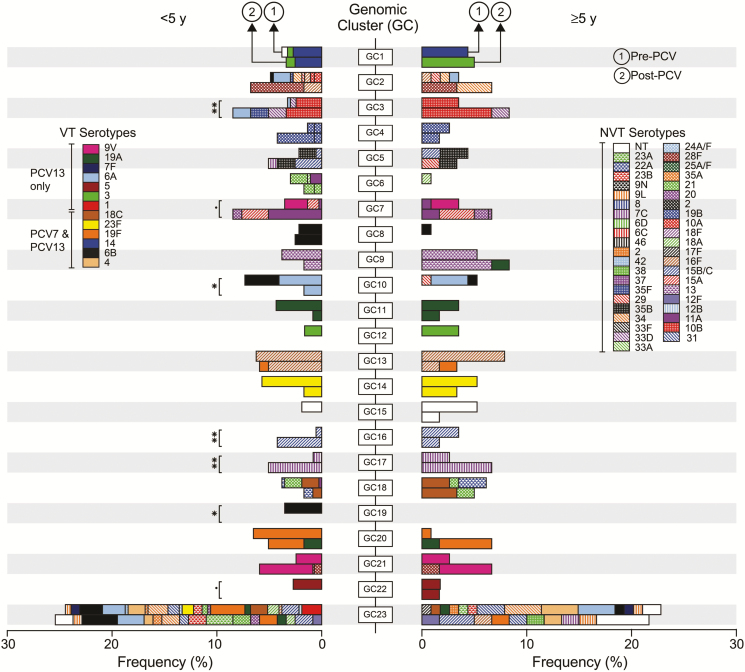
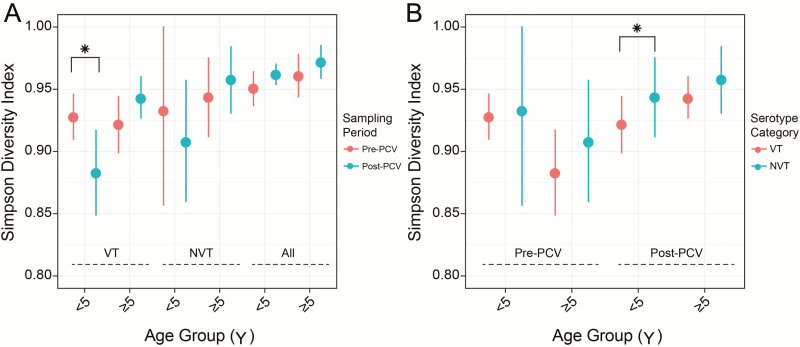
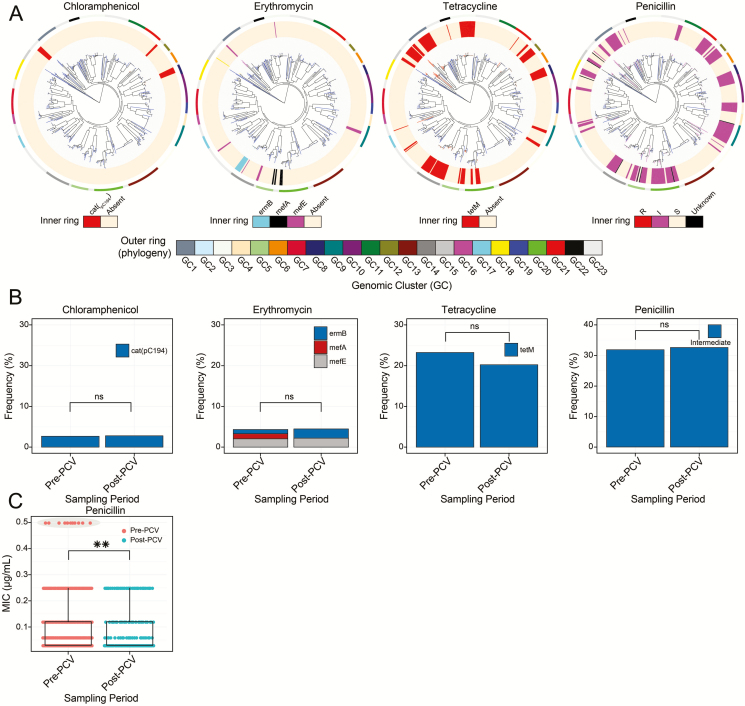
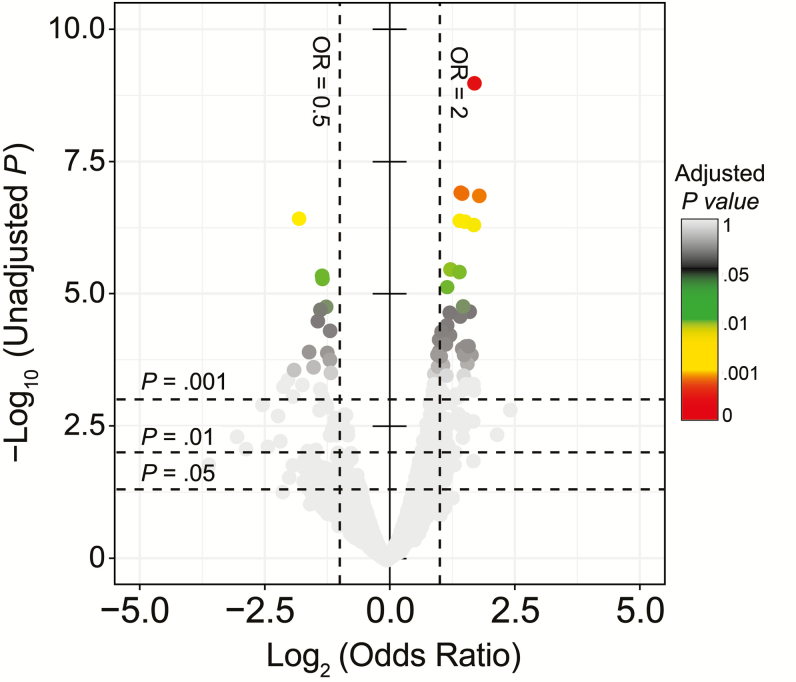
Results: In children <5 years of age, frequency and diversity of vaccine serotypes (VTs) decreased significantly post-PCV, but no significant changes occurred in persons ≥5 years of age. Clearance of VT serotypes was consistent across different genetic backgrounds (lineages). There was an increase of nonvaccine serotypes (NVTs)-namely 7C, 15B/C, and 23A-in children <5 years of age, but 28F increased in both age groups. While carriage rates have been recently shown to remain stable post-PCV due to replacement serotypes, there was no change in diversity of NVTs. Additionally, frequency of intermediate-penicillin-resistant lineages decreased post-PCV. Although frequency of ABR genes remained stable, other accessory genes, especially those associated with mobile genetic element and bacteriocins, showed changes in frequency post-PCV.

Conclusions: We demonstrate evidence of significant population restructuring post-PCV driven by decreasing frequency of vaccine serotypes and increasing frequency of few NVTs mainly in children under 5. Continued surveillance with WGS remains crucial to fully understand dynamics of the residual VTs and replacement NVT serotypes post-PCV.

Keywords: carriage; genomics; pneumococcus; serotypes.


Figures

Figure 1.
Figure 1.
Sampling location, genetic similarity, and distribution of carried pneumococcal isolates. The map of Africa shows the location of Malawi and Karonga district from which the isolates were sampled. The number of isolates (n = 660) used in the genomic analysis are shown in the table below the phylogenetic tree. The core genome maximum likelihood phylogenetic tree of the 660 carriage isolates rooted at the branch of “classical” nontypeables. The tips (circles) of the tree are colored by serotype, and colored panels to the right correspond to serotype, genomic clusters or lineage, vaccine status, sampling period, and age group. The tree with metadata and corresponding international definitions of the pneumococcal lineages is available interactively online at https://microreact.org/project/xH7-VcoWj/8a339d57. Abbreviations: GC, genomic cluster; NVT, nonvaccine serotype; PCV, pneumococcal conjugate vaccine; VT, vaccine serotype.
Figure 2.
Figure 2.
Frequency of lineages and serotypes in carriage. A and B, Frequency of lineages (A) and frequency of vaccine serotypes (B) before and after pneumococcal conjugate vaccine (PCV) in individuals <5 and ≥5 years of age. C, Volcano plots showing odds ratios (ORs) of individual serotypes pre- and post-PCV in those <5 and ≥5 years of age. The x-axis shows magnitude (log2 [OR]) and y-axis shows statistical significance (–log10P value). D, Frequency of vaccine serotypes in those <5 and ≥5 years of age. Statistically significant changes are marked as ***P < .001. The comparative estimates of prevalence for serotypes, lineages, and ORs are provided in Supplementary Tables 1–5. Abbreviations: GC, genomic cluster; ns, not significant; NVT, nonvaccine serotype; PCV, pneumococcal conjugate vaccine; VT, vaccine serotype.
Figure 3.
Figure 3.
Dynamics of pneumococcal lineages and serotypes. The leftward facing stacked bar graph shows frequency of lineages in individuals <5 years while the rightward facing bar graph shows frequency of lineages and their constituent serotypes in those aged ≥5 years before and after pneumococcal conjugate vaccine (PCV) introduction. The bar graphs are aligned by genomic clusters (GCs) for easy comparisons of frequency of serotypes pre- and post-PCV between the 2 age groups. The serotypes are distinguished by different colors in the bar graphs as described in the key. The GC23 is the “bin” cluster because it consists of isolates not placed in monophyletic clusters GC1–GC22. The lineages whose frequency changed significantly post-PCV are marked as *P < .05 and **P < .01, and those with borderline significance (P < .095) are marked with (.). The Fisher exact test was used to determine P values. Abbreviations: NT, nontypeable; PCV7, 7-valent pneumococcal conjugate vaccine; PCV13, 13-valent pneumococcal conjugate vaccine; VT, vaccine serotype.
Figure 4.
Figure 4.
Genetic diversity of a recently emerged serotype (28F). Boxplots showing within (Malawi) and between country (Malawi and South Africa) genetic diversity of serotype 28F isolates showing in GC2 (A) and GC21 (B). Lineage GC21 also includes serotype 9V isolates, some of which underwent a capsule switch to acquire a serotype 28F capsule. Abbreviation: SNP, single-nucleotide polymorphism.
Figure 5.
Figure 5.
Serotype composition and diversity in context of pneumococcal conjugate vaccine (PCV). A, Simpson diversity index for composition of serotypes between pre- and post-PCV datasets among vaccine serotypes (VT), nonvaccine serotypes (NVT), and all isolates. B, Simpson diversity index for composition of serotypes between VT and NVT isolates sampled pre- and post-PCV. Statistically significant changes are marked as *P < .05. The estimates and P values for frequency of VTs and Simpson diversity are provided in Supplementary Tables 6 and 7.
Figure 6.
Figure 6.
Distribution of antibiotic resistance (ABR) genes and mobile genetic elements before and after pneumococcal conjugate vaccine (PCV) introduction. A, Distribution of the chloramphenicol resistance gene (catpC194), erythromycin resistance genes (mefA, mefE, and ermB), tetracycline resistance gene (tetM), and penicillin resistance genes across the phylogenetic tree of the carried pneumococcal isolates. Presence and absence of genes is indicated by colored branches and innermost ring surrounding the phylogeny as shown in the key at the bottom of each tree. B, Frequency of genotypic ABR rates for chloramphenicol, erythromycin, tetracycline, and intermediate-penicillin-resistance pre- and post-PCV. C, Distribution of penicillin minimum inhibitory concentration pre- and post-PCV. The subsets with statistically significant changes are marked as **P < .01. The estimates for frequency of the ABR genes are provided in Supplementary Table 8. Abbreviations: GC, genomic cluster; MIC, minimum inhibitory concentration; ns, not significant; PCV, pneumococcal conjugate vaccine.
Figure 7.
Figure 7.
Pneumococcal accessory genome dynamics. The distribution of 2591 intermediate-frequency-accessory genes in the entire pneumococcal population. The volcano plot shows magnitude (log2 OR) on the x-axis and statistical significance (–log10P value) and odds ratio (OR) for presence of accessory genes post–pneumococcal conjugate vaccine (PCV) relative to pre-PCV after controlling for vaccine status and age group of the isolates. The points were colored by adjusted P values after correcting for multiple testing using Bonferroni method. The estimates for the OR and P values are provided in Supplementary Table 9.

References

    1. Ben-Shimol S, Givon-Lavi N, Leibovitz E, Raiz S, Greenberg D, Dagan R. Impact of widespread introduction of pneumococcal conjugate vaccines on pneumococcal and nonpneumococcal otitis media. Clin Infect Dis 2016; 63:611–8. - PubMed
    1. Whitney CG, Farley MM, Hadler J, et al. . Active Bacterial Core Surveillance of the Emerging Infections Program Network Decline in invasive pneumococcal disease after the introduction of protein-polysaccharide conjugate vaccine. N Engl J Med 2003; 348:1737–46. - PubMed
    1. Gordon SB, Kanyanda S, Walsh AL, et al. . Poor potential coverage for 7-valent pneumococcal conjugate vaccine, Malawi. Emerg Infect Dis 2003; 9:747–9. - PMC - PubMed
    1. von Gottberg A, de Gouveia L, Tempia S, et al. . GERMS-SA Investigators Effects of vaccination on invasive pneumococcal disease in South Africa. N Engl J Med 2014; 371:1889–99. - PubMed
    1. Hammitt LL, Akech DO, Morpeth SC, et al. . Population effect of 10-valent pneumococcal conjugate vaccine on nasopharyngeal carriage of Streptococcus pneumoniae and non-typeable Haemophilus influenzae in Kilifi, Kenya: findings from cross-sectional carriage studies. Lancet Glob Health 2014; 2:e397–405. - PMC - PubMed

Publication types