

Particle and vapor emissions from vat polymerization desktop-scale 3-dimensional printers
- PMID: 31094667
- PMCID: PMC6863047
- DOI: 10.1080/15459624.2019.1612068
Particle and vapor emissions from vat polymerization desktop-scale 3-dimensional printers
Abstract
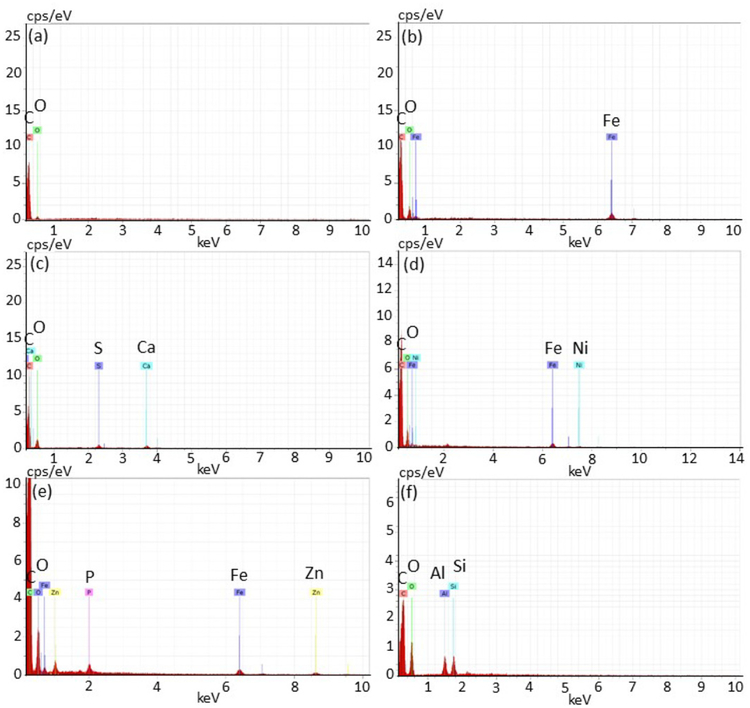
Little is known about emissions and exposure potential from vat polymerization additive manufacturing, a process that uses light-activated polymerization of a resin to build an object. Five vat polymerization printers (three stereolithography (SLA) and two digital light processing (DLP) were evaluated individually in a 12.85 m3 chamber. Aerosols (number, size) and total volatile organic compounds (TVOC) were measured using real-time monitors. Carbonyl vapors and particulate matter were collected for offline analysis using impingers and filters, respectively. During printing, particle emission yields (#/g printed) ranged from 1.3 ± 0.3 to 2.8 ± 2.6 x 10⁸ (SLA printers) and from 3.3 ± 1.5 to 9.2 ± 3.0 x 10⁸ (DLP printers). Yields for number of particles with sizes 5.6 to 560 nm (#/g printed) were 0.8 ± 0.1 to 2.1 ± 0.9 x 10¹⁰ and from 1.1 ± 0.3 to 4.0 ± 1.2 x 10¹⁰ for SLA and DLP printers, respectively. TVOC yield values (µg/g printed) ranged from 161 ± 47 to 322 ± 229 (SLA printers) and from 1281 ± 313 to 1931 ± 234 (DLP printers). Geometric mean mobility particle sizes were 41.1-45.1 nm for SLA printers and 15.3-28.8 nm for DLP printers. Mean particle and TVOC yields were statistically significantly higher and mean particle sizes were significantly smaller for DLP printers compared with SLA printers (p < 0.05). Energy dispersive X-ray analysis of individual particles qualitatively identified potential occupational carcinogens (chromium, nickel) as well as reactive metals implicated in generation of reactive oxygen species (iron, zinc). Lung deposition modeling indicates that about 15-37% of emitted particles would deposit in the pulmonary region (alveoli). Benzaldehyde (1.0-2.3 ppb) and acetone (0.7-18.0 ppb) were quantified in emissions from four of the printers and 4-oxopentanal (0.07 ppb) was detectable in the emissions from one printer. Vat polymerization printers emitted nanoscale particles that contained potential carcinogens, sensitizers, and reactive metals as well as carbonyl compound vapors. Differences in emissions between SLA and DLP printers indicate that the underlying technology is an important factor when considering exposure reduction strategies such as engineering controls.
Keywords: 3-dimensional printing; digital light processing; stereolithography; ultrafine particles; vat polymerization; volatile organic compounds.
Figures
References
-
- Azimi P, Zhao D, Pouzet C, Crain NE, and Stephens B: Emissions of ultrafine particles and volatile organic compounds from commercially available desktop three-dimensional printers with multiple filaments. Environ. Sci. Technol 50:1260–1268 (2016). - PubMed
-
- Deng Y, Cao SJ, Chen A, and Guo Y: The impact of manufacturing parameters on submicron particle emissions from a desktop 3D printer in the perspective of emission reduction. Build. Environ 204:311–319 (2016).
-
- Floyd EL, Wang J, and Regens JL: Fume emissions from a low-cost 3-D printer with various filaments. J. Occup. Environ. Hyg 14:523–533 (2017). - PubMed
-
- Kim Y, Yoon C, Ham S, et al.: Emissions of nanoparticles and gaseous material from 3D printer operation. Environ. Sci. Technol 49:12044–12053 (2015). - PubMed
-
- Stabile L, Scungio M, Buonanno G, Arpiño F, and Ficco G: Airborne particle emission of a commercial 3D printer: The effect of filament material and printing temperature. Indoor Air 27:398–408 (2017). - PubMed
MeSH terms
Substances
Grants and funding
LinkOut - more resources
Full Text Sources
Other Literature Sources
Medical